

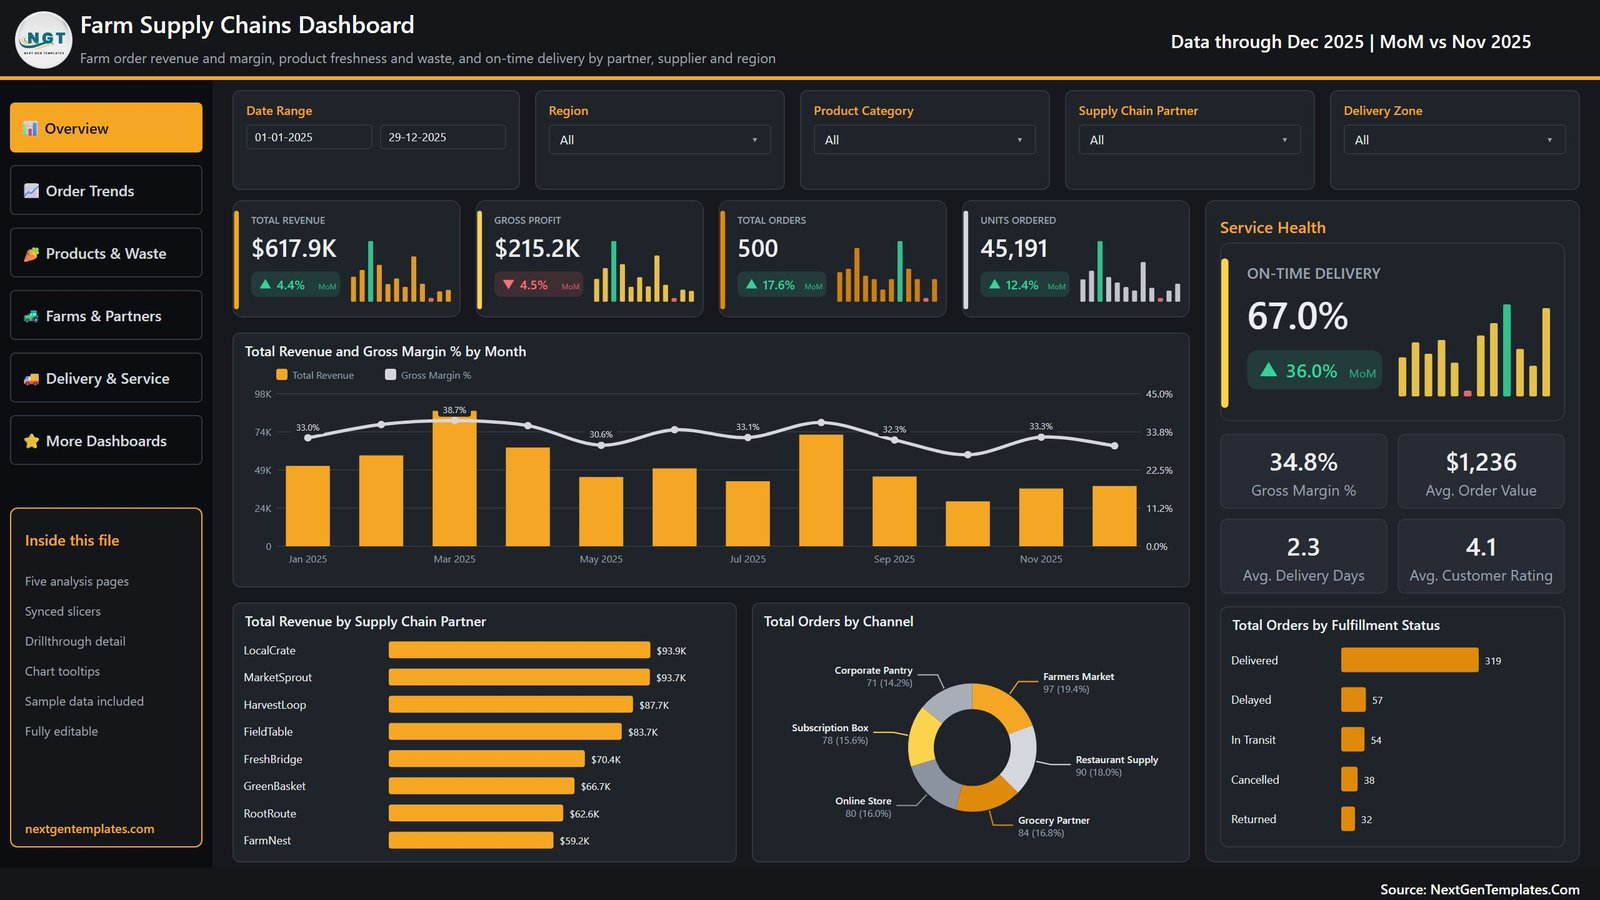
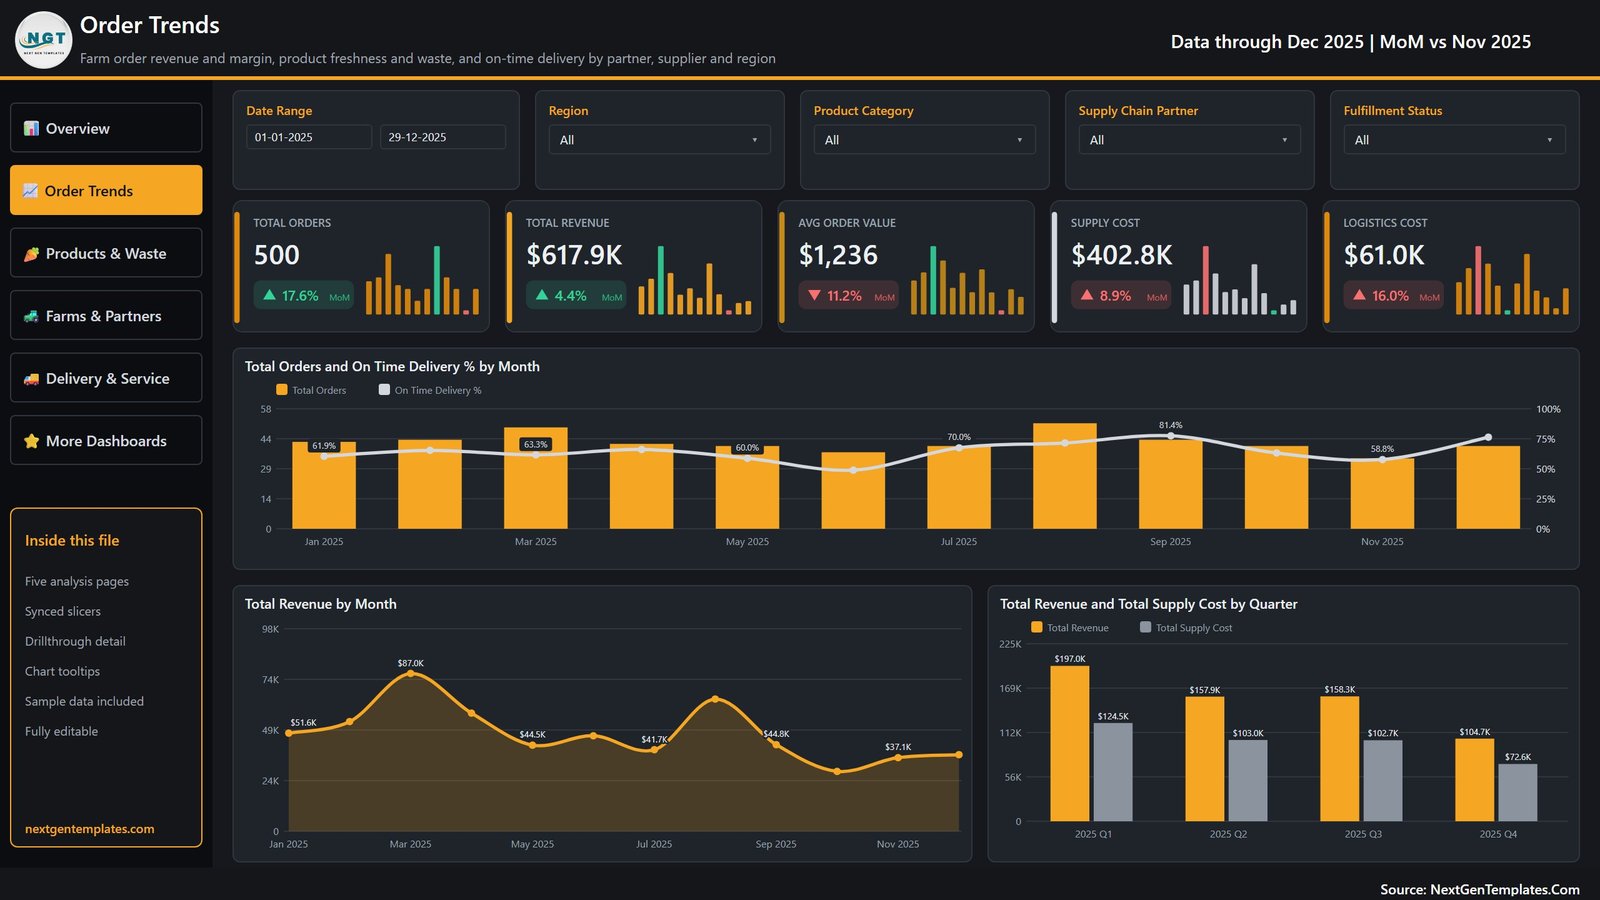
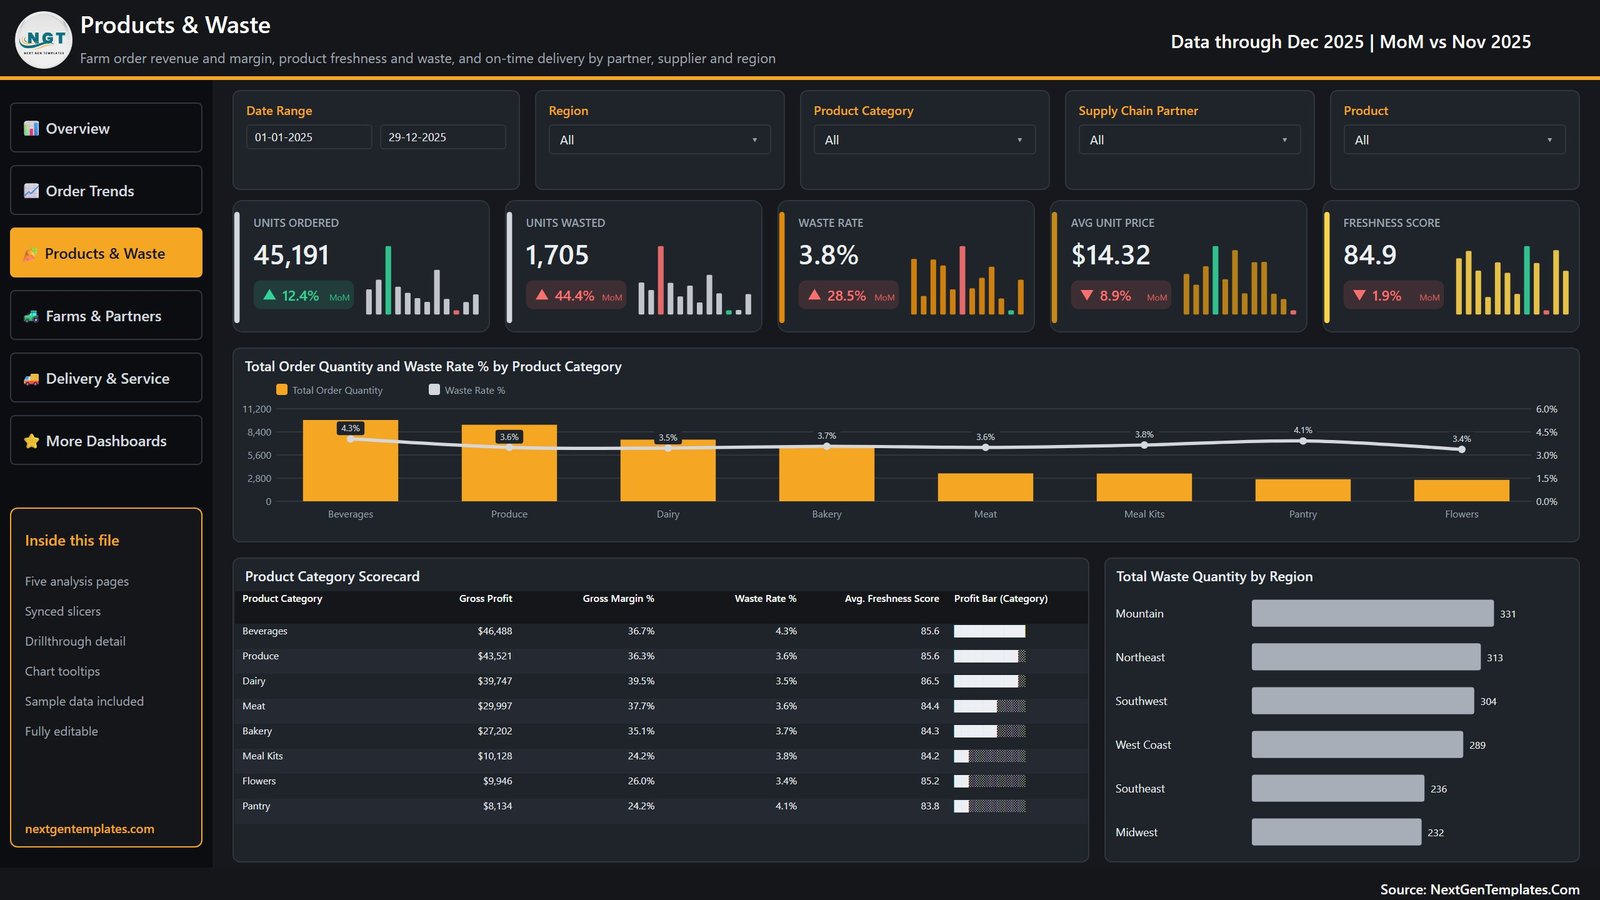
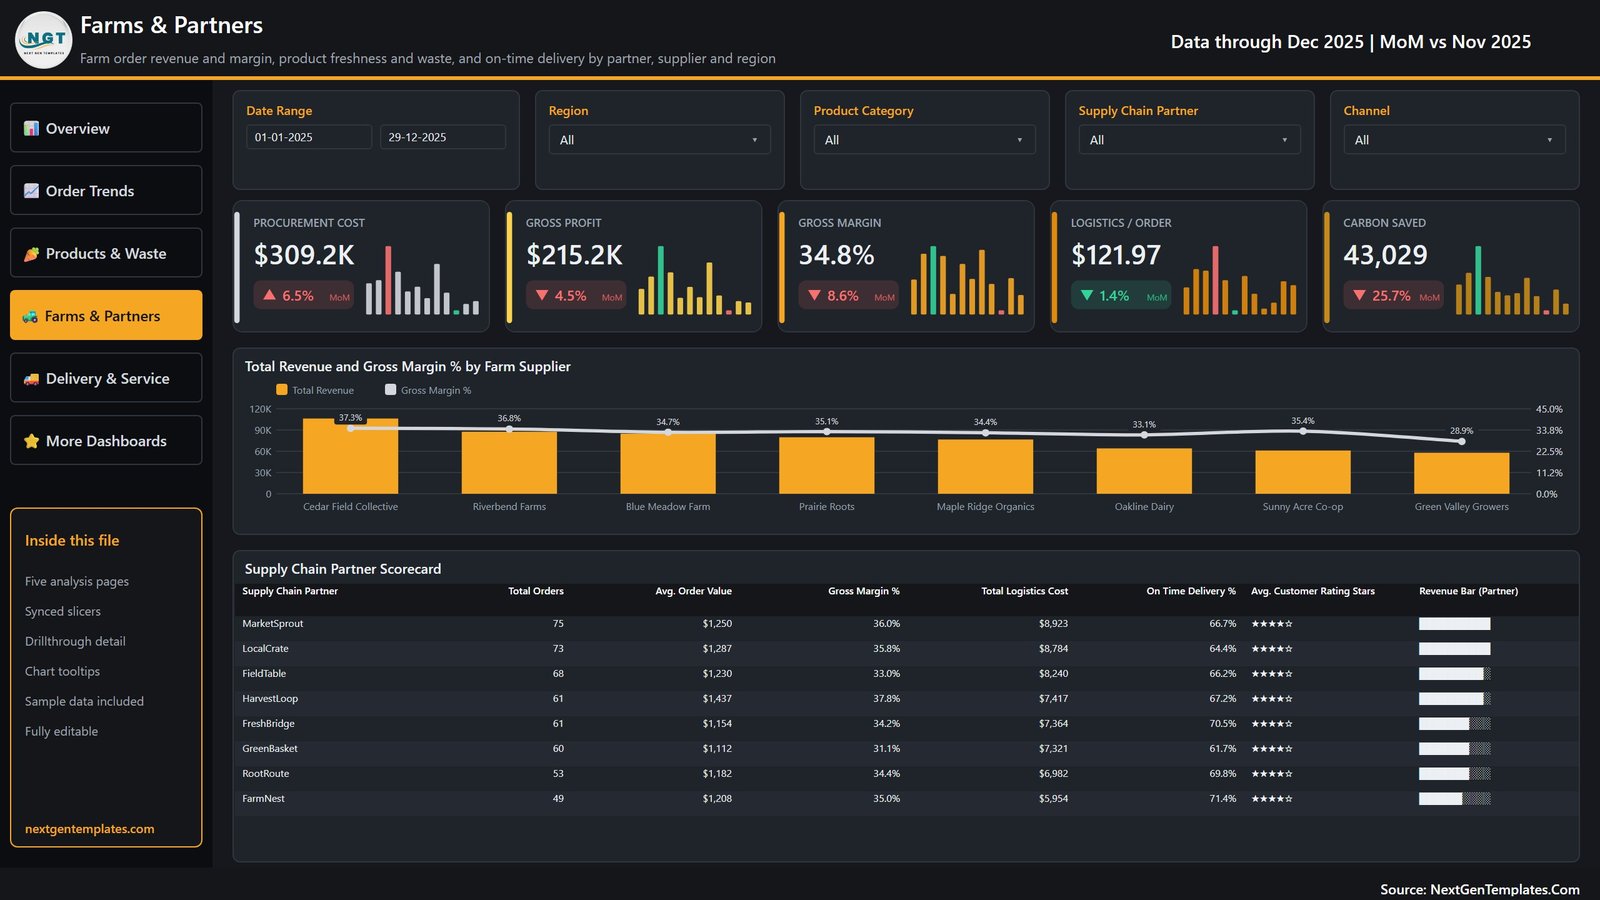
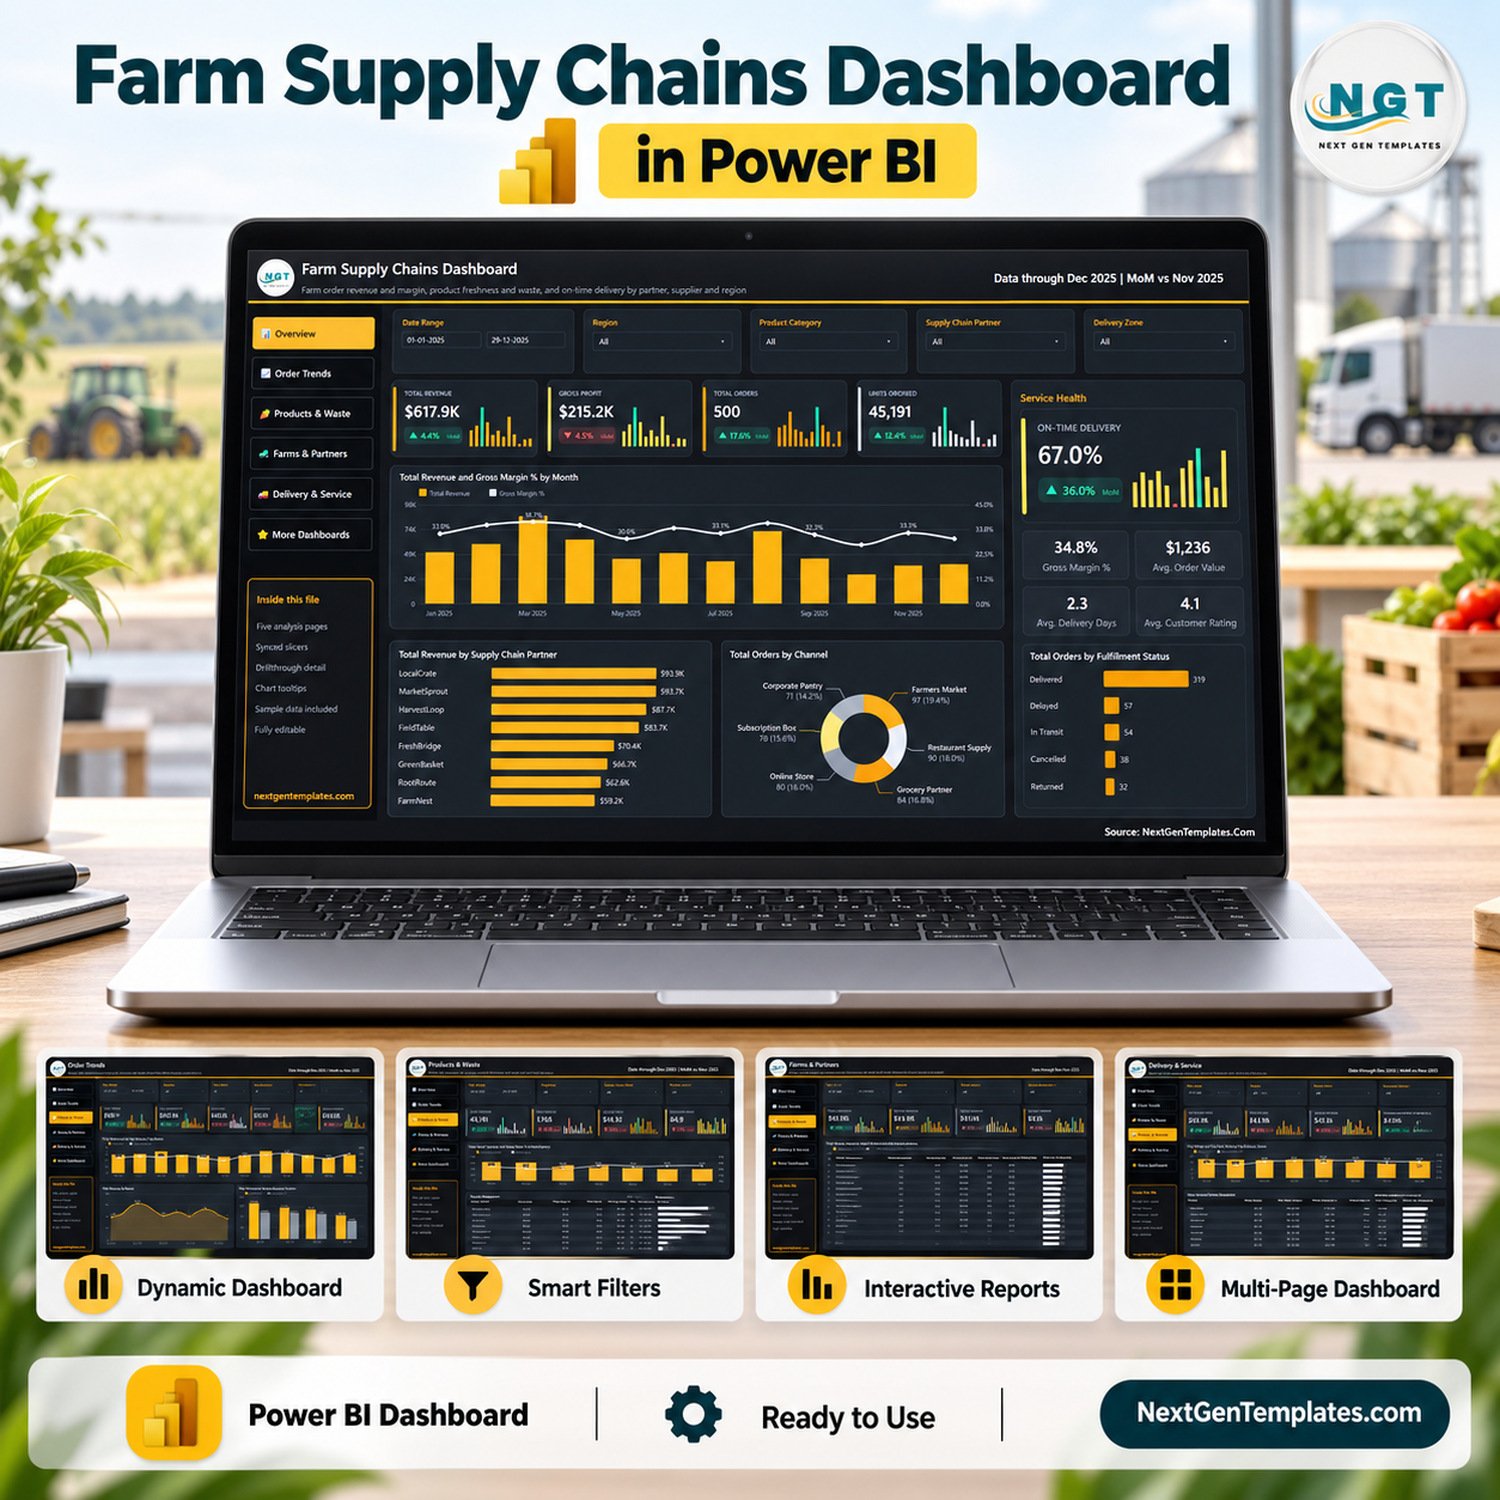
The Farm Supply Chains Dashboard in Power BI turns 500 sample farm orders into a 5-page Power BI Desktop report with 25 KPI cards, 15 visuals and 5 slicers on every page. The sample model covers 8 fictional supply chain partners, 8 farm suppliers, 8 product categories, 6 sales channels and 6 delivery zones, dated 1 January to 29 December 2025, so every page opens already populated.
🌾 It is built for farm cooperatives, food hubs, farm-to-business distributors and the analysts who report on them: one screen for order revenue and margin, product waste and freshness, and on-time delivery by partner, supplier and region, without a subscription BI platform.
✅ Instant download · One-time payment · No subscription · Lifetime access
🔑 Key Features of the Farm Supply Chains Dashboard in Power BI
📊 Five analysis pages with side navigation. Overview, Order Trends, Products & Waste, Farms & Partners and Delivery & Service sit behind a left-hand menu, plus a More Dashboards page that lists other NextGenTemplates Power BI templates and our services.
🎯 25 KPI cards with month-on-month change. Each page carries five headline cards such as Total Revenue ($617.9K), Gross Profit ($215.2K), Waste Rate (3.8%) and Delay Rate (11.4%). Every card shows the change against November 2025 and a 12-month mini column trend.
🔍 Consistent slicers on every page. Date Range, Region, Product Category and Supply Chain Partner appear on all five pages, and each page adds one filter of its own: Delivery Zone, Fulfillment Status, Product, Channel or Customer Type.
🥕 Waste and freshness next to revenue. The report counts 1,705 units wasted out of 45,191 ordered, a 3.8% waste rate and an 84.9 average freshness score, and breaks both down by product category and region.
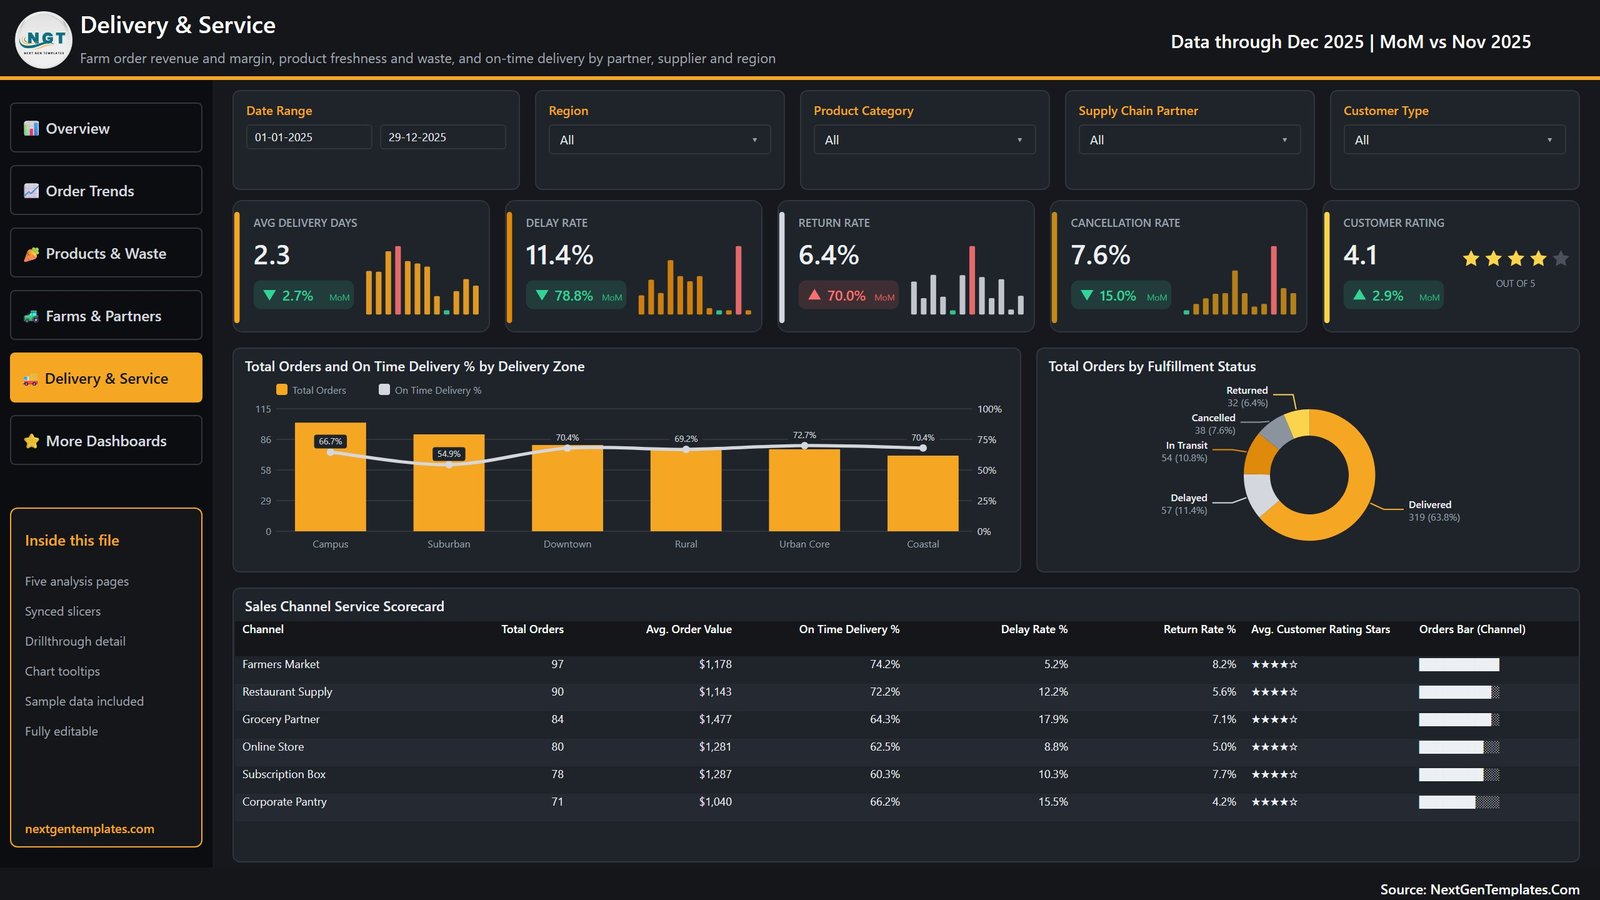
🚚 Delivery service in one place. On-Time Delivery (67.0%), Avg Delivery Days (2.3), Delay Rate, Return Rate (6.4%), Cancellation Rate (7.6%) and Customer Rating (4.1 out of 5) are set against delivery zones and sales channels.
🤝 Three ready-made scorecards. The Product Category Scorecard, the Supply Chain Partner Scorecard and the Sales Channel Service Scorecard rank categories, partners and channels on margin, waste, on-time delivery and rating.
🧭 Drillthrough and tooltips already wired. A hidden Details drillthrough page accepts partner, region, farm supplier, category, product, channel, customer type, delivery zone and fulfillment status, and two tooltip pages add trend and metric detail on hover. The model holds 85 DAX measures.
📦 What’s Inside the Farm Supply Chain Power BI Template
The download is one zip with the .pbix report file, the Data.xlsx sample source (500 orders, 24 columns) and the Power BI Dashboard user manual PDF. You need Power BI Desktop, which Microsoft offers free for Windows.
Page 1: Overview
Cards for Total Revenue, Gross Profit, Total Orders (500) and Units Ordered, plus a Service Health panel with On-Time Delivery, Gross Margin % (34.8%), Avg. Order Value ($1,236), Avg. Delivery Days and Avg. Customer Rating. Charts include Total Revenue and Gross Margin % by Month, Total Revenue by Supply Chain Partner, Total Orders by Channel and Total Orders by Fulfillment Status.
Page 2: Order Trends
Cards for Total Orders, Total Revenue, Avg Order Value, Supply Cost ($402.8K) and Logistics Cost ($61.0K). Charts include Total Orders and On Time Delivery % by Month, Total Revenue by Month and Total Revenue and Total Supply Cost by Quarter.
Page 3: Products & Waste
Cards for Units Ordered, Units Wasted, Waste Rate, Avg Unit Price ($14.32) and Freshness Score. Visuals include Total Order Quantity and Waste Rate % by Product Category, the Product Category Scorecard and Total Waste Quantity by Region across Mountain, Northeast, Southwest, West Coast, Southeast and Midwest.
Page 4: Farms & Partners
Cards for Procurement Cost ($309.2K), Gross Profit, Gross Margin, Logistics / Order ($121.97) and Carbon Saved. Visuals include Total Revenue and Gross Margin % by Farm Supplier and the Supply Chain Partner Scorecard with orders, order value, margin, logistics cost, on-time delivery and star rating per partner.
Page 5: Delivery & Service
Cards for Avg Delivery Days, Delay Rate, Return Rate, Cancellation Rate and Customer Rating. Visuals include Total Orders and On Time Delivery % by Delivery Zone, Total Orders by Fulfillment Status and the Sales Channel Service Scorecard for Farmers Market, Restaurant Supply, Grocery Partner, Online Store, Subscription Box and Corporate Pantry.
📊 Farm Supply Chains Dashboard in Power BI vs. Tableau / Qlik vs. Paid Supply Chain Software
| Feature | This Power BI template | Tableau / Qlik build | Zoho Inventory / NetSuite ERP |
|---|---|---|---|
| Cost | ✅ $17.99 one-time | Per-user subscription licences | Recurring subscription, often per user |
| Platform | Power BI Desktop (free, Windows) | Tableau Desktop or Qlik Sense | Vendor web app |
| Setup time | ✅ Open the .pbix, sample data already loaded | Design every page from scratch | Implementation and data migration project |
| Ready-made farm supply pages | ✅ 5 pages, 25 KPI cards, 15 visuals | Blank canvas | Generic inventory reports |
| Customizable fields and visuals | ✅ Every visual and measure editable | ✅ Yes | Limited to vendor options |
| Real-time team collaboration | Needs Power BI Service licences to share | Needs server or cloud licences | ✅ Built in |
| Mobile access | Power BI mobile app after publishing | Mobile apps with licences | ✅ Built in |
| Share with link | Through the Power BI Service | Through Tableau Cloud or Qlik Cloud | ✅ Yes |
| Orders, stock and traceability records | No – reporting only, refresh from Data.xlsx or your own source | Depends on your connectors | ✅ Transactions and stock records |
For growers and distributors that want order, waste and delivery analysis without an ERP subscription, this Power BI template sits in the sweet spot.
👥 Who This Template Is For – and Who It’s Not For
✅ This template is built for:
- Operations and finance leads at farm cooperatives, food hubs and farm-to-business distributors
- Teams comparing supply chain partners, farm suppliers and sales channels side by side
- Power BI analysts who want a finished order-level model to adapt
- Consultants presenting farm supply performance to owners and buyers
❌ This template is NOT for:
- Teams that need an ERP, order-entry or inventory system – this is a reporting file and does not record transactions or stock
- Anyone needing lot traceability, food-safety (FSMA or HACCP) records or certification evidence – the data has no such fields
- Operators who want live order feeds without setting up a data connection
- Mac-only users with no Windows machine for Power BI Desktop
⚙️ How to Use the Farm Supply Chain Report
- Install Power BI Desktop, free from Microsoft.
- Unzip the download and open the .pbix – the sample data is already loaded.
- Replace the rows in Data.xlsx with your own orders, keeping the 24 column headers.
- In Power Query, point the source at your file path, then click Refresh.
- Use the menu and slicers to filter by date, region, category and partner.
- Right-click a partner or category and use drillthrough to open the Details page.
💼 Real-World Use Cases
Elena runs operations for a regional food hub. She opens Delivery & Service, sees Suburban deliveries at 54.9% on time against 72.7% for Urban Core, and takes the zone chart to her weekly routing meeting.
Marcus manages supplier relations for a farm-to-restaurant distributor. He filters Farms & Partners by Product Category and compares gross margin by farm supplier before renewing next season’s purchase terms.
Aisha is a freelance Power BI consultant. She loads a cooperative’s order export into Data.xlsx, refreshes, adjusts the colours and hands over a five-page waste and delivery report instead of building a model from zero.
❓ Frequently Asked Questions
What does the Farm Supply Chains Dashboard in Power BI track?
It tracks 25 KPI cards across five pages, including Total Revenue, Gross Margin %, Supply Cost, Waste Rate, Freshness Score, Procurement Cost, Carbon Saved, On-Time Delivery and Delay Rate, with 15 visuals broken down by month, quarter, partner, farm supplier, category, region, channel and delivery zone.
Do I need a paid Power BI licence?
No licence is needed to open and edit the file. Power BI Desktop is free from Microsoft and runs on Windows. Sharing the report through the Power BI Service or the mobile app needs whatever Power BI licences Microsoft requires for your organisation.
How long does setup take?
The report opens with sample data straight away. To use your own numbers, paste your orders into Data.xlsx under the same 24 headers, update the file path in Power Query and click Refresh. Most of the time goes into tidying your own export.
Is this a traceability or food-safety system?
No. This template analyses order, cost, waste and delivery figures. It does not track lots, record FSMA or HACCP checks, manage certifications or replace an ERP. Keep those records in the systems built for them and use this report for performance analysis.
Is there an Excel edition?
An Excel workbook edition of the same farm supply topic is in preparation. This listing is the Power BI Desktop .pbix report, with Power BI’s own slicers, drillthrough page and tooltip pages.
How does it compare to paid supply chain software?
Platforms such as Zoho Inventory or NetSuite record transactions and bundle hosting for a recurring fee. This template is a one-time purchase that gives you the finished Power BI model and pages; you supply the data and, if you want to share online, the Power BI licences.
Is the sample data real?
No. The 500 orders, the partner and farm names and every figure are fictional demo data, and the Carbon Saved column is a sample value with no defined unit. Replace them with your own records before using the report for decisions.
👤 About the Author
Built by PK – Microsoft Certified Professional with 15+ years of Excel, Google Sheets and Power BI experience and founder of NextGenTemplates. Tutorials are on YouTube at @PKAnExcelExpert, @NextGenTemplates and @NeoTechNavigators. Every template is hand-built and tested before release.
🔗 Explore Related Templates
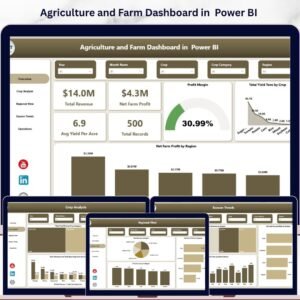
🚜 Agriculture and Farm Dashboard in Power BI – farm-level production and cost reporting.
🍽️ Farm-to-Table Startups Dashboard in Power BI – a neighbouring report for direct farm-to-consumer businesses.
❄️ Cold Chain Logistics Dashboard in Power BI – temperature-sensitive shipping and logistics analysis.
🛒 Grocery Delivery Services Dashboard in Power BI – order and delivery reporting for grocery delivery.
🌱 Organic Seeds Providers Dashboard in Power BI – sales and supplier analysis for seed businesses.
👉 Browse every Power BI dashboard template in the catalogue.
📖 Click here to read the Detailed Blog Post
🎥 Visit our YouTube channel for step-by-step video tutorials
👉 YouTube.com/@NextGenTemplates
📅 Last updated: September 2026




























Reviews
There are no reviews yet.