Election Commissions Dashboard in Power BI organizes voter registration, turnout, polling operations, budgets, complaints, and result-status records across five connected reporting pages. It is designed as a demonstration and internal analytics template for teams that already maintain authorized election-administration data.
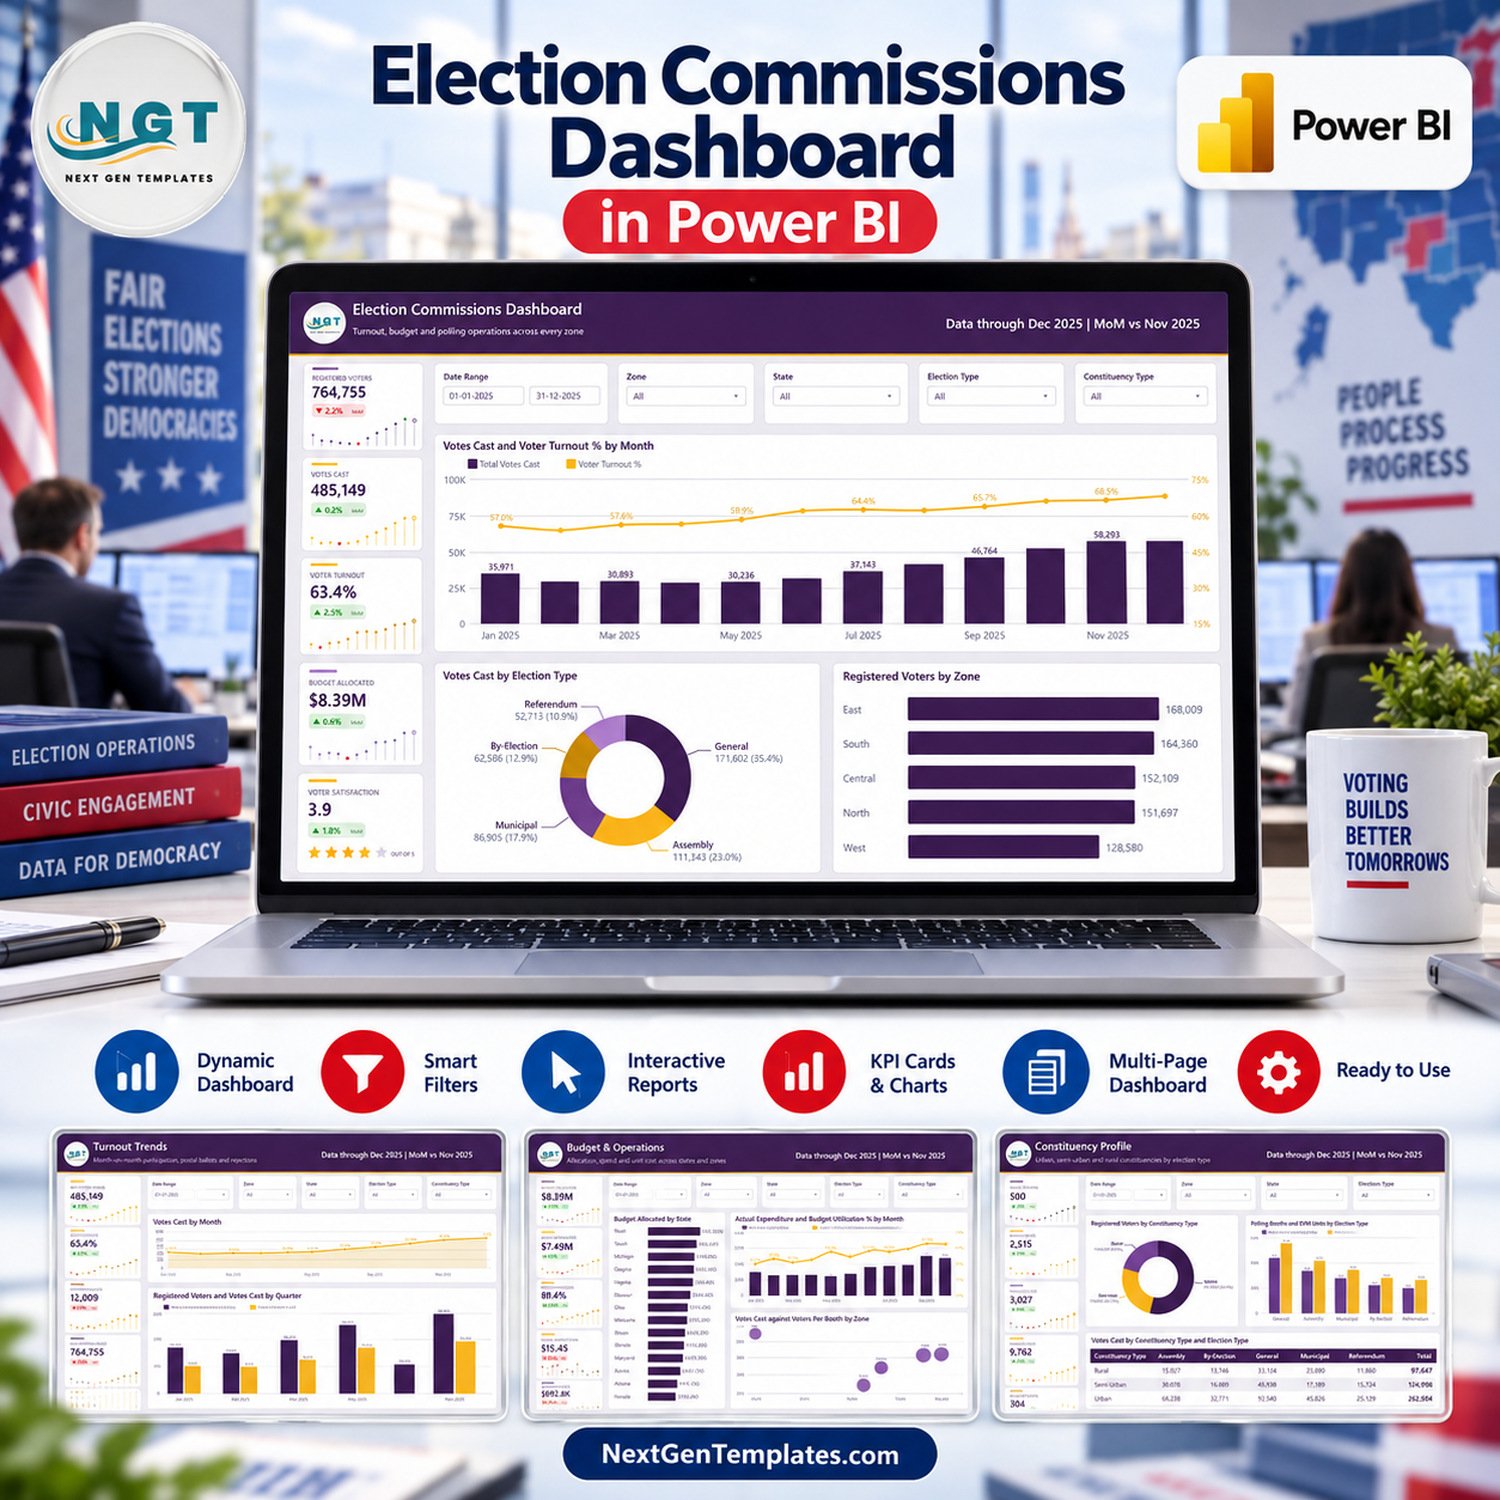
The package includes an editable PBIX file, Data.xlsx with 500 fictional sample records, and a Power BI user manual. Replace the examples with validated data and reconcile every result before use. This dashboard does not register voters, count or certify votes, operate polling equipment, declare results, detect fraud, manage complaints, audit elections, predict outcomes, or provide legal compliance.
Election Commissions Dashboard in Power BI: five pages
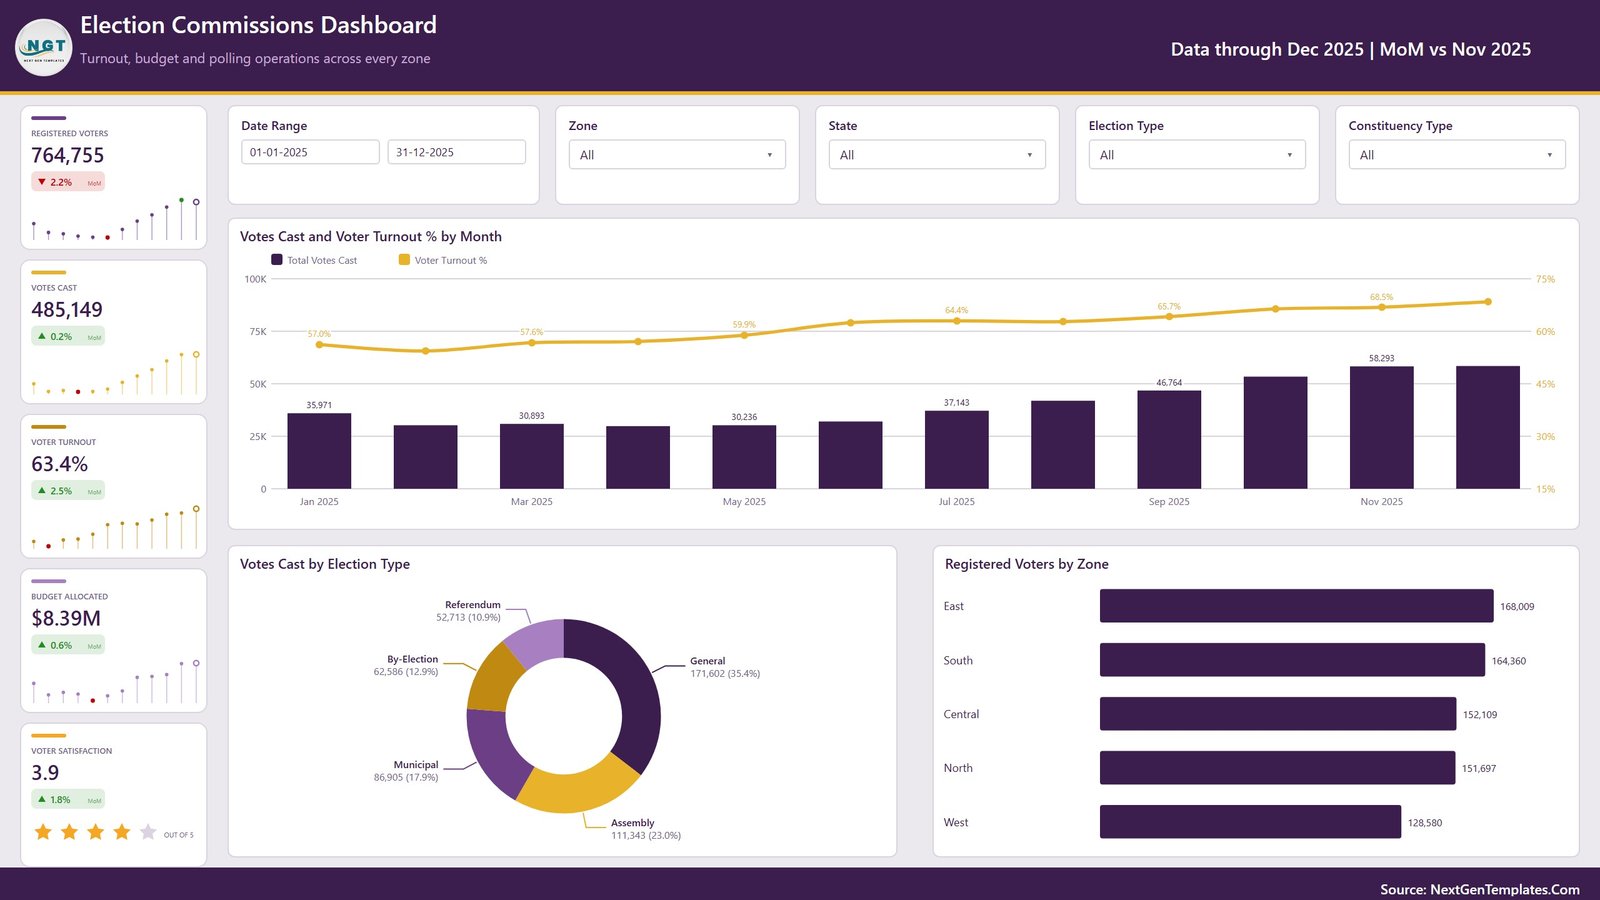
- Overview: registered voters, votes cast, turnout, budget, satisfaction, monthly participation, election-type mix, and registered voters by zone.
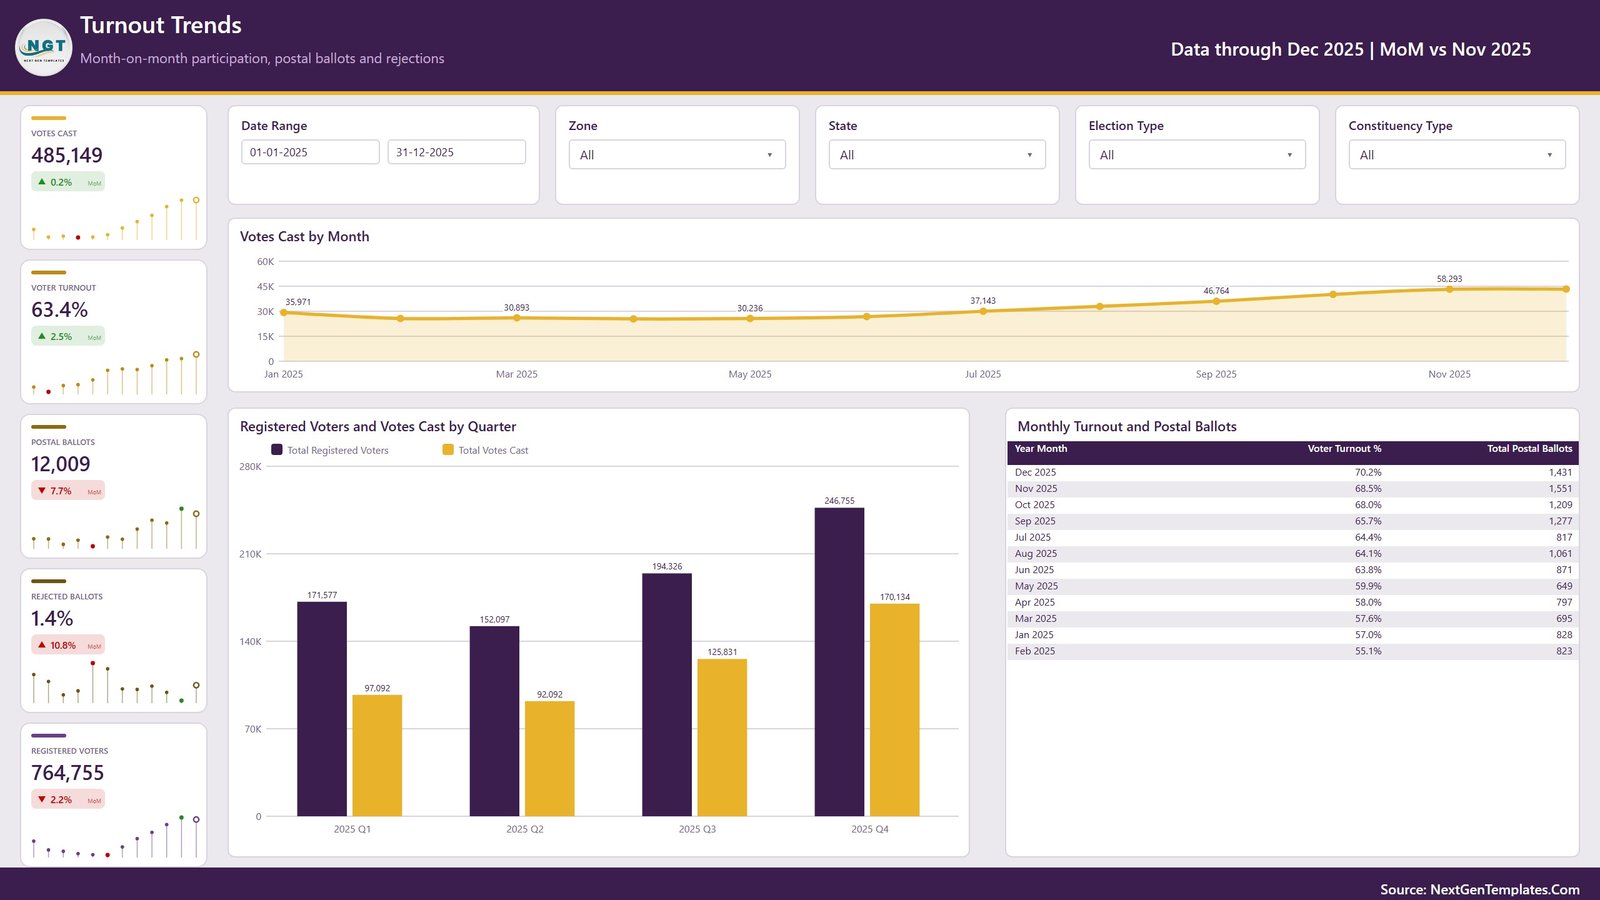
- Turnout Trends: monthly votes, quarterly registration and votes, postal ballots, rejected-ballot rate, and a monthly table.
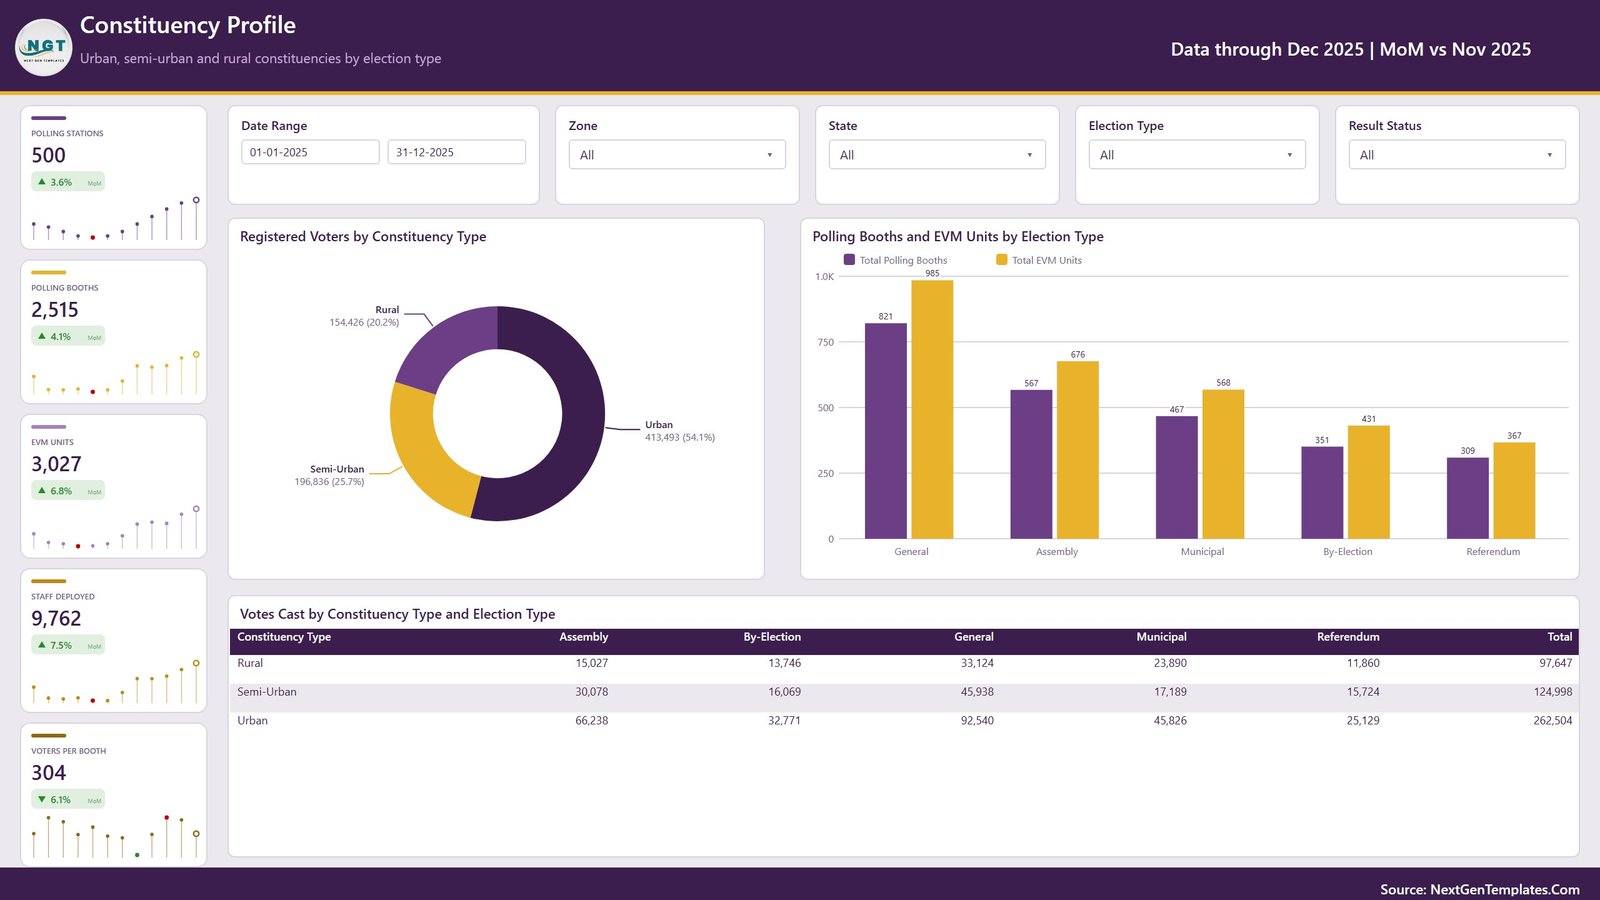
- Constituency Profile: registered voters by urban, semi-urban, and rural category; polling booths and EVM units; votes by constituency and election type.
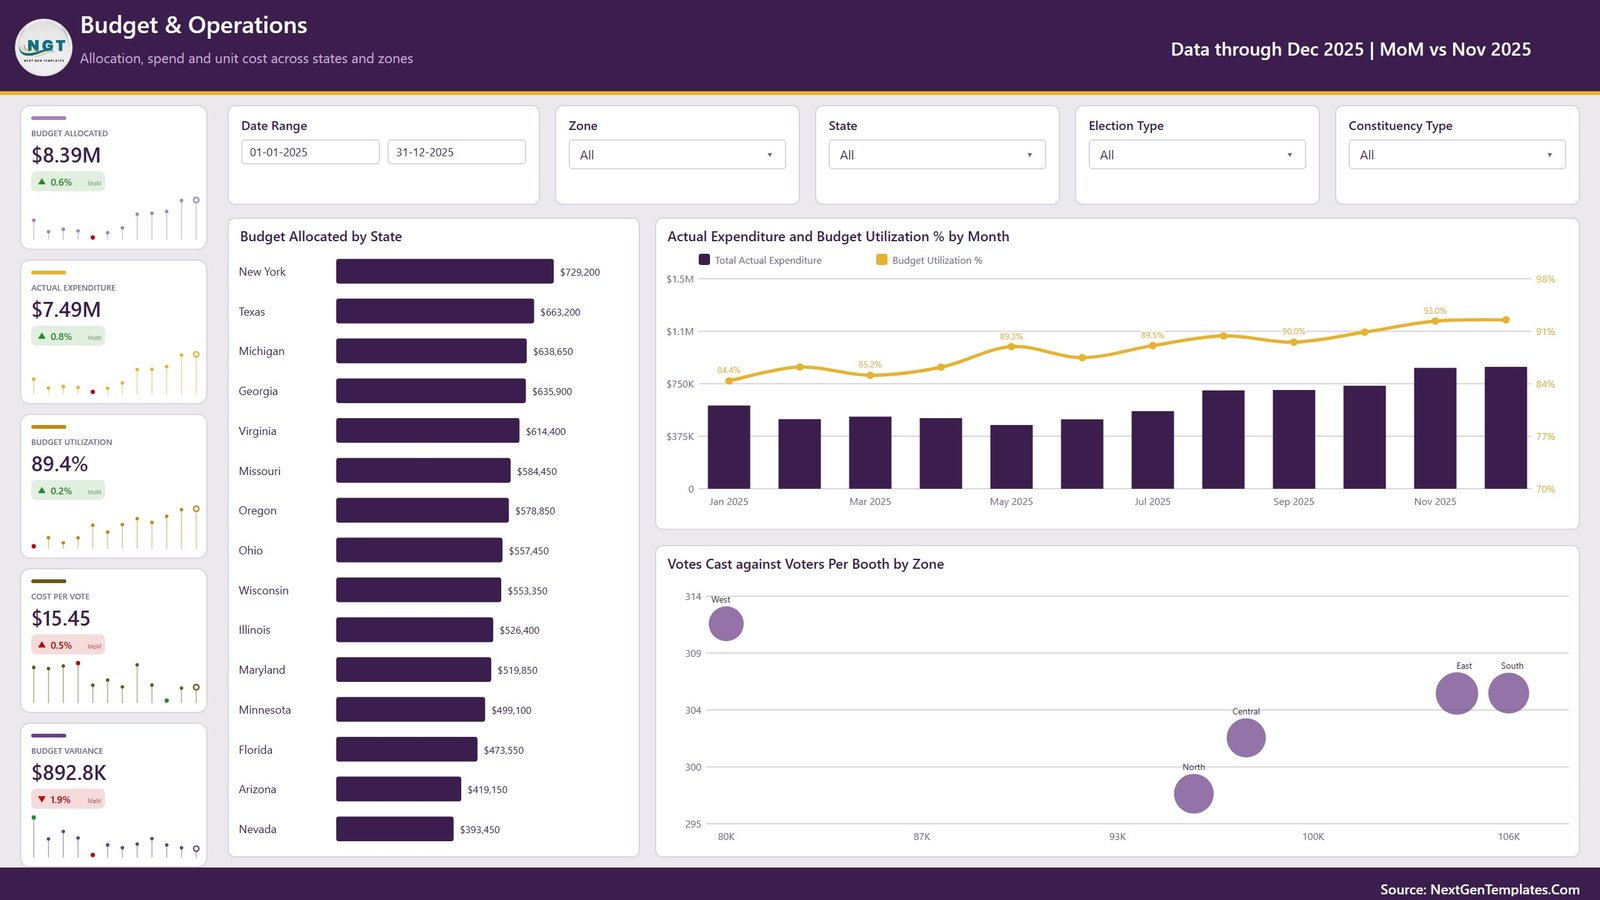
- Budget & Operations: allocation by state, expenditure, utilization, variance, cost per vote, and votes per booth.
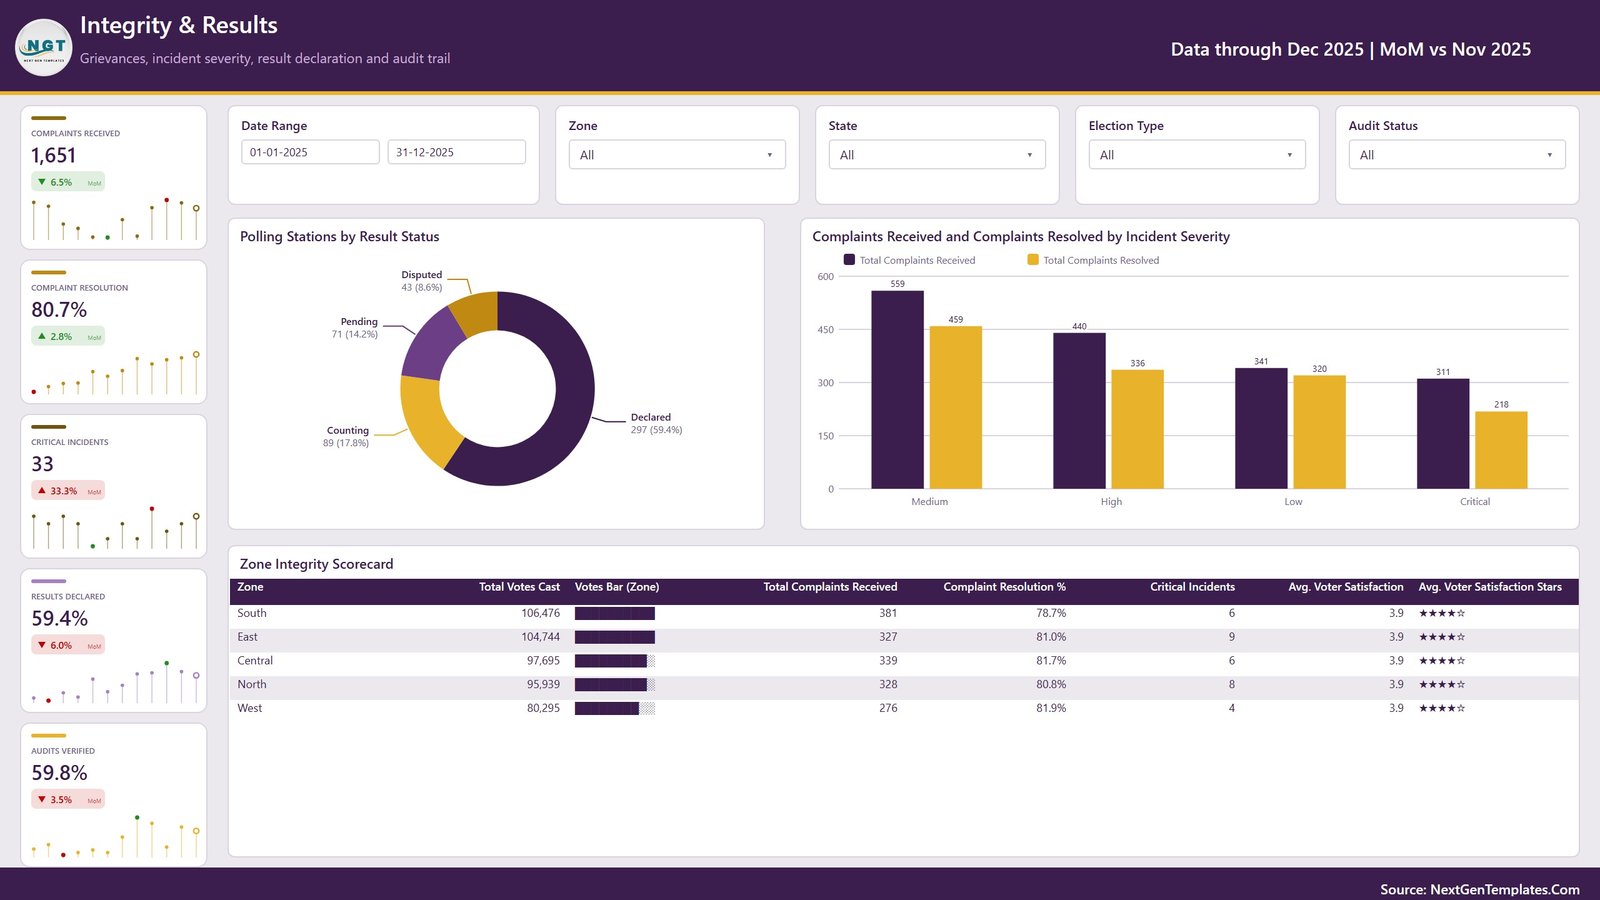
- Integrity & Results: entered complaints, resolution, critical incidents, result status, audit status, and zone scorecard.
Interactive filters
Date Range, Zone, State, Election Type, Constituency Type, Result Status, and Audit Status filters appear where relevant. They help reviewers narrow the prepared visuals, but do not validate the underlying classifications or determine an official electoral outcome.
Editable sample data
The fictional source table demonstrates fields for dates, zones, states, election and constituency types, voters, votes, polling resources, budgets, expenditures, postal and rejected ballots, complaints, incidents, satisfaction, result status, and audit status. Treat all sample names and figures as illustrative only.
Recommended workflow
- Keep a clean backup.
- Review definitions and map authorized source fields.
- Standardize geography, election type, status, currency, and units.
- Replace sample records without changing the prepared structure.
- Refresh the report and reconcile totals.
- Document filters, exclusions, revisions, and reporting dates.
Election data can be sensitive and politically consequential. Apply access controls, data-protection rules, retention requirements, official review, and publication procedures appropriate to the responsible jurisdiction. A visualization cannot substitute for certified source systems, chain-of-custody controls, statutory processes, or independent oversight.
Quality checks before a review
Confirm that the reporting period is complete, geographic names are consistent, and each percentage uses the intended denominator. Check for duplicate polling-station records, missing status values, impossible negative amounts, and inconsistent currency units. Compare headline cards with the authorized system of record and retain a dated reconciliation note.
When results change after a refresh, determine whether the movement reflects genuine activity, a late submission, a category correction, or a revised definition. Keep preliminary analysis clearly separated from certified public information. Restrict exports to the intended audience and remove fields that are not required for the review.
Use the dashboard as an analytical layer
The prepared pages can make discussion more efficient by placing participation, capacity, expenditure, and issue-resolution indicators side by side. They cannot decide what should be investigated or published. Those decisions remain with authorized officials following the applicable legal and procedural framework.
Maintain a clear data dictionary for every field and percentage. Review access logs, refresh dates, source ownership, and approval status before distributing any report or screenshot beyond the authorized team.
Archive the approved reporting basis with each final review package.
Related reporting templates
Explore the Election Commissions KPI Dashboard in Power BI, Government Budget Dashboard in Power BI, and the Power BI template collection. For election-administration standards and resources, consult the competent election authority for the relevant jurisdiction and the International IDEA knowledge resources.
What you receive
- Editable Power BI PBIX report
- Five report pages
- Data.xlsx with 500 fictional records
- Power BI user manual
- Instant ZIP download
Build a controlled reporting workflow. Use the template with validated, authorized data and appropriate expert review.