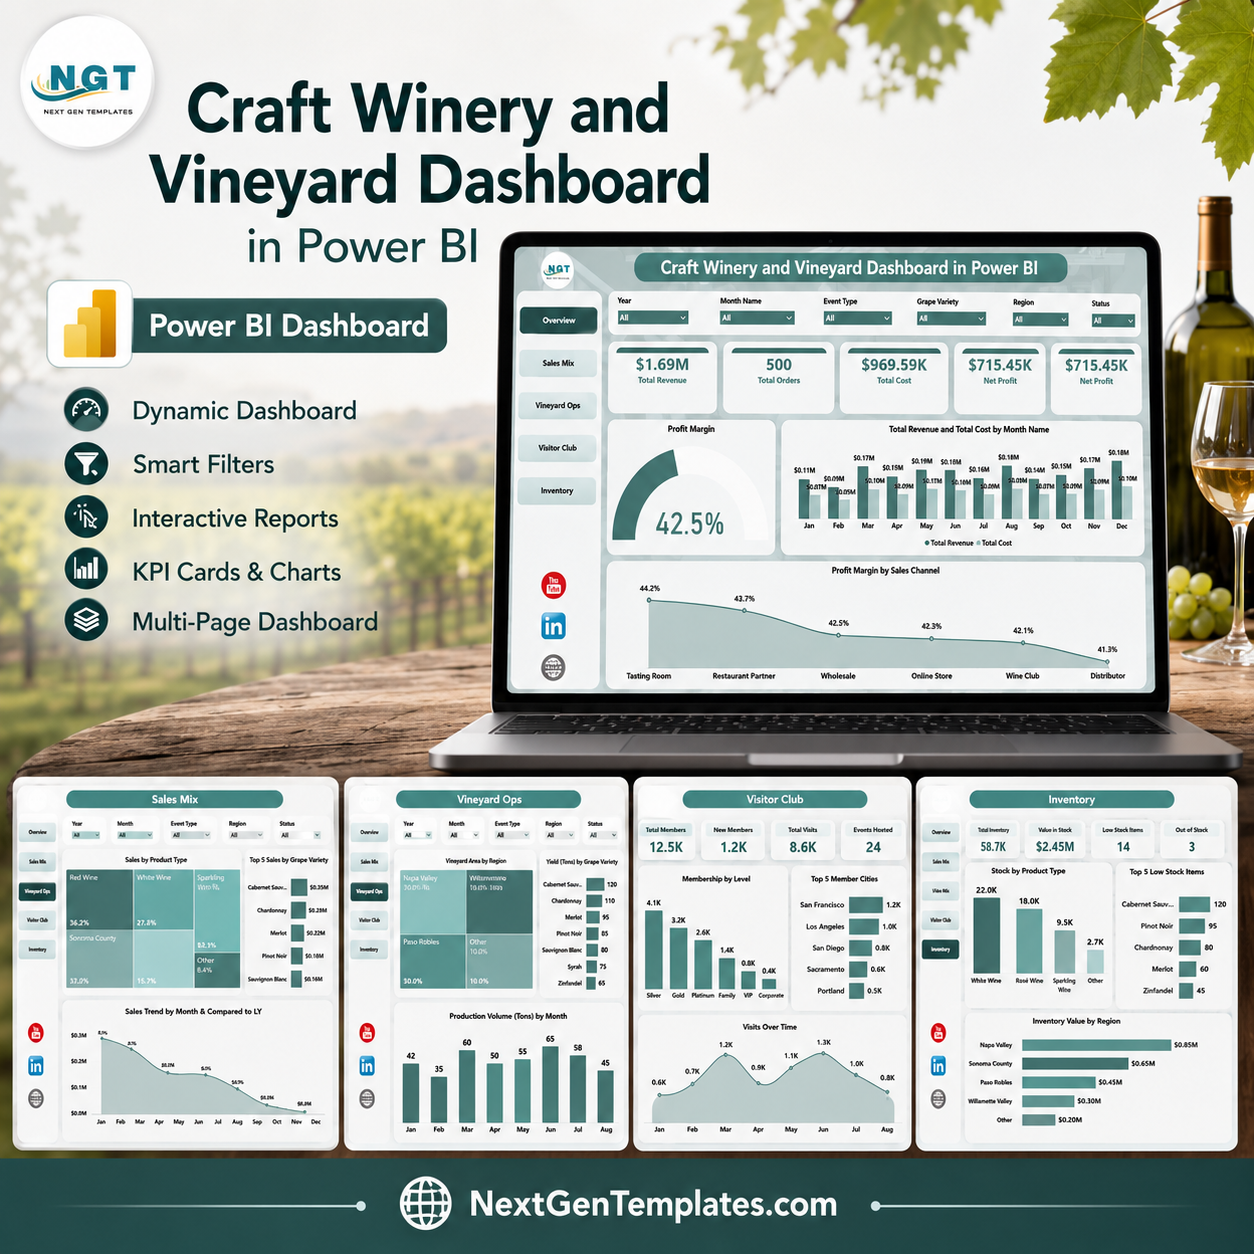
Last updated: July 2026. WineBusiness Analytics counted more than 11,000 wineries in the United States at the start of 2026, and winery teams are under more pressure to understand revenue, cost, profit, production, visitor club growth, and inventory without waiting for manual reports. The Craft Winery and Vineyard Dashboard in Power BI gives craft winery owners, vineyard managers, tasting room teams, and consultants a ready-to-use PBIX dashboard for turning structured winery data into interactive reporting. It includes 5 report pages, 4 high-level KPI cards, multiple slicers, and focused charts for sales mix, vineyard operations, visitor club activity, and inventory. Trusted by teams using NextGenTemplates across business reporting workflows, this product is an instant download, one-time payment, no subscription, and fully editable in Power BI Desktop.
Key Features of Craft Winery and Vineyard Dashboard in Power BI
- 5 Power BI report pages for Overview Page, Sales Mix, Vineyard Ops, Visitor Club, and Inventory.
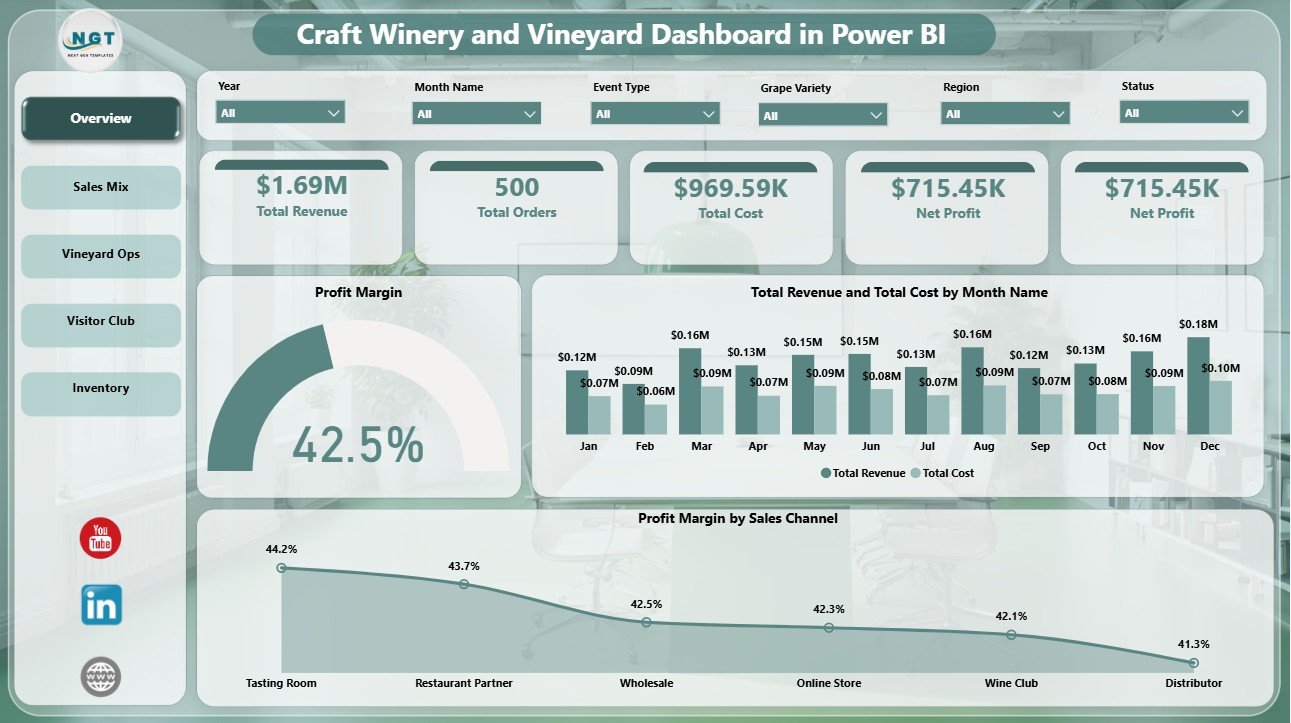
- 4 executive KPI cards covering Total Revenue, Total Orders, Total Cost, and Net Profit.
- Profit margin analysis by overall performance, sales channel, and region.
- Sales and cost comparison by Month Name and Quarter.
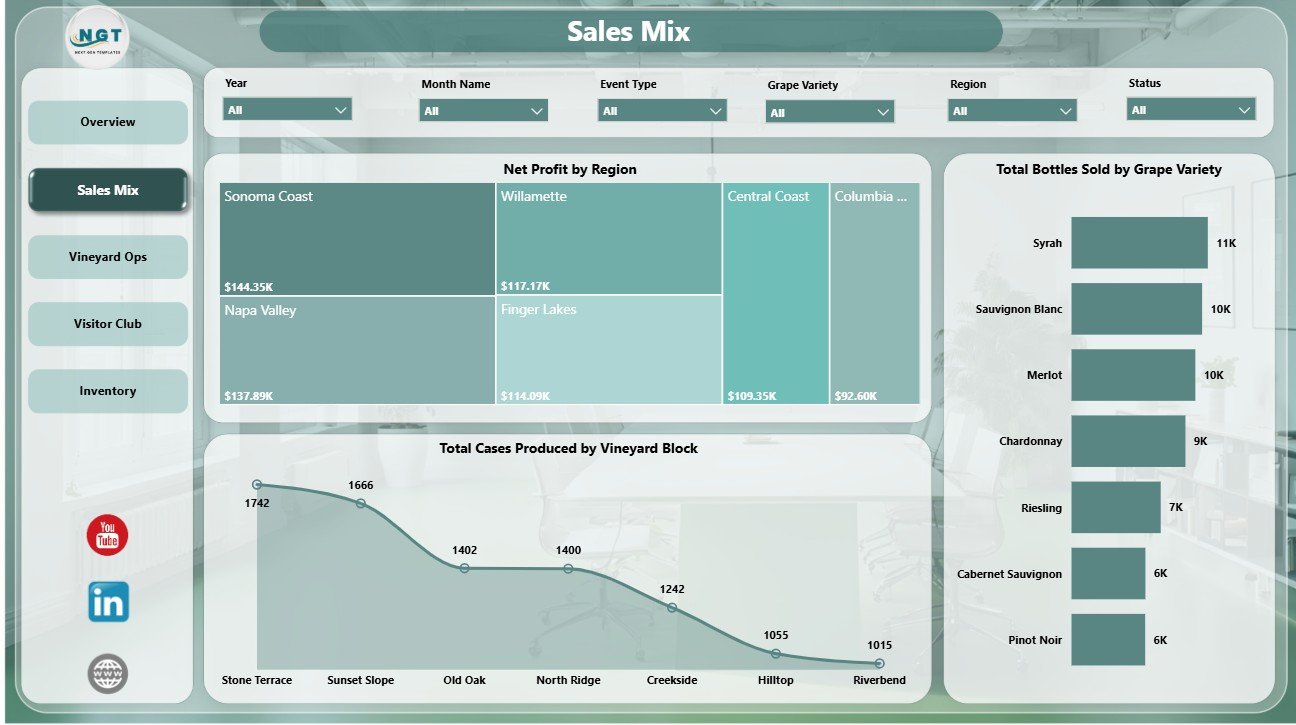
- Sales mix insights by region, grape variety, and vineyard block production.
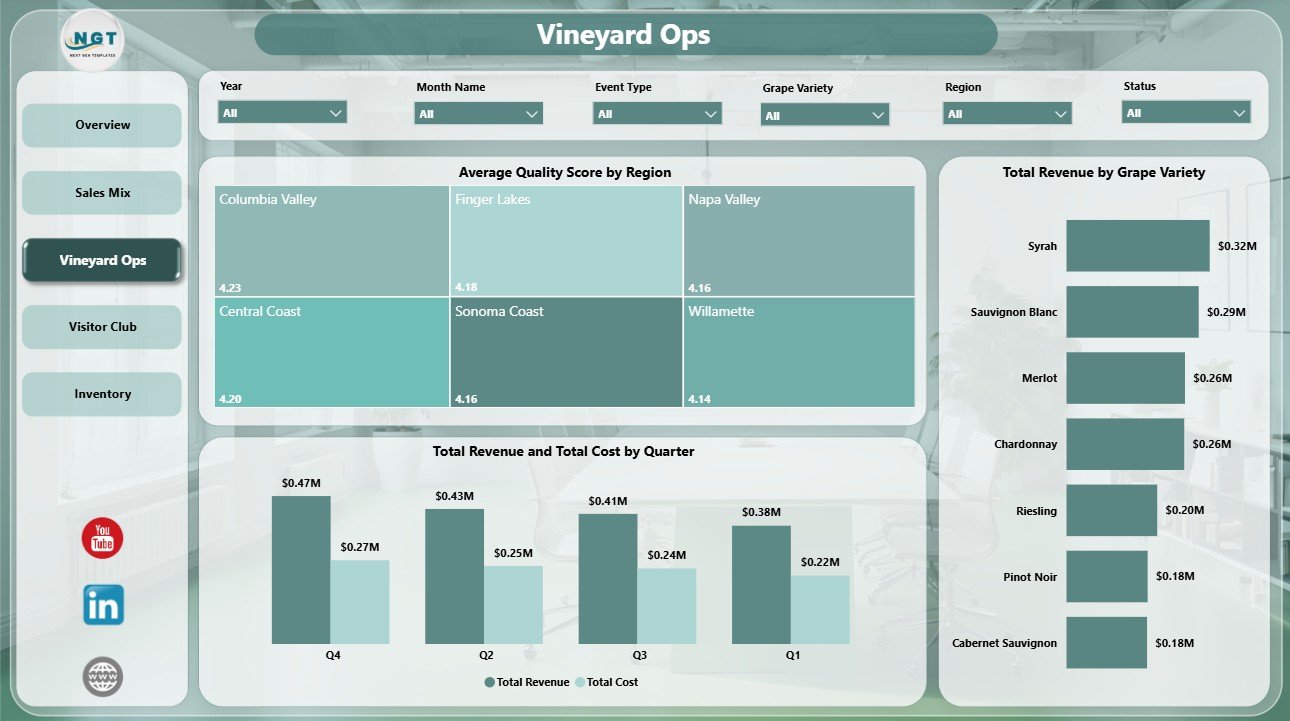
- Vineyard operations view for quality score, grape variety revenue, and quarterly revenue versus cost.
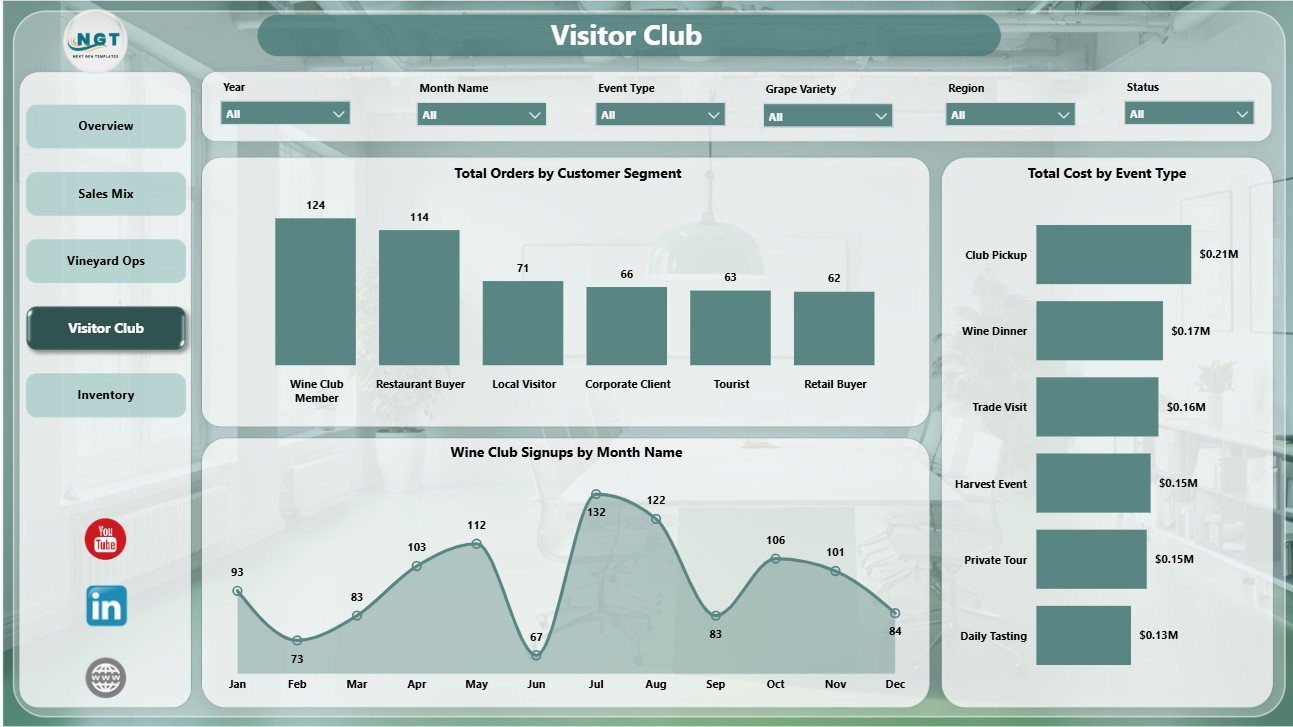
- Visitor club tracking for customer segments, wine club signups, and event cost.
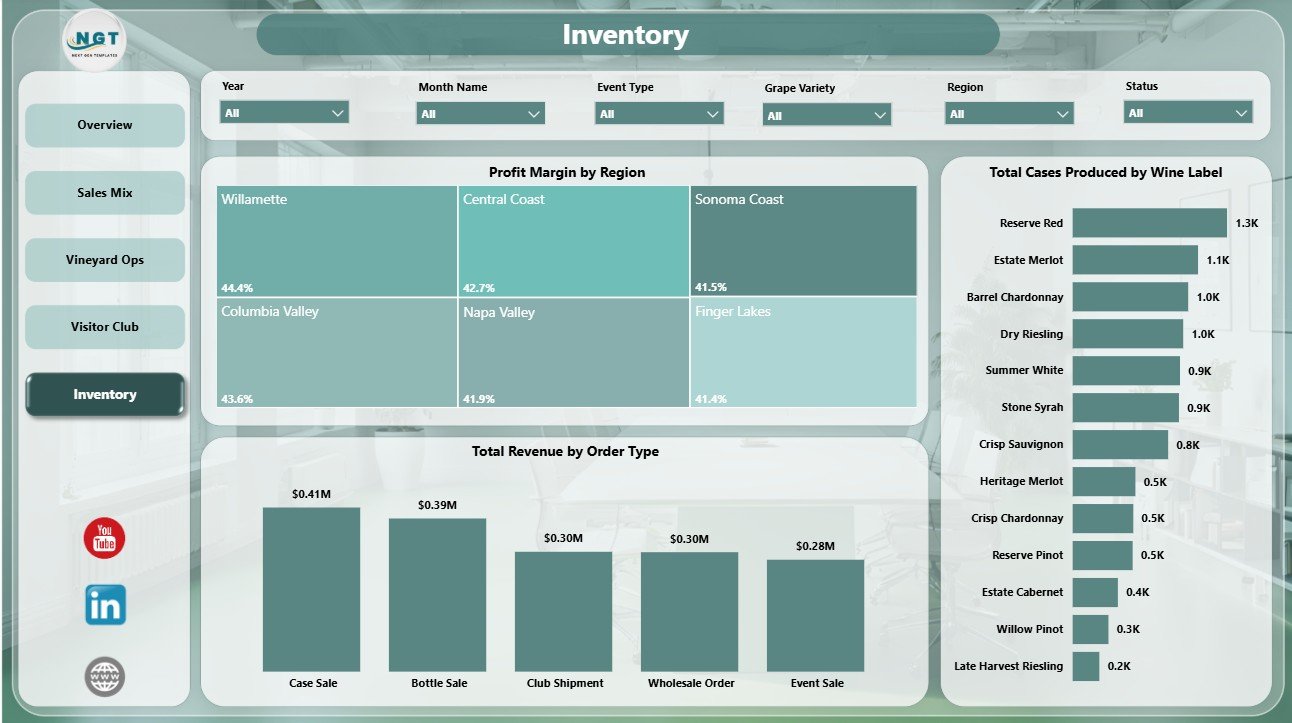
- Inventory reporting by wine label, order type, and regional margin.
- Editable PBIX file that can be customized in Power BI Desktop.
What’s Inside the Craft Winery and Vineyard Dashboard in Power BI
The Overview Page shows the headline financial cards: Total Revenue, Total Orders, Total Cost, and Net Profit. It also includes Profit Margin by Overall Performance, Total Revenue and Total Cost by Month Name, and Profit Margin by Sales Channel. This page is designed for owner reviews and quick financial checks.
Craft Winery and Vineyard Dashboard in Power BI
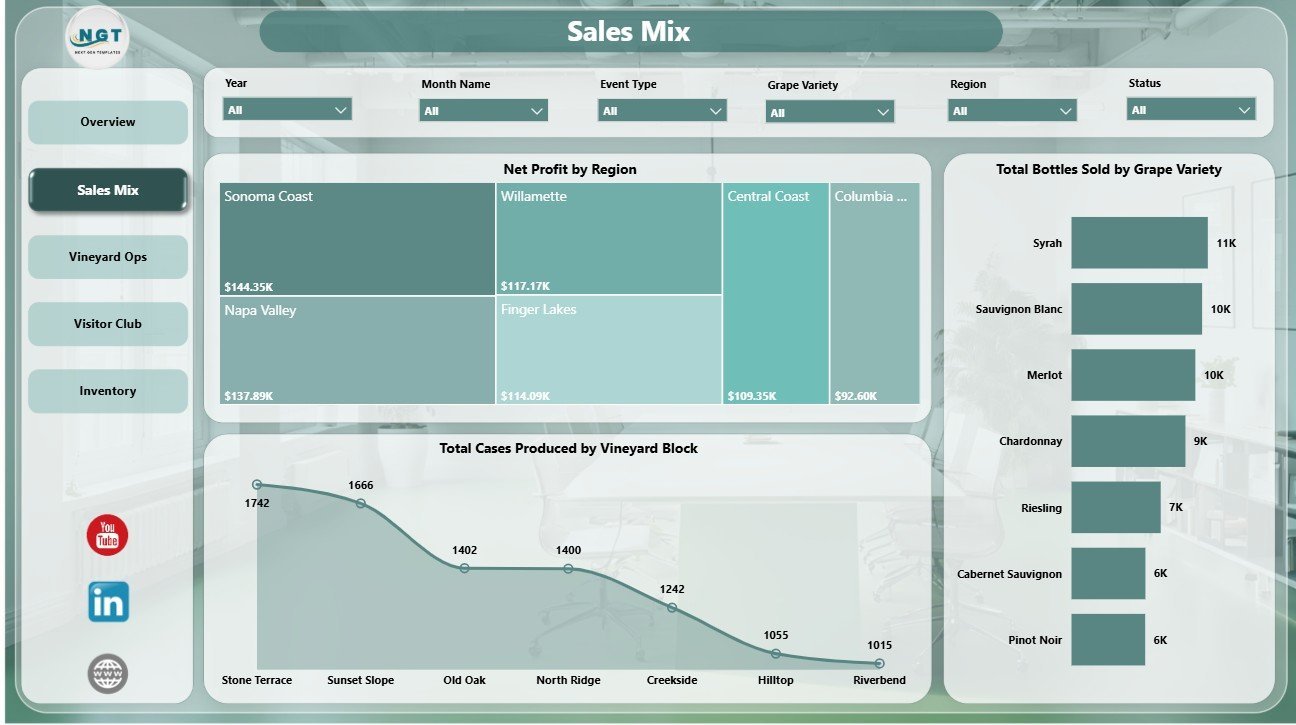
The Sales Mix page includes Net Profit by Region, Total Bottles Sold by Grape Variety, and Total Cases Produced by Vineyard Block. These visuals help compare which regions, grape varieties, and vineyard blocks are contributing to sales and production performance.
Sales Mix
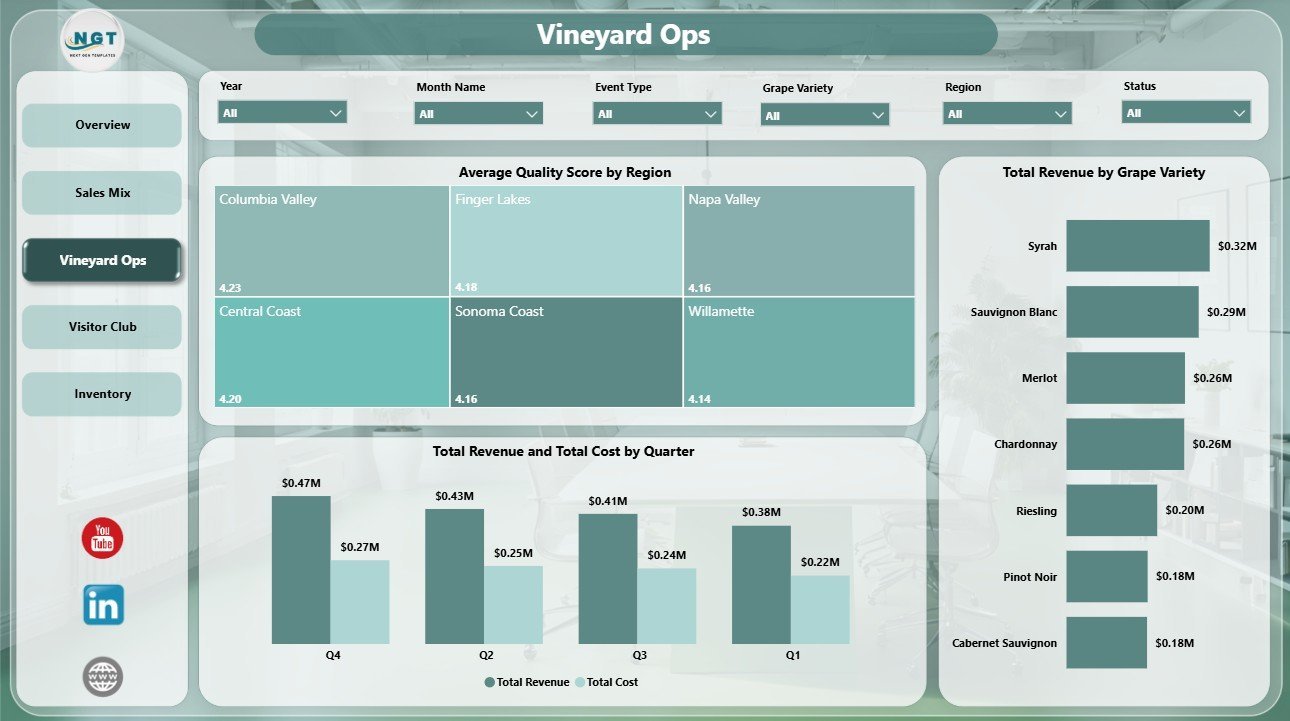
The Vineyard Ops page includes Average Quality Score by Region, Total Revenue by Grape Variety, and Total Revenue and Total Cost by Quarter. It connects quality, grape variety revenue, and quarterly financial movement in one operational view.
Vineyard Ops
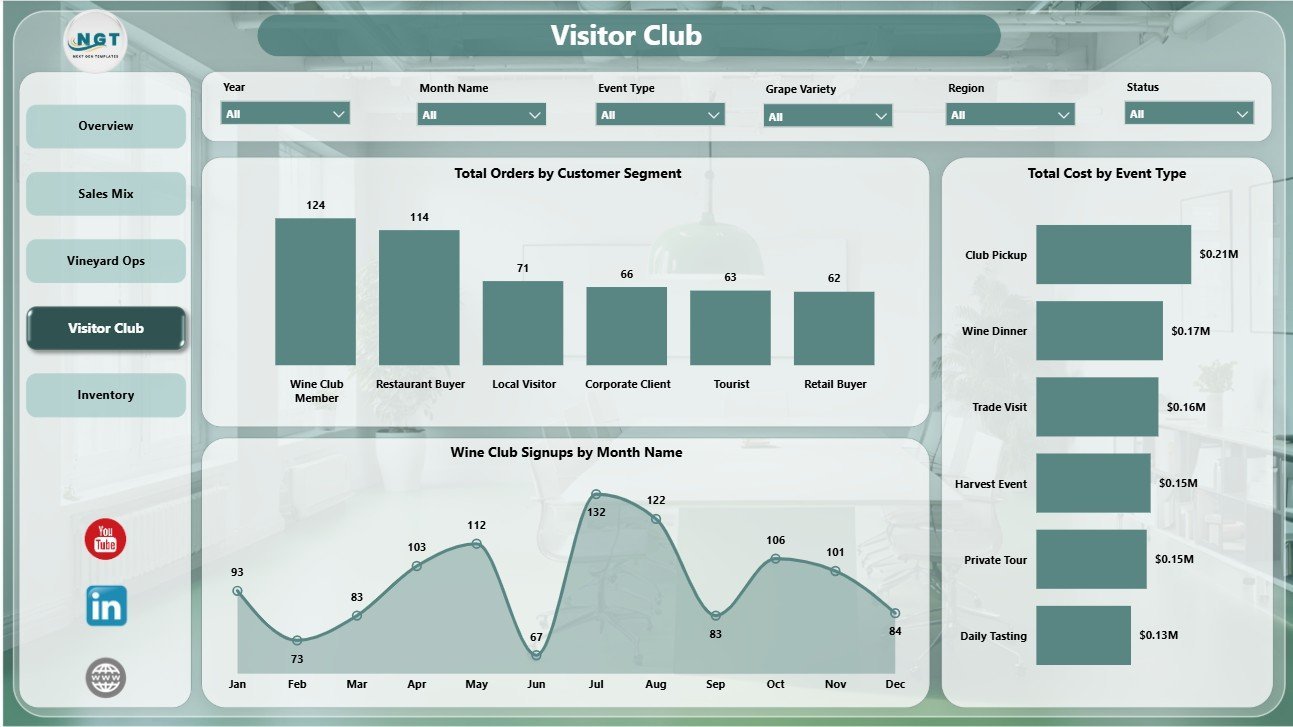
The Visitor Club page includes Total Orders by Customer Segment, Wine Club Signups by Month Name, and Total Cost by Event Type. It helps tasting room and marketing teams connect customer activity, event investment, and membership growth.
Visitor Club
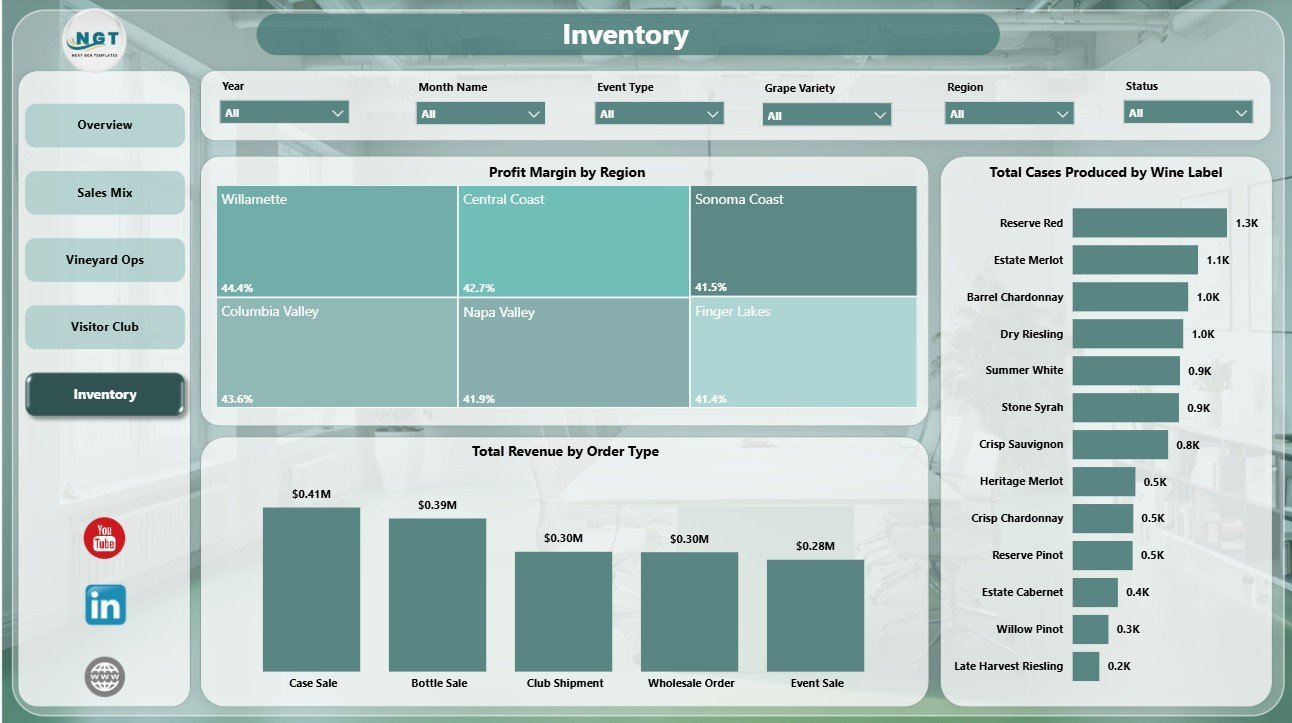
The Inventory page includes Profit Margin by Region, Total Cases Produced by Wine Label, and Total Revenue by Order Type. It helps teams review regional margin, label-level production, and order-type revenue before inventory or fulfillment decisions.
Inventory
Craft Winery and Vineyard Dashboard in Power BI vs. Tableau vs. Paid CRM/SaaS – Where This Fits
| Feature | This Power BI Dashboard | Tableau or Qlik Alternative | Paid Winery SaaS |
|---|---|---|---|
| Cost | $17.99 one-time | License plus build time | Monthly or annual subscription |
| Platform | Power BI Desktop and optional Power BI Service | BI desktop or cloud platform | Vendor cloud platform |
| Setup time | Open PBIX, replace data, refresh | Build model and visuals | Onboarding and integration setup |
| Customizable fields | Edit visuals, measures, pages, and source connections | Editable with BI skills | Often limited by plan |
| Year-1 cost at 5 users | Template cost plus Microsoft licensing choice | License cost plus analyst time | Often hundreds or thousands per year |
Who This Template Is For – and Who It’s Not For
This template is for craft winery owners, vineyard managers, winemakers, tasting room managers, wine club coordinators, inventory planners, finance analysts, and consultants who already maintain structured winery data and want a faster reporting layer in Power BI.
It is not intended to replace a POS system, wine club billing platform, vineyard sensor system, compliance platform, barcode inventory solution, or full winery ERP. Use it when your goal is management reporting and decision support, especially if your data can be exported into a clean structure for Power BI.
How to Use the Craft Winery and Vineyard Dashboard in Power BI
- Download and unzip the product file.
- Open the PBIX file in Power BI Desktop.
- Replace or connect the sample source with your winery and vineyard data.
- Refresh the report.
- Use slicers to filter the Overview, Sales Mix, Vineyard Ops, Visitor Club, and Inventory pages.
- Customize visuals, pages, measures, or fields if needed.
Real-World Use Cases
Maria, tasting room manager: Maria reviews Total Orders by Customer Segment and Wine Club Signups by Month Name before adjusting event calendars, staff scheduling, and membership promotions.
James, vineyard operations lead: James compares Total Cases Produced by Vineyard Block with Average Quality Score by Region before planning harvest discussions and field-level follow-up.
Anika, winery consultant: Anika connects each client export to the Power BI report, refreshes the model, and uses Sales Mix and Inventory pages to explain which grape varieties, regions, and order types need attention.
Frequently Asked Questions
What does this Power BI dashboard track?
It tracks Total Revenue, Total Orders, Total Cost, Net Profit, Profit Margin, revenue versus cost, grape variety sales, vineyard block production, customer segment orders, wine club signups, event cost, wine label production, and order type revenue.
How many pages are included?
The report includes 5 pages: Overview Page, Sales Mix, Vineyard Ops, Visitor Club, and Inventory.
Do I need Power BI Desktop?
Yes. Power BI Desktop is required to open and edit the PBIX file. Power BI Service is optional for sharing and scheduled refresh.
Can I use my own winery data?
Yes. Replace or connect the sample source with structured winery records, then refresh the report.
Can I customize the dashboard?
Yes. You can edit pages, visuals, colors, slicers, fields, measures, and source connections in Power BI Desktop.
Does this replace winery management software?
No. It is a reporting dashboard template, not a POS, wine club billing, compliance, lot tracking, or inventory scanning system.
About the Author
Built by PK – Microsoft Certified Professional with 15+ years of Excel, Google Sheets, and Power BI experience. Founder of NextGenTemplates, reaching 300K+ subscribers across YouTube channels. Every template is hand-built and tested before release.
Explore Related Templates
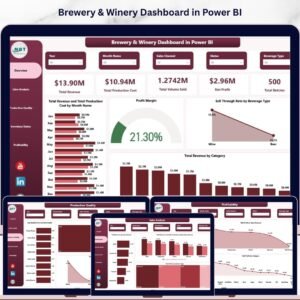
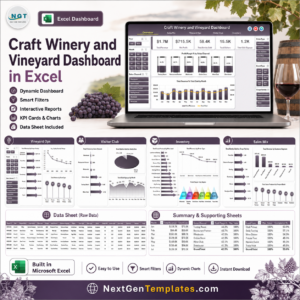
Explore more templates in the Power BI category and the Power BI Dashboard category. Related templates include Craft Winery and Vineyard Dashboard in Excel, Brewery & Winery Dashboard in Power BI, and Winemaking KPI Dashboard in Power BI.
Download the Craft Winery and Vineyard Dashboard in Power BI today and start reviewing winery sales, vineyard operations, visitor club activity, and inventory performance in one editable PBIX file.
Last updated: July 30, 2026