

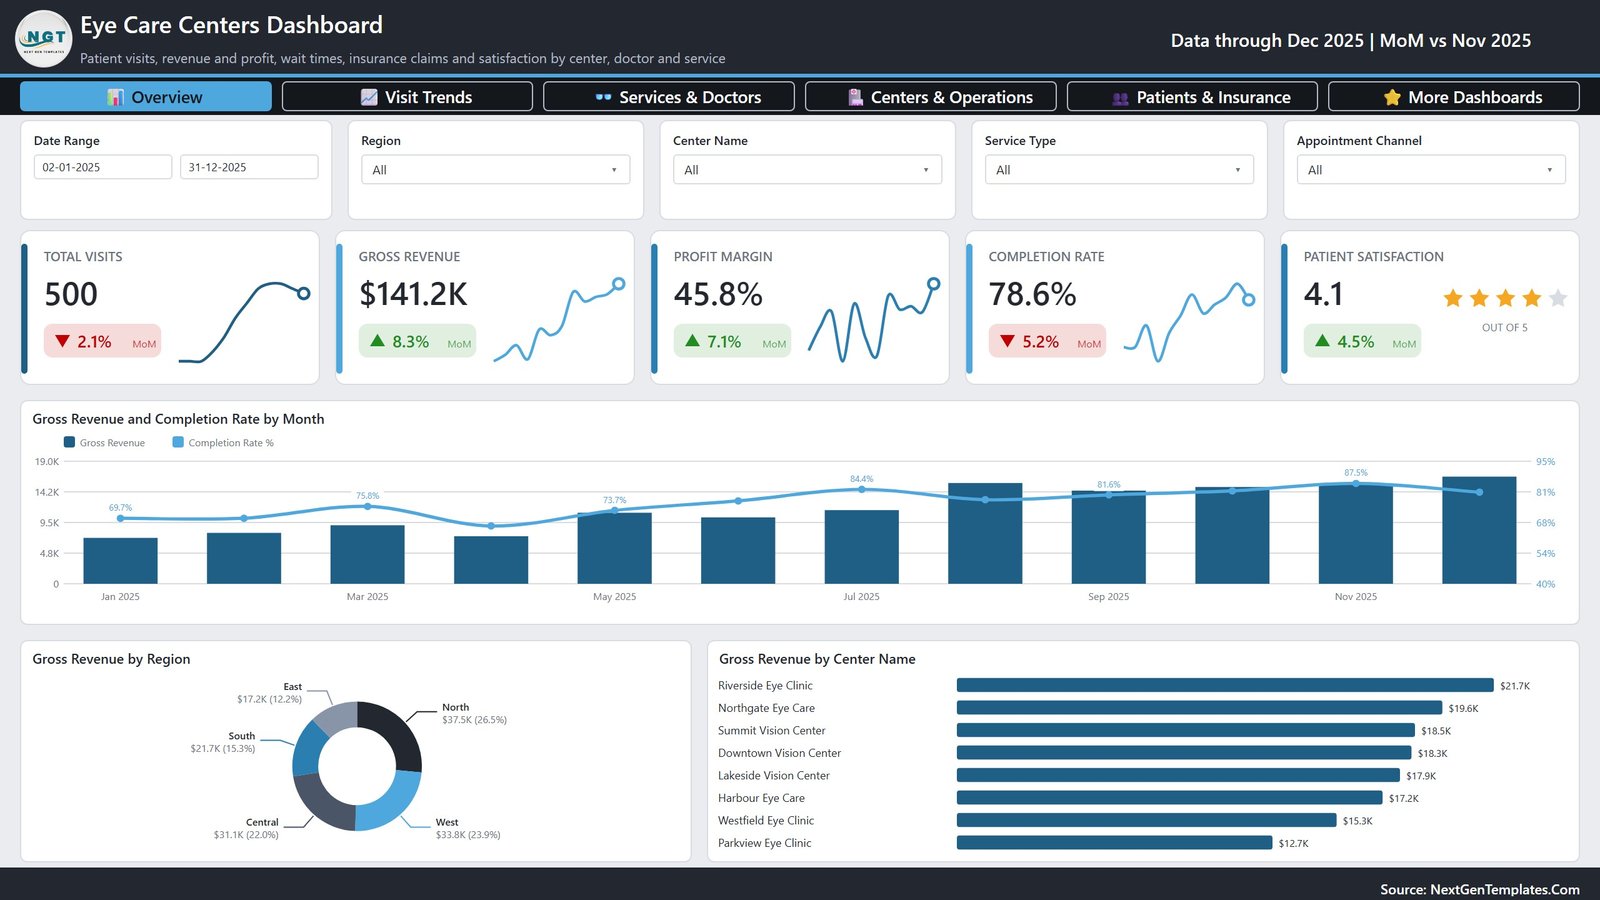
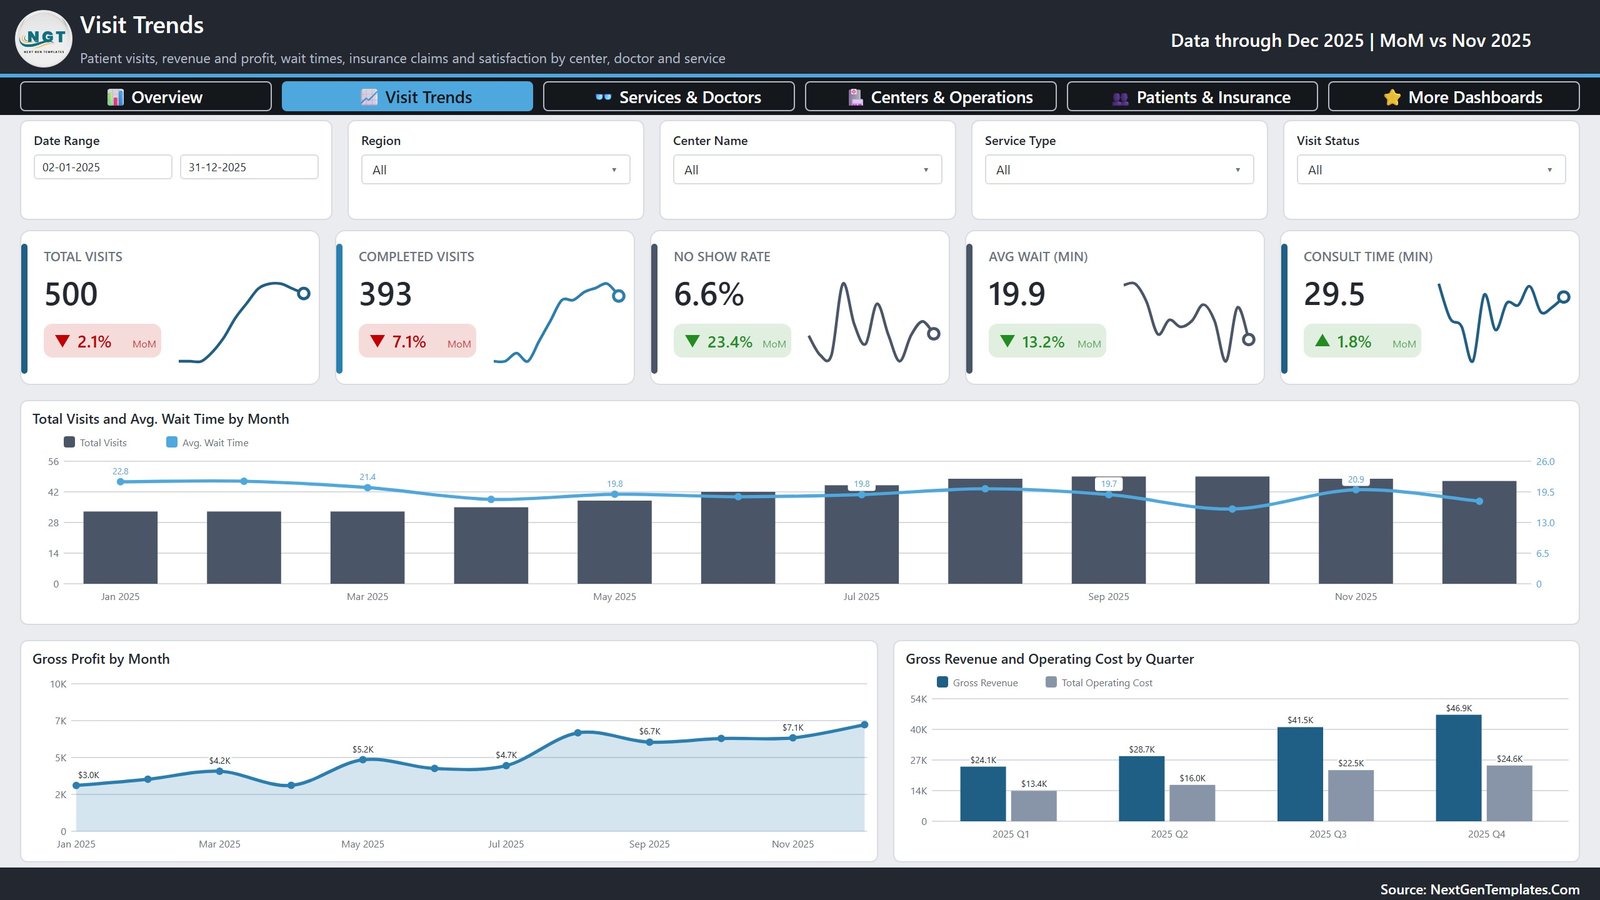
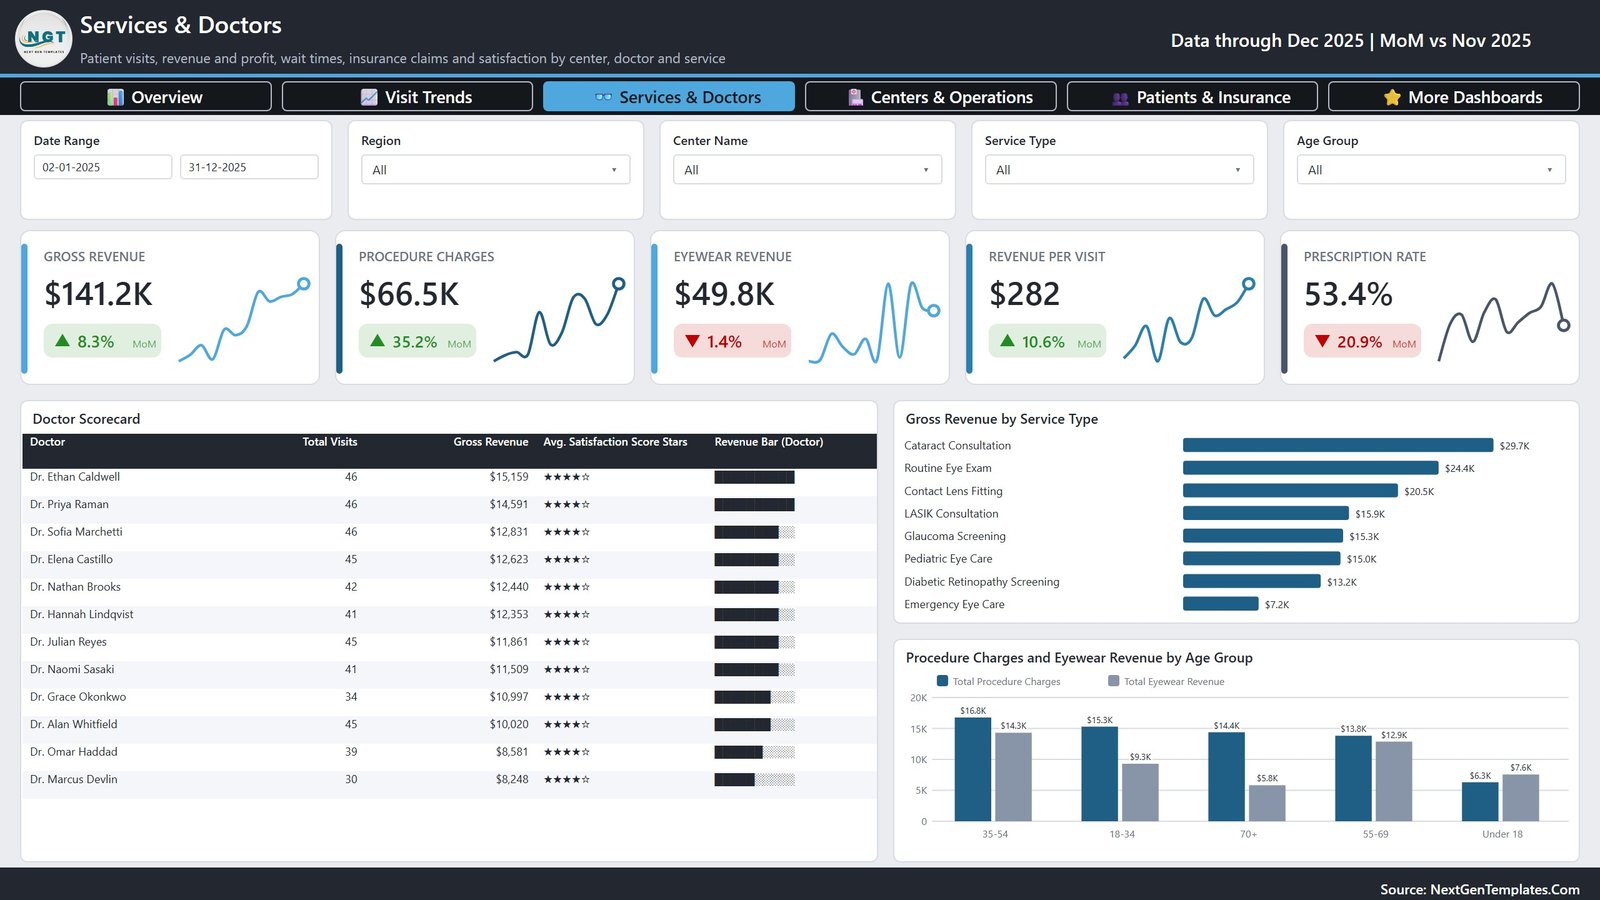
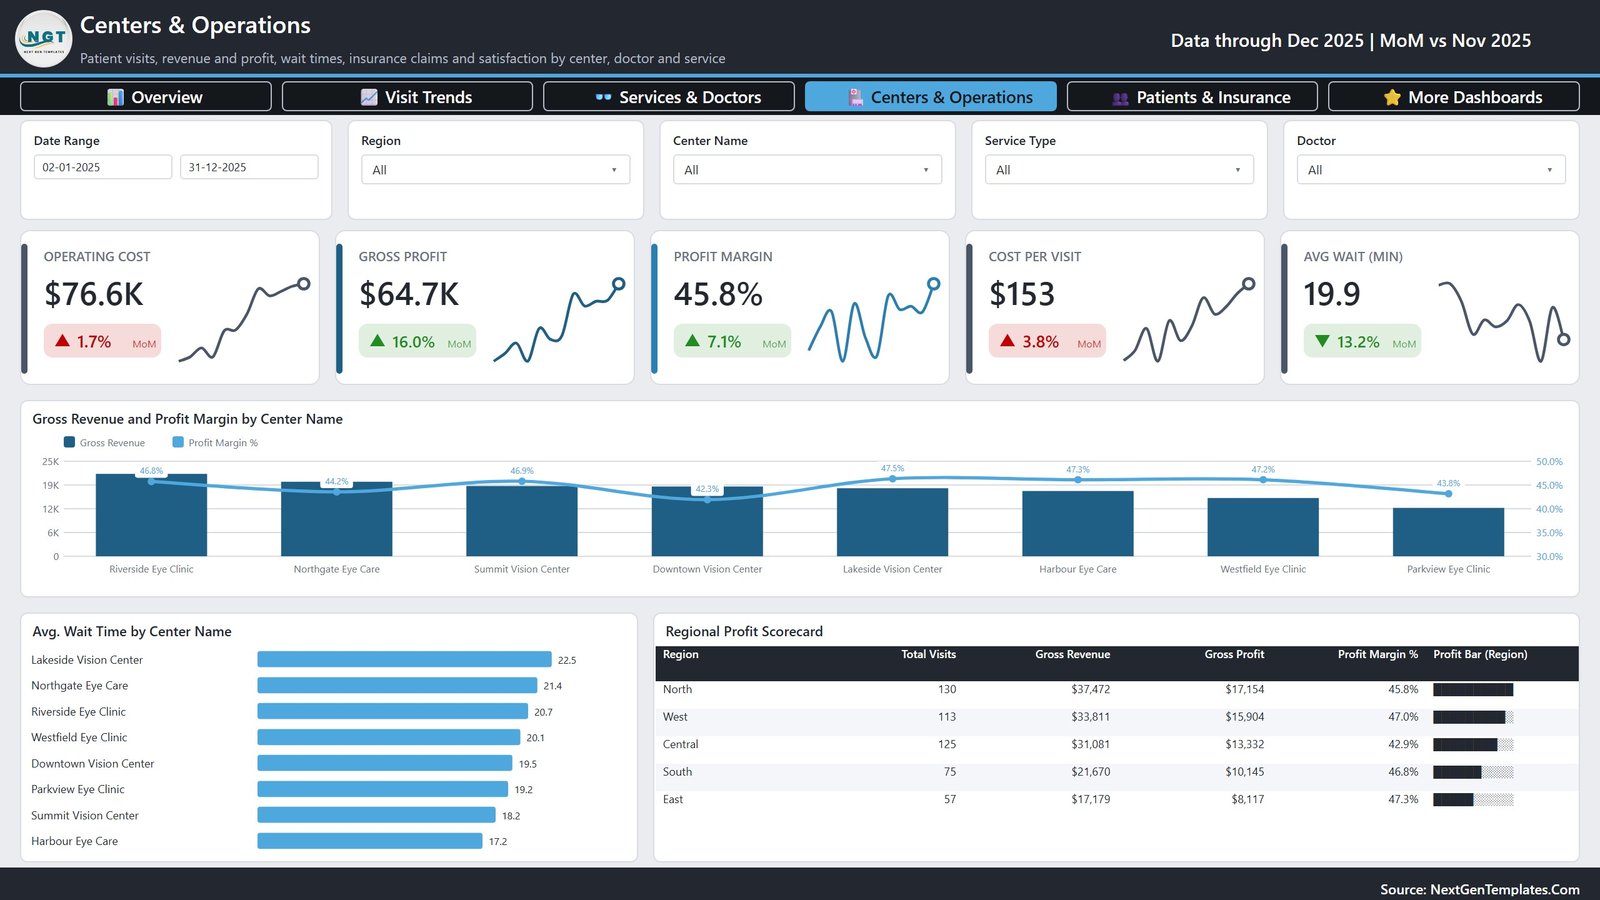
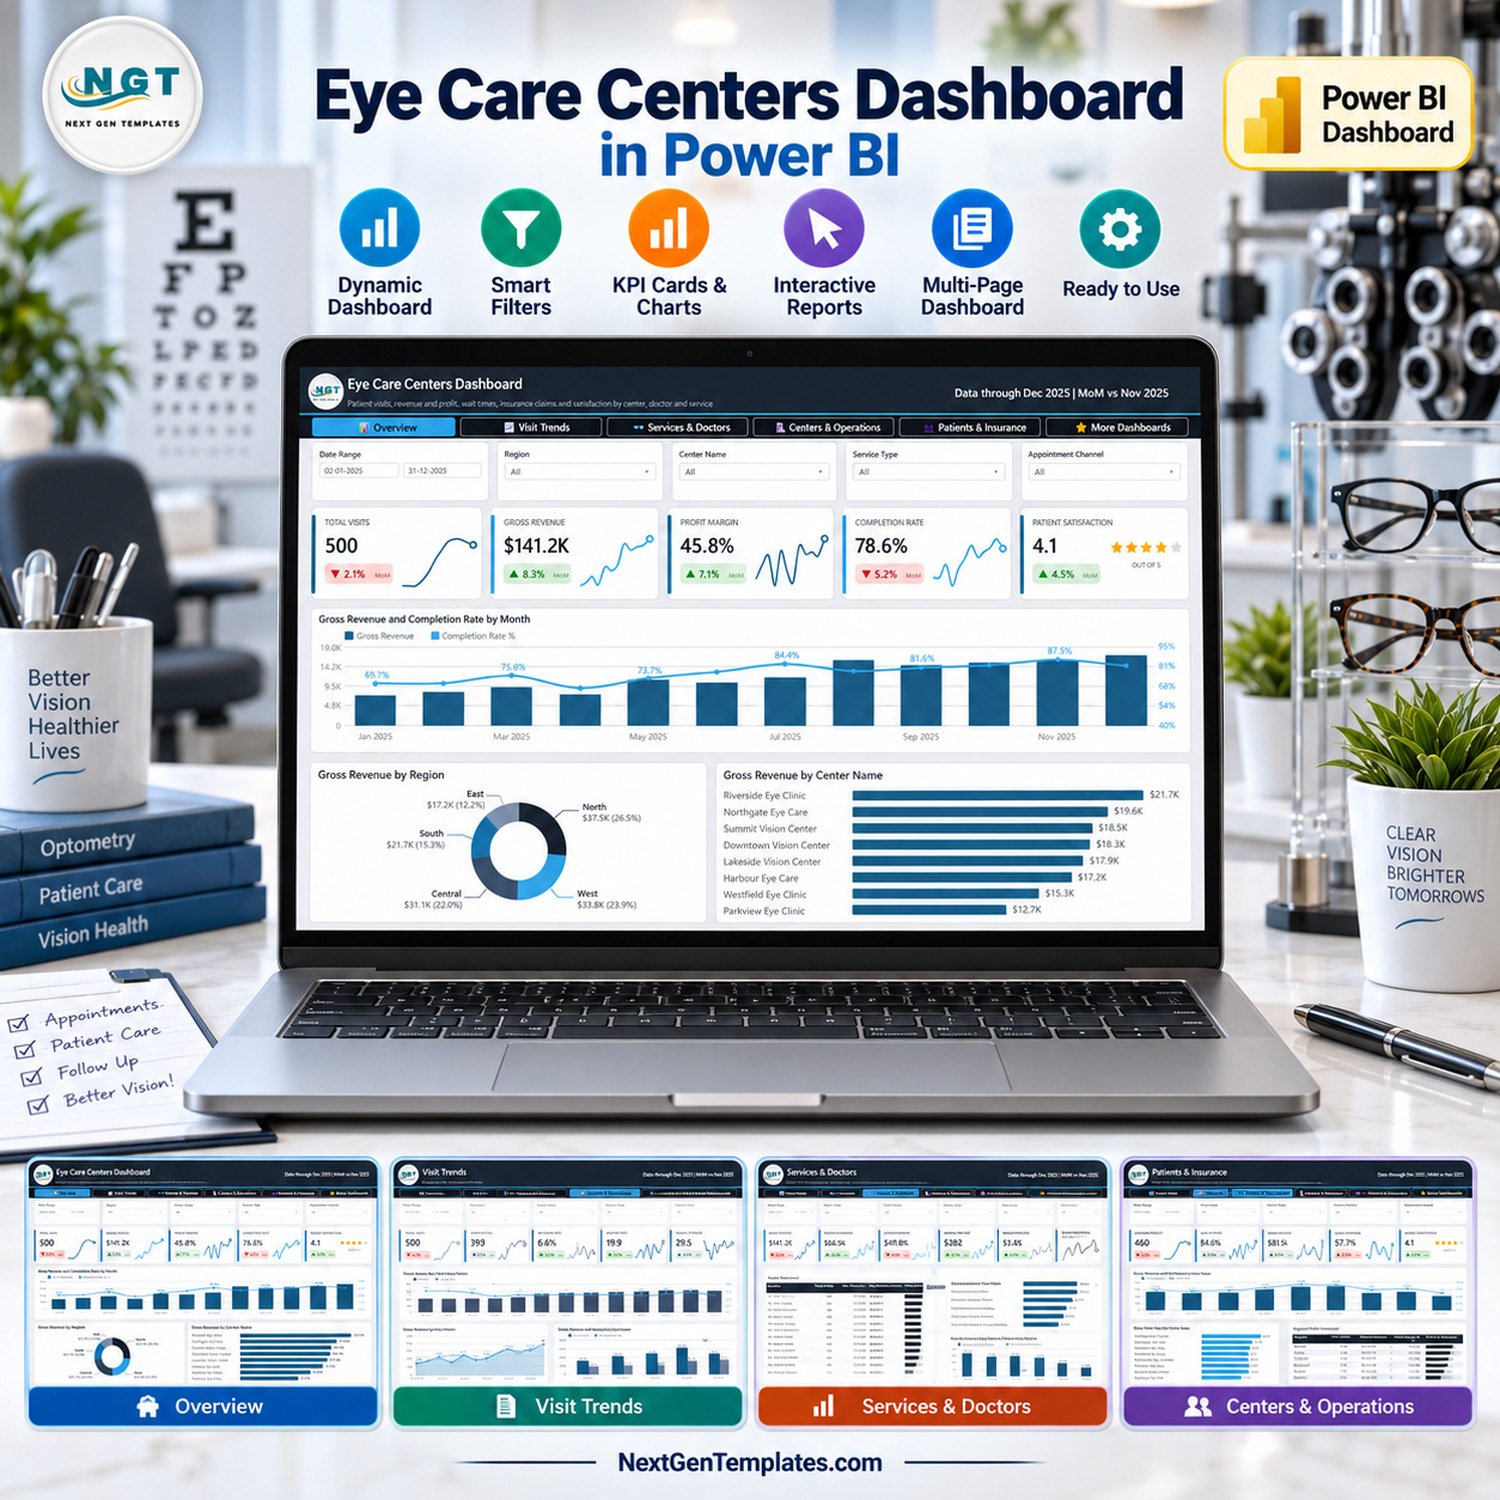
The Eye Care Centers Dashboard in Power BI turns 500 sample patient visits from 8 eye care centers into five analysis pages with 25 KPI cards, 11 charts and 3 scorecard tables. Every analysis page carries five synced slicers, and each KPI card compares December 2025 with November 2025 (month over month) beside a trend sparkline.
🌍 Join 8,400+ teams in 40+ countries using NextGenTemplates to replace paid SaaS tools with one-time-purchase Excel, Google Sheets, Power BI and HTML templates.
✅ Instant download · One-time payment · No subscription · No per-user fees · Lifetime access
🔑 Key Features of the Eye Care Centers Dashboard in Power BI
👁️ Five focused analysis pages – Overview, Visit Trends, Services & Doctors, Centers & Operations and Patients & Insurance, plus a More Dashboards page. A navigation bar across the top of every page moves you between them in one click.
📊 25 KPI cards with month-over-month change – The cards track 20 distinct measures, including Gross Revenue, Profit Margin, Completion Rate, No Show Rate, Avg Wait, Revenue per Visit, Prescription Rate, Cost per Visit, Insured Visits and Claim Coverage. Each shows a green or red MoM badge and a sparkline.
🎛️ Slicers that match the question – Date Range, Region, Center Name and Service Type sit on all five analysis pages. The fifth slicer changes per page: Appointment Channel, Visit Status, Age Group, Doctor or Insurance Provider.
🩺 Doctor, region and age-group scorecards – A Doctor Scorecard ranks 12 doctors by visits, gross revenue and average satisfaction stars. A Regional Profit Scorecard compares 5 regions on gross profit and margin, and an Age Group Scorecard adds insurance claims and follow-up rate.
💵 Revenue mix you can act on – Gross revenue splits into procedure charges and eyewear revenue by age group, and into 8 service types from Routine Eye Exam to Cataract Consultation, so you see which services and which patients drive income.
📦 What’s Inside the Template
The download is a zip holding Eye Care Centers Dashboard in Power BI.pbix, the Data.xlsx source workbook (500 visit rows, 24 columns, 2 January to 31 December 2025) and a Power BI dashboard user manual PDF.
Page 1: Overview
Total Visits (500), Gross Revenue ($141.2K), Profit Margin (45.8%), Completion Rate (78.6%) and Patient Satisfaction (4.1 out of 5). Charts: Gross Revenue and Completion Rate by Month, Gross Revenue by Region and Gross Revenue by Center Name, where Riverside Eye Clinic leads at $21.7K.
Page 2: Visit Trends
Total Visits, Completed Visits (393), No Show Rate (6.6%), Avg Wait (19.9 minutes) and Consult Time (29.5 minutes). Charts: Total Visits and Avg. Wait Time by Month, Gross Profit by Month, and Gross Revenue and Operating Cost by Quarter.
Page 3: Services & Doctors
Gross Revenue, Procedure Charges ($66.5K), Eyewear Revenue ($49.8K), Revenue per Visit ($282) and Prescription Rate (53.4%). Visuals: the Doctor Scorecard, Gross Revenue by Service Type, and Procedure Charges and Eyewear Revenue by Age Group.
Page 4: Centers & Operations
Operating Cost ($76.6K), Gross Profit ($64.7K), Profit Margin, Cost per Visit ($153) and Avg Wait. Visuals: Gross Revenue and Profit Margin by Center Name, Avg. Wait Time by Center Name and the Regional Profit Scorecard.
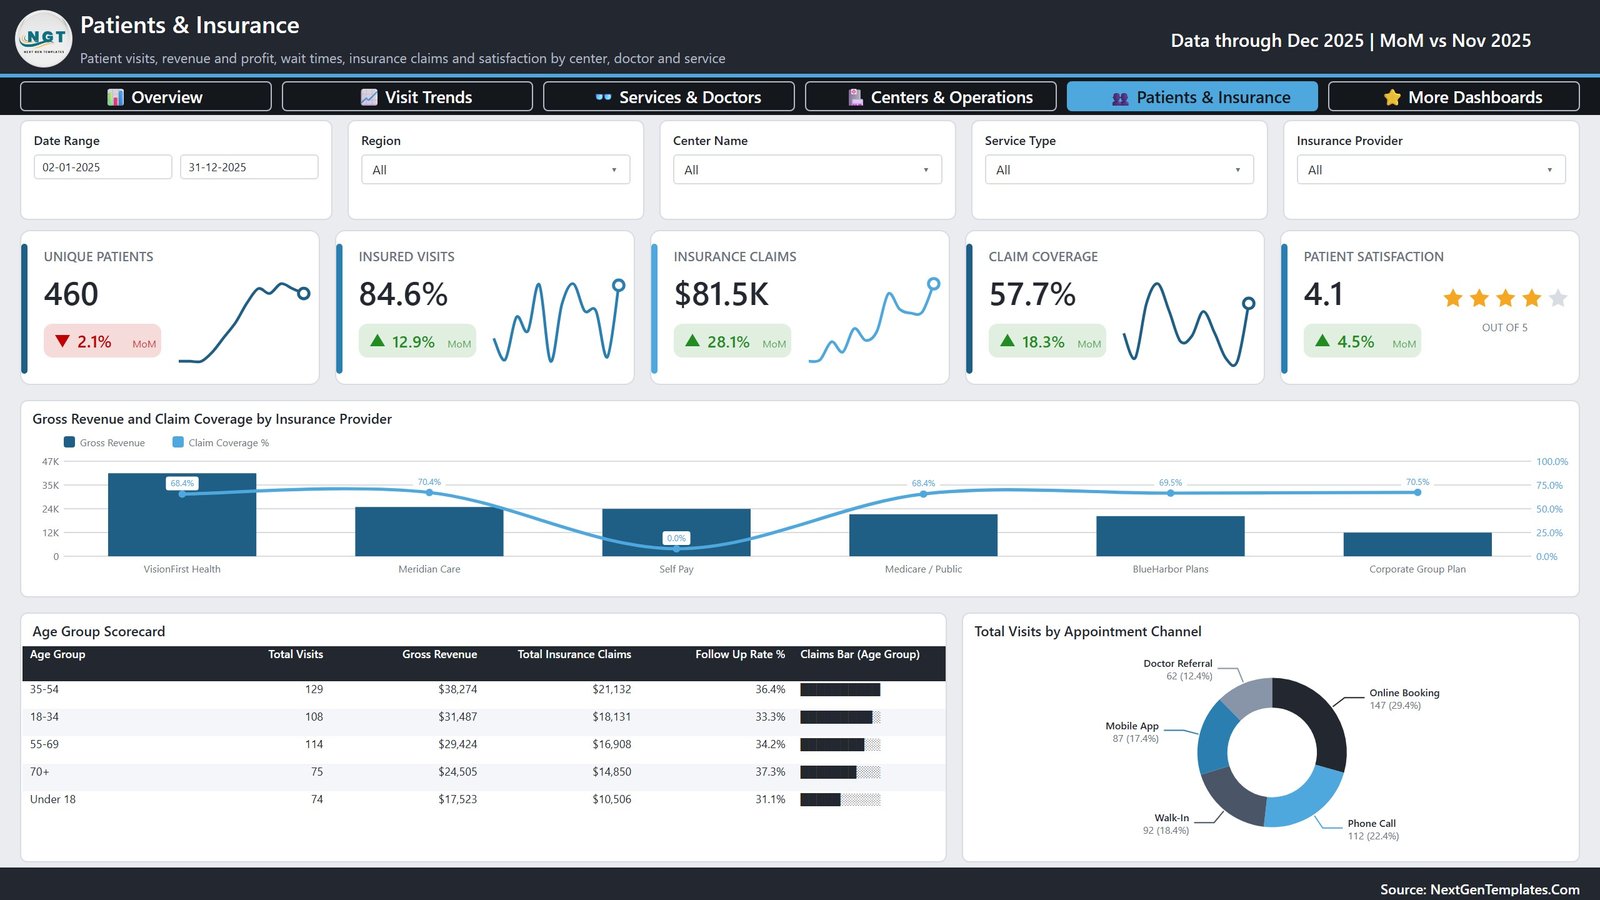
Page 5: Patients & Insurance
Unique Patients (460), Insured Visits (84.6%), Insurance Claims ($81.5K), Claim Coverage (57.7%) and Patient Satisfaction. Visuals: Gross Revenue and Claim Coverage by Insurance Provider, the Age Group Scorecard and Total Visits by Appointment Channel.
Page 6: More Dashboards
Links to more Power BI templates and custom dashboard services from NextGenTemplates.
📊 This Eye Care Template vs. Tableau / Qlik vs. Paid Healthcare Analytics SaaS
| Feature | This Power BI template | Tableau / Qlik build | Athenahealth / Kareo reporting |
|---|---|---|---|
| Cost | ✅ $17.99 one-time | Per-user licence plus build time | Monthly subscription, quoted per provider |
| Platform | Power BI Desktop (free, Windows) | Tableau or Qlik | Vendor web app |
| Setup time | ✅ Opens populated with sample data | Days to weeks from a blank canvas | Onboarding project |
| Real-time team collaboration | Through Power BI Service (Microsoft licence required) | Through Tableau Cloud / Qlik Cloud | ✅ Built in |
| Mobile access | Power BI mobile app after publishing | Vendor mobile app | ✅ Vendor app |
| Customizable fields | ✅ Every visual, measure and colour is editable | ✅ Fully custom | Limited to vendor reports |
| Share with link | After publishing to Power BI Service | After publishing to the cloud | ✅ Inside the vendor portal |
| Year-1 cost at 5 users | ✅ $17.99 plus any Microsoft licences you already hold | Five licences plus build hours | Five subscription seats or more |
| Eye-care pages ready | ✅ Doctors, services, centers, insurance | Built by you | General practice reports |
For eye care groups that want center, doctor and insurance reporting without paying for a new analytics subscription, this template sits in the sweet spot.
👥 Who This Template Is For — and Who It’s Not For
✅ This template is built for:
- Owners and operations managers of multi-location eye clinics and optometry groups
- Finance and analytics staff who already export visit data to Excel
- Power BI consultants who need a ready eye care report to adapt for a client
❌ This template is NOT for:
- Teams looking for an EHR/EMR, appointment booking, billing or practice-management system
- Anyone needing clinical decision support, diagnosis or a HIPAA/GDPR-certified platform
- Mac-only users without access to Power BI Desktop on Windows
⚠️ Please note: this is an analytics template built on fictional sample data. Every patient, doctor and center name is invented. It is not an EHR/EMR, practice-management, clinical-decision or diagnostic tool, and it makes no HIPAA, GDPR or other compliance claim. If you load real patient data, you are responsible for storing, sharing and protecting it under the rules that apply to you.
⚙️ How to Use the Dashboard
- Install Power BI Desktop (free from Microsoft, Windows).
- Unzip the download and open the .pbix file to explore the sample data.
- Replace the rows in Data.xlsx with your visits, keeping the 24 column headers.
- Update the file path in Power Query and click Refresh.
- Use the slicers to filter by date, region, center, service type and more.
💼 Real-World Use Cases
Maria runs operations for a five-location optometry group. She opens Centers & Operations every Monday to compare wait times and profit margin by center, and moves staff when one clinic’s average wait climbs above 22 minutes.
David is the finance lead at a regional eye clinic. He uses Patients & Insurance to track claim coverage by insurance provider and Services & Doctors to see how procedure charges and eyewear revenue split across age groups.
❓ Frequently Asked Questions
What does the Eye Care Centers Dashboard in Power BI track?
It tracks 20 measures across 25 KPI cards, including total visits, gross revenue, profit margin, completion rate, no show rate, average wait time, revenue per visit, prescription rate, insurance claims and claim coverage, broken down by center, region, doctor, service type, age group and insurance provider.
Do I need a paid Power BI licence?
No. The .pbix opens in Power BI Desktop, which Microsoft offers free for Windows. You only need a Power BI Pro or Premium licence if you want to publish and share the report in Power BI Service with colleagues.
How long does setup take?
The file opens with 500 sample visits already loaded, so you can explore it straight away. To use your own data, paste your rows into Data.xlsx with the same 24 headers, point Power Query at the file and refresh.
Is this a patient management or EHR system?
No. It is a reporting template only. It does not book appointments, store medical records, bill insurers or give clinical advice. Use it alongside your existing systems to analyse visit, revenue and insurance data you export from them.
How is it different from the Ophthalmology Services Dashboard in Power BI?
The Ophthalmology Services Dashboard in Power BI is an earlier, separate build. This newer template focuses on multi-center eye care operations, with doctor, regional and age-group scorecards, insurance claim coverage and appointment channel analysis.
Is an Excel version available?
An Excel edition of this template is in preparation. For now, this Power BI file is the available edition.
👤 About the Author
Built by PK — Microsoft Certified Professional with 15+ years of Excel, Google Sheets and Power BI experience. Founder of NextGenTemplates, reaching 300K+ subscribers across YouTube channels (@PKAnExcelExpert, @NextGenTemplates, @NeoTechNavigators). Every template is hand-built and tested before release.
🔗 Explore Related Templates
🔹 Ophthalmology Services KPI Dashboard in Power BI – a month-picker KPI scorecard for ophthalmology teams.
🔹 Optical Retail Dashboard in Power BI – sales analysis for optical and eyewear stores.
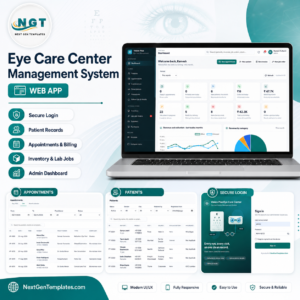
🔹 Eye Care Center Management System Web App – for teams that need to record patients and appointments rather than analyse them.
🔹 Optical Store Appointment Calendar in Excel – plan eye test and fitting appointments.
🔹 Clinics Dashboard in Google Sheets – clinic analytics for Google Sheets users.
Browse all Power BI Dashboards or the full Power BI template collection.
📖 Click here to read the Detailed Blog Post
🎥 Visit our YouTube channel for step-by-step video tutorials
👉 YouTube.com/@NextGenTemplates
Watch the step-by-step video Demo:
📅 Last updated: September 2026




























Reviews
There are no reviews yet.