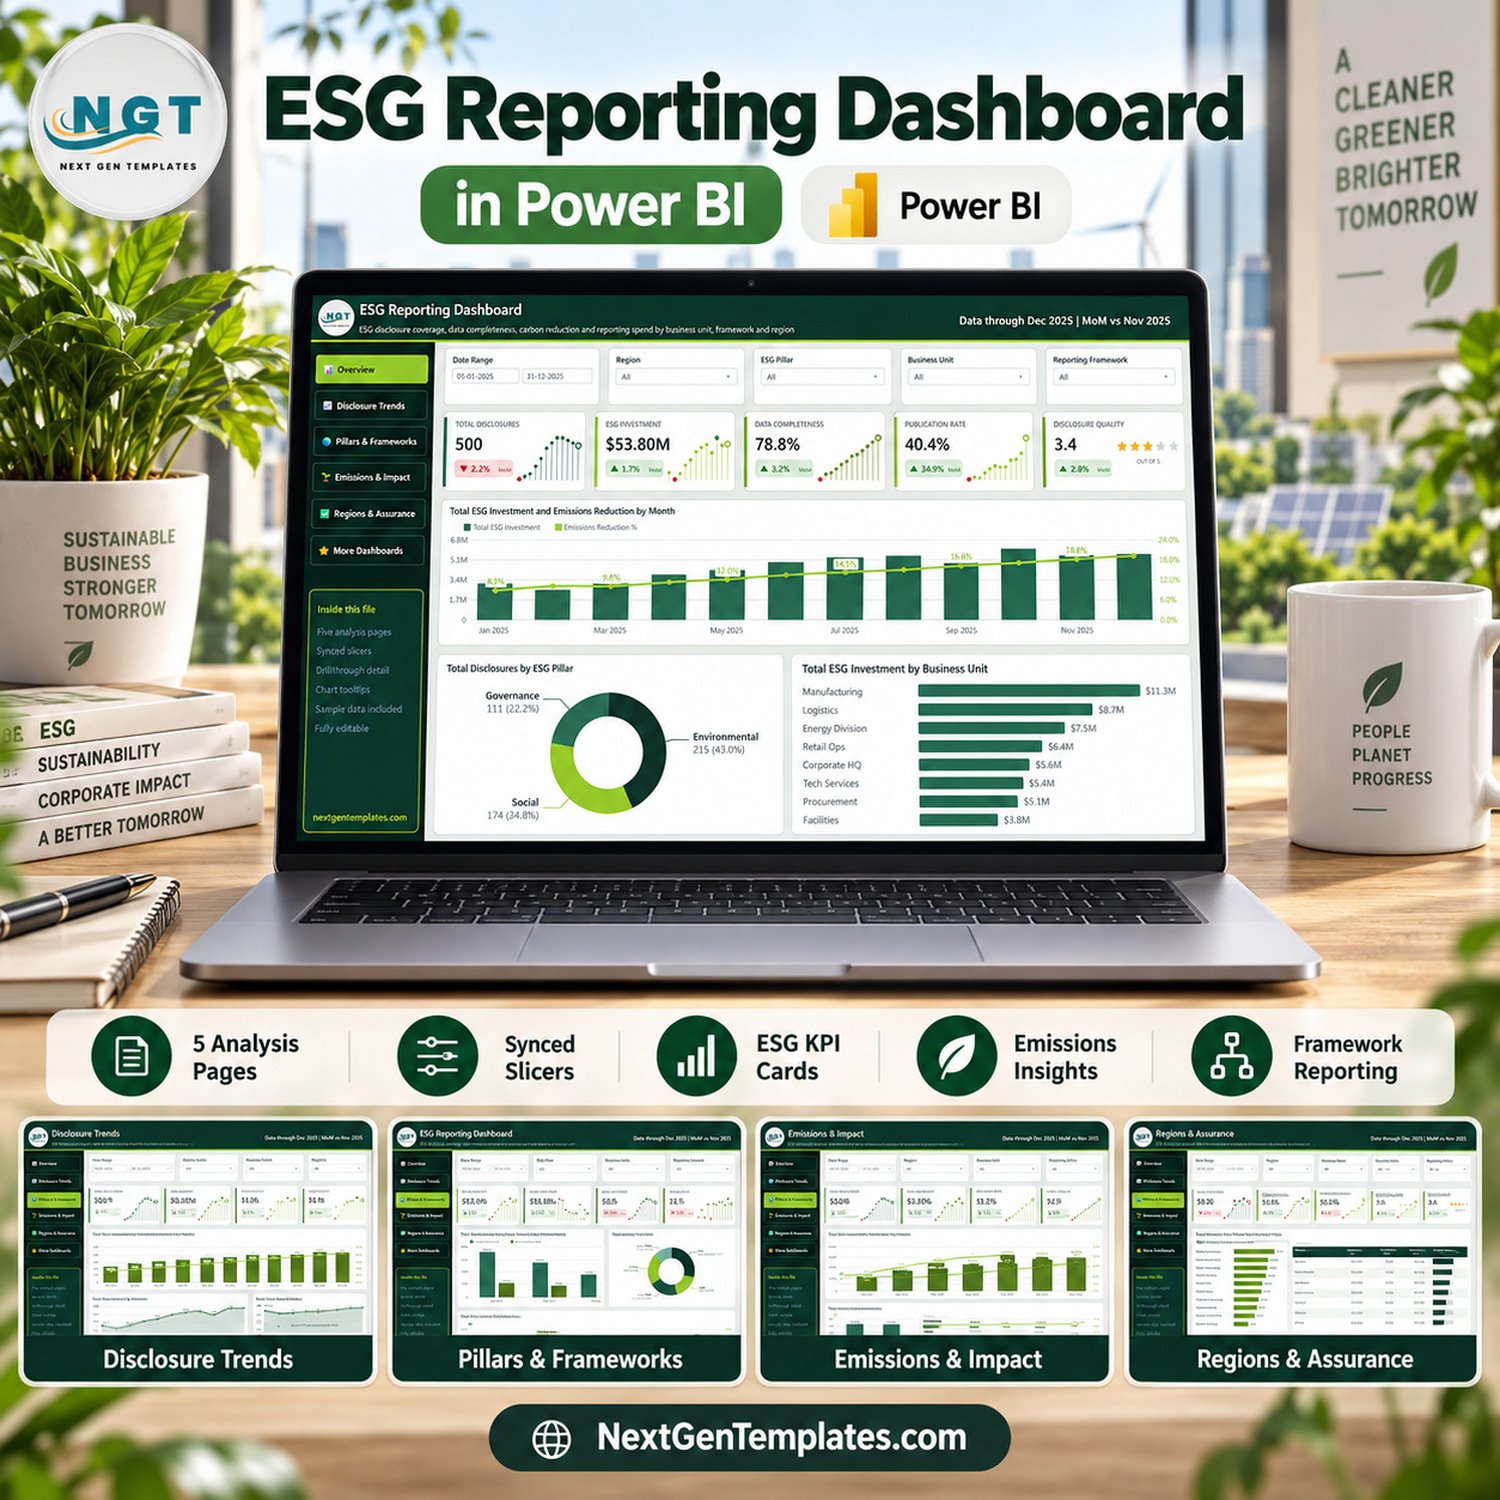
The ESG Reporting Dashboard in Power BI is a ready-to-open .pbix report that turns an ESG disclosure log into five analysis pages, a hidden drillthrough page and two hover tooltip pages. The sample model holds 500 disclosure records dated 1 January to 31 December 2025 across 8 business units, 5 regions, 3 ESG pillars, 5 reporting-framework labels and 10 disclosure topics. It opens already showing $53.80M of ESG investment, 630,169 tCO2e of carbon emissions with 86,547 tCO2e reduced (13.7%), and 78.8% data completeness. Replace the sample table with your own export and every card, chart and scorecard recalculates. One payment, no subscription, and the file is yours to rebrand.
Read this before you buy. This is an analytics template over sample data. It is not a regulatory reporting system, not a disclosure-filing tool and not a carbon accounting engine. It does not make any organisation compliant with GRI, SASB, TCFD, CSRD or ISSB, it performs no assurance, and nothing it produces is a certified or assured disclosure. The framework, assurance and status columns are labels you use to slice your own records. The report contains no framework rules, no emission factors and no Scope 1, 2 or 3 split.
Key Features of the ESG Reporting Dashboard in Power BI
- Five analysis pages – Overview, Disclosure Trends, Pillars & Frameworks, Emissions & Impact, and Regions & Assurance – plus a Get More Dashboards page.
- A real Details drillthrough page, checked in the report definition and bound to eight fields: Business Unit, Region, ESG Pillar, Reporting Framework, Disclosure Topic, Assurance Level, Reporting Officer and Disclosure Status. Right-click a bar or a table row and it lists the matching records in a 13-column table.
- Two hidden tooltip pages (Metric Detail and Trend Detail, 280×360) that appear on hover instead of forcing a page change.
- Five KPI cards on every analysis page, each with a month-on-month change (December 2025 against November 2025) and a small monthly trend beneath the figure.
- Five slicers per page – Date Range, Region, ESG Pillar and Business Unit on every analysis page, plus one page-specific slicer: Reporting Framework, Disclosure Status, Assurance Level, Disclosure Topic or Reporting Officer.
- 28 named measures used by the visuals (card-formatting variants included), such as Total ESG Investment, Total Compliance Cost, Compliance Cost Ratio %, Data Completeness %, Publication Rate %, Overdue Rate %, Audited Rate %, Emissions Reduction %, Investment Per Ton Reduced and Avg. Quality Score.
- Two scorecard tables – a Regional Carbon Scorecard and a Reporting Officer Scorecard – with in-cell bars and star ratings.
- A pillar-by-framework matrix that shows ESG investment for every ESG Pillar and Reporting Framework combination, with row and column totals.
- Fully editable – colours, logo, wording, measures and page layout. Nothing is locked.
What Each Page Shows
1. Overview
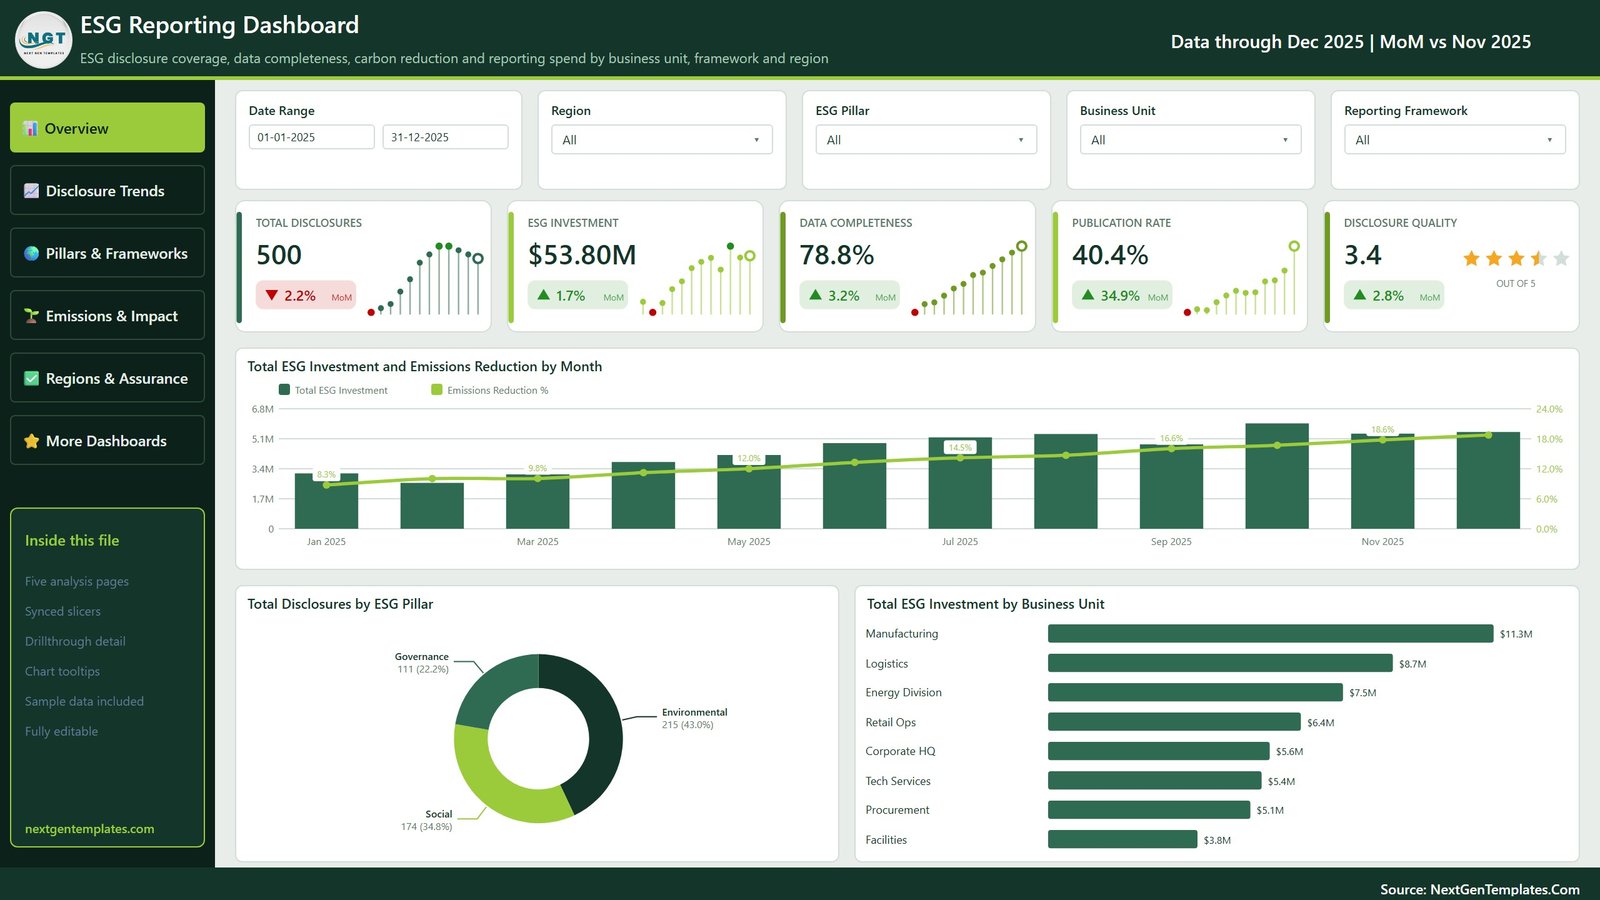
Cards for Total Disclosures (500), ESG Investment ($53.80M), Data Completeness (78.8%), Publication Rate (40.4%) and Disclosure Quality (3.4 out of 5, shown as stars). Below them sit Total ESG Investment and Emissions Reduction by Month, Total Disclosures by ESG Pillar (Environmental 215, Social 174, Governance 111) and Total ESG Investment by Business Unit, where Manufacturing leads at $11.3M and Facilities trails at $3.8M.
2. Disclosure Trends
Adds Data Points (39,477 collected) and Compliance Cost ($16.55M). Total Disclosures and Data Completeness by Month shows completeness climbing from 63.0% in January to 90.0% by November, Total ESG Investment by Month traces the monthly spend, and ESG Investment and Compliance Cost by Quarter moves from $8.8M and $3.0M in Q1 to $16.8M and $5.0M in Q4.

3. Pillars & Frameworks
Cards for Cost Ratio (30.8%) and Audited Rate (21.6%). ESG Investment and Compliance Cost by ESG Pillar puts Environmental at $23.6M against $7.2M of cost, Total Disclosures by Reporting Framework splits the log across GRI (126), SASB (106), TCFD (105), CSRD (96) and ISSB (67), and a matrix breaks investment down by pillar and framework.

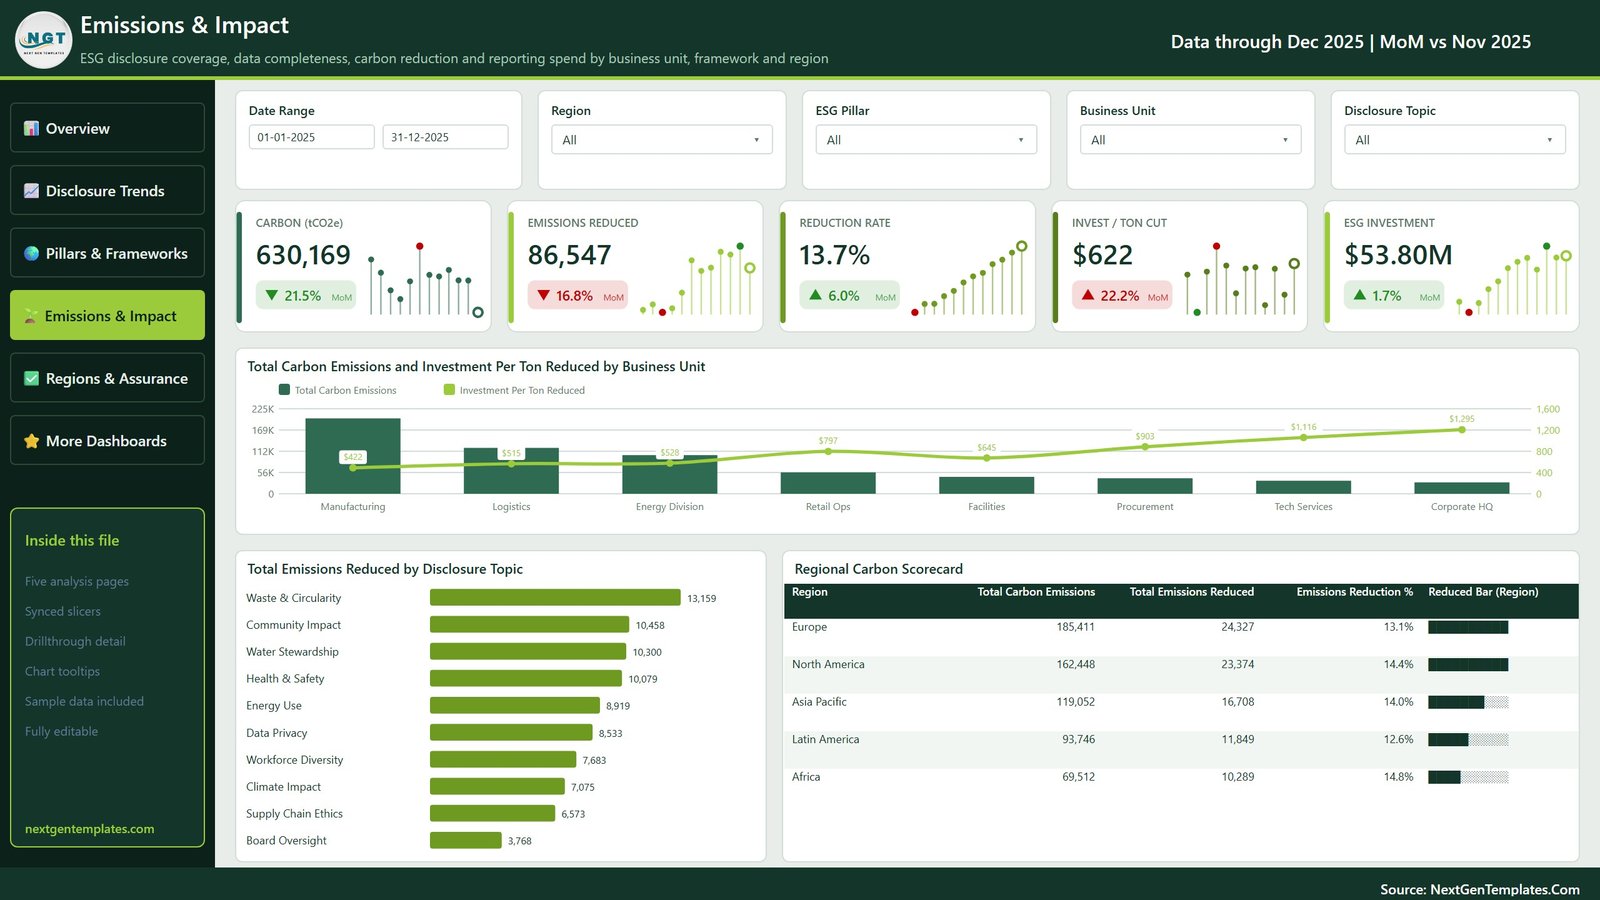
4. Emissions & Impact
Cards for Carbon (630,169 tCO2e), Emissions Reduced (86,547), Reduction Rate (13.7%) and Invest / Ton Cut ($622). Total Carbon Emissions and Investment Per Ton Reduced by Business Unit shows the cost of each tonne cut rising from $422 in Manufacturing to $1,295 at Corporate HQ. Total Emissions Reduced by Disclosure Topic ranks Waste & Circularity first (13,159), and the Regional Carbon Scorecard compares emissions, reductions and reduction % for all five regions – Africa has the best rate at 14.8%.
5. Regions & Assurance
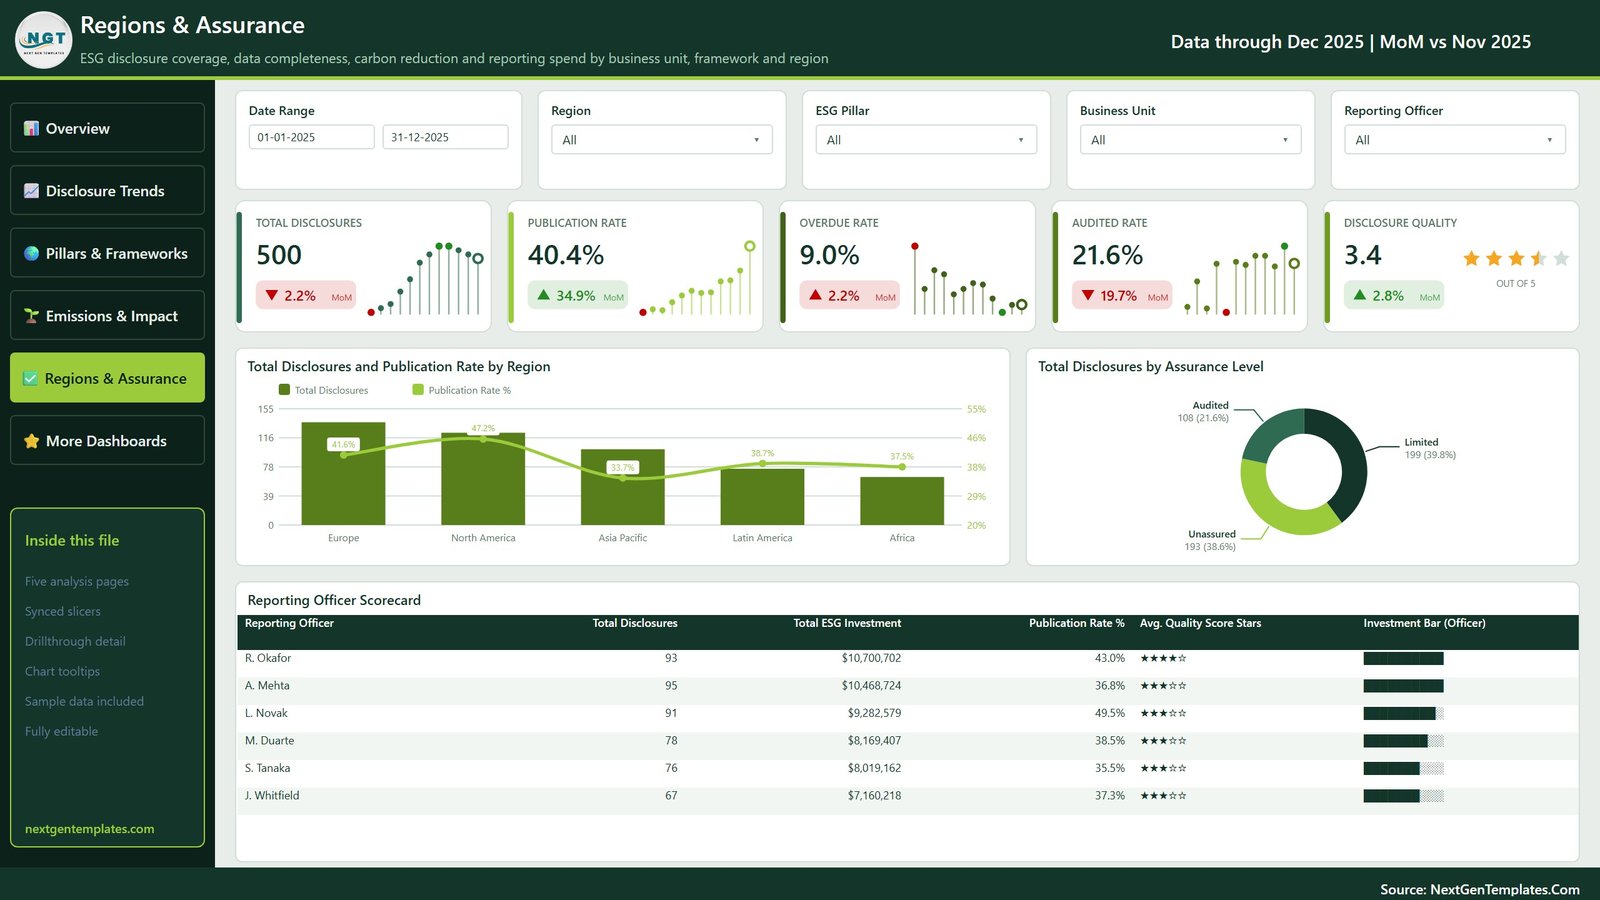
Cards for Publication Rate (40.4%), Overdue Rate (9.0%), Audited Rate (21.6%) and Disclosure Quality. Total Disclosures and Publication Rate by Region sets volume against publication, Total Disclosures by Assurance Level shows Limited 199, Unassured 193 and Audited 108, and the Reporting Officer Scorecard ranks six fictional officers by disclosures, investment, publication rate and average quality.
What’s Inside the Download
- ESG Reporting Dashboard in Power BI.pbix – the report: 5 analysis pages, the Get More Dashboards page, the Details drillthrough page and 2 tooltip pages.
- Data.xlsx – the 500-row sample table with 17 columns: Report ID, Report Date, Business Unit, Region, ESG Pillar, Reporting Framework, Disclosure Topic, Assurance Level, Reporting Officer, Disclosure Status, Data Points Required, Data Points Collected, Carbon Emissions, Emissions Reduced, ESG Investment, Compliance Cost and Disclosure Quality Score.
- Power BI Dashboard – User Manual.pdf – how to open the file, repoint the data source and refresh.
You need Power BI Desktop, which is free from Microsoft and runs on Windows.
How This Template Compares
| Option | Cost | Time to first report | What you get |
|---|---|---|---|
| This template | $17.99 once | Minutes with the sample, about an hour with your own export | Five designed pages, drillthrough, tooltips and scorecards you can edit freely |
| Build it yourself in Power BI | Your time | Days to weeks | Exactly what you design, starting from a blank canvas |
| Dedicated ESG reporting software | Recurring subscription | Weeks of onboarding | Data collection workflows, framework mapping and audit trails – things this template does not do |
Who This Template Is For – and Who It’s Not For
A good fit for: sustainability and ESG analysts who already keep a disclosure log in Excel, finance and investor-relations teams preparing an internal ESG review, consultants who want a branded starting point for client reporting, and Power BI learners who want a realistic multi-page model to study.
Not a fit for: anyone who needs a carbon accounting engine, emission-factor calculations, Scope 1, 2 and 3 inventories, framework-mapped disclosure filing, assurance workflows or an audit trail. Use a dedicated platform for those and point this report at its export if you want the visuals.
How to Use the ESG Reporting Dashboard in Power BI
- Install Power BI Desktop and open the
.pbixfile. It opens populated with the 2025 sample. - Click Transform data and change the source path to your own copy of
Data.xlsx, or to any source that returns the same 17 column names. - Click Refresh. Every card, chart, matrix and scorecard recalculates.
- Use the five slicers on each page, and right-click any bar or table row and choose Drill through > Details to see the underlying records.
- Rename the framework, topic and business-unit values to match your own structure, then publish to the Power BI Service or export to PDF or PowerPoint.
Frequently Asked Questions
Does this dashboard make our ESG report compliant with GRI, CSRD or ISSB?
No. Reporting Framework is a five-value label (GRI, SASB, TCFD, CSRD, ISSB) used to group your own records. The report encodes no framework requirements, checks nothing against a standard and produces no certified or assured disclosure.
Does it calculate our carbon footprint?
No. Carbon Emissions and Emissions Reduced are numbers you supply in the data table. There are no emission factors, no activity data and no Scope 1, 2 or 3 breakdown. The report sums and compares what you load.
How is Data Completeness worked out?
It is Data Points Collected divided by Data Points Required. In the sample that is 39,477 out of 50,115, or 78.8%. It measures how much of your planned data you have gathered, not whether that data is accurate.
What does “Audited” mean in this report?
It is one of three Assurance Level labels (Audited, Limited, Unassured) stored on each record. The template does not perform or verify any assurance – it only counts the labels you enter.
Is the sample data real?
No. All 500 records are fictional, and the six reporting officers are invented initial-and-surname labels. Replace them with your own data before sharing anything.
Do I need a Power BI licence?
Not to use it. Power BI Desktop is free. A Pro or Premium Per User licence is only needed to publish and share the report in a workspace.
Is there an Excel version?
An ESG Reporting Dashboard in Excel is in preparation and is not available yet. This listing is the Power BI edition.
About the Author
Built by PK – Microsoft Certified Professional with 15+ years of Excel, Google Sheets, and Power BI experience. Founder of NextGenTemplates, reaching 300K+ subscribers across YouTube channels. Every template is hand-built and tested before release.
Explore Related Templates
- Carbon Trading Dashboard in Power BI – carbon credit volumes, prices and trading activity.
- ESG Investment Firms Dashboard in Power BI – ESG-focused fund and portfolio analysis.
- Green Building Certification Dashboard in Power BI – certification projects and building performance.
- Clean Tech Dashboard in Power BI – clean technology projects, funding and output.
- Impact Investment Funds Dashboard in Power BI – capital deployed and impact outcomes.
- Energy and ESG Sustainability Bundle – eight Excel and Power BI templates at a bundle price.
- Browse the full Power BI and Power BI Dashboard catalogues.
Get this ESG reporting dashboard for $17.99 (regular $29.99) – one payment, instant download, yours to rebrand and reuse. Open it, point it at your own disclosure log, and walk into the next ESG review with a clear picture of spend, emissions and reporting progress.
Last updated: 13 September 2026.
📖 Read the complete walkthrough of the ESG Reporting Dashboard in Power BI on our blog: ESG Reporting Dashboard in Power BI – full guide.