

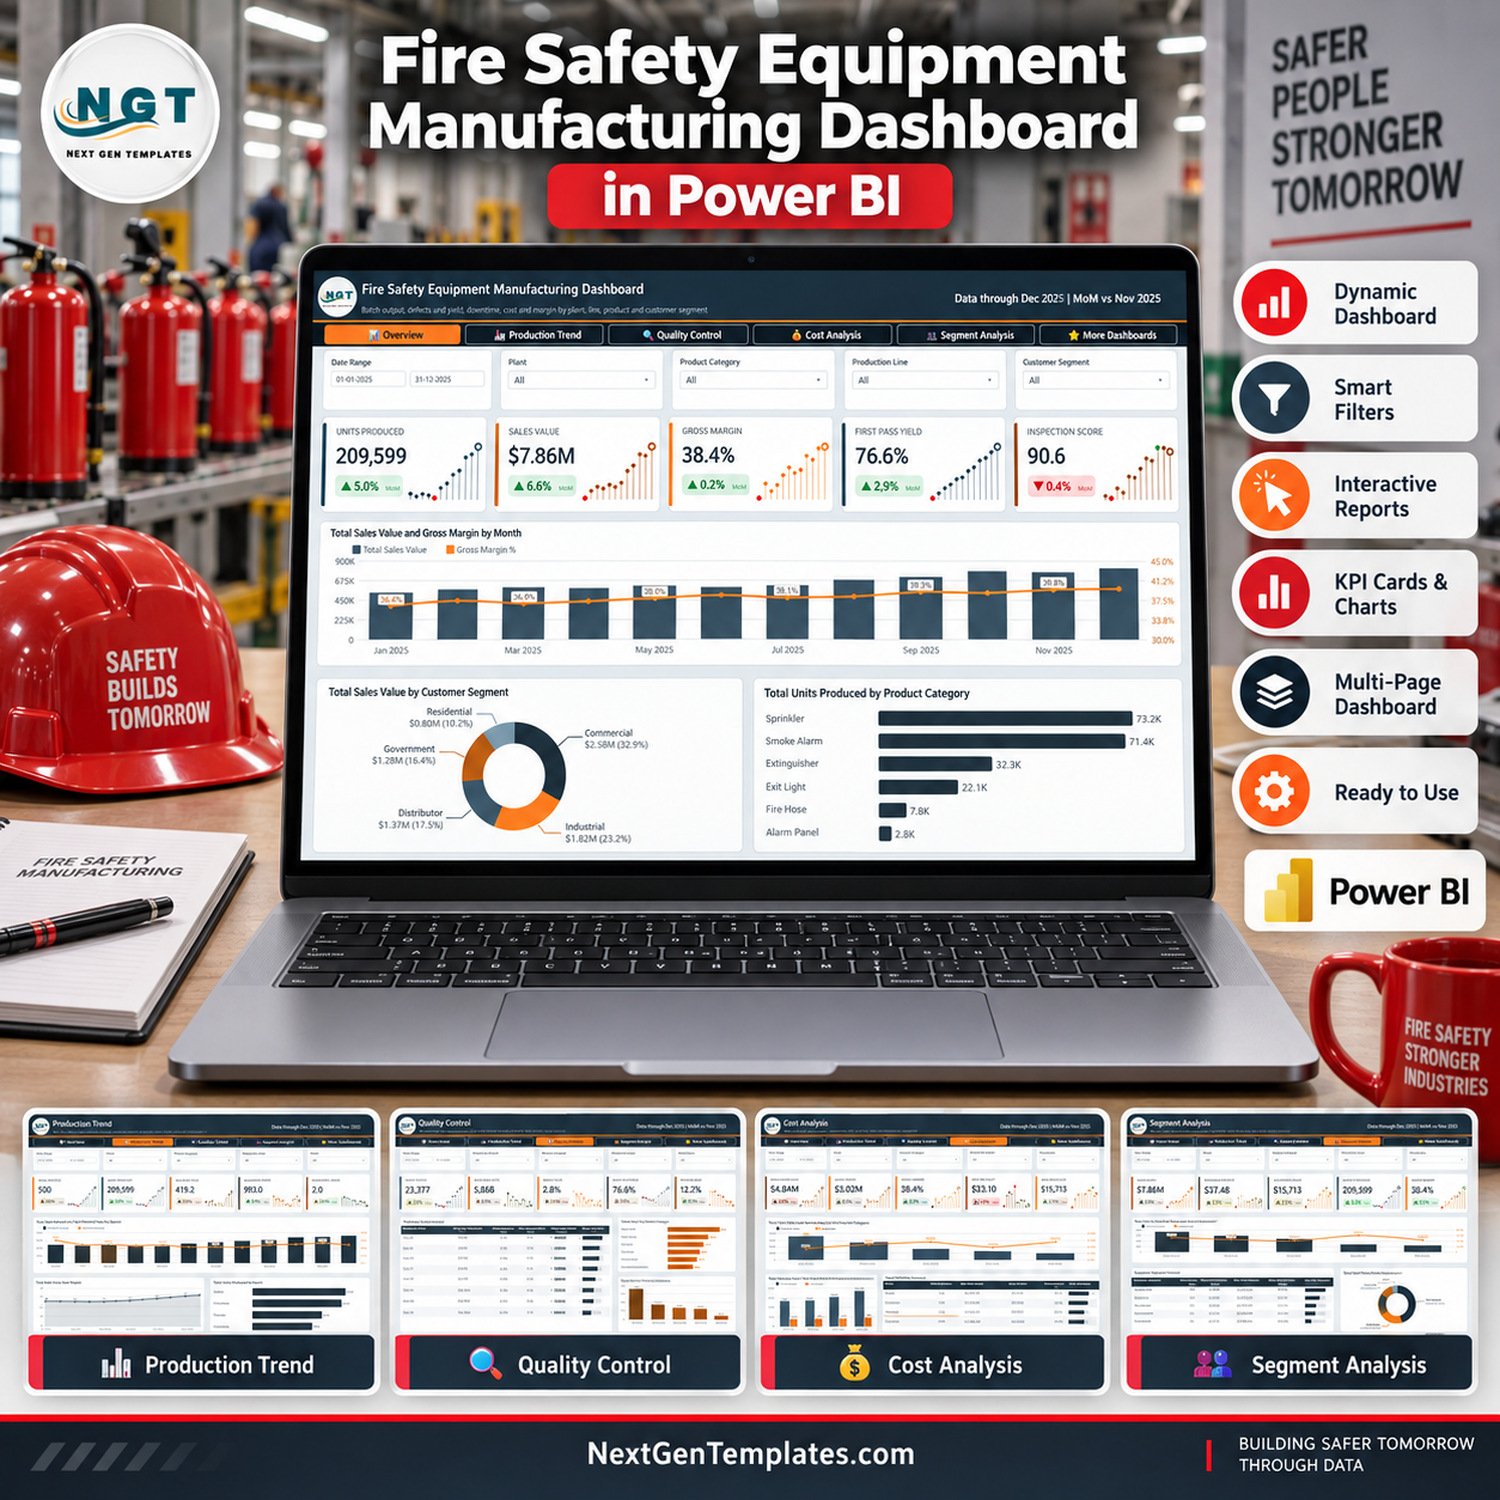
Fire Safety Equipment Manufacturing Dashboard in Power BI turns batch-level production records into five focused report pages for plant, quality and commercial review. The supplied sample model shows 500 batches, 209,599 units produced, $7.86M sales value, 38.4% gross margin, 76.6% first-pass yield and a 90.6 inspection score. It is an instant digital download with a one-time price, no template subscription and no per-user template fee. The package is editable in Power BI Desktop, so you can replace the sample records with your own structured manufacturing data before using it for internal reporting.
Important: this is a management reporting template. It does not certify equipment, prove compliance, replace inspection records, or connect to production machinery by itself.

Key Features of Fire Safety Equipment Manufacturing Dashboard in Power BI
- Five report pages: Overview, Production Trend, Quality Control, Cost Analysis and Segment Analysis.
- Interactive filtering: use the available date, plant, product category, production line, shift, supervisor, batch status, customer segment and certification slicers on their relevant pages.
- Production visibility: review batches, units produced, average batch size, downtime hours and downtime per batch.
- Quality review: compare units tested, defective units, defect rate, first-pass yield, rework rate, production-line inspection scores and certification breakdowns.
- Cost and margin analysis: monitor production cost, gross profit, gross margin, cost per unit, material cost, labor cost and plant profitability.
- Customer and product analysis: compare sales value, units, revenue per unit and margin across customer segments and equipment categories.
- Editable PBIX: open the report in Power BI Desktop and adapt fields, visuals and the data connection to your reporting process.
What’s Inside the Fire Safety Equipment Manufacturing Dashboard in Power BI
The ZIP download contains the editable Power BI PBIX report, the bundled Excel sample-data workbook and a Power BI dashboard user manual PDF. The report uses five analytical pages:
Overview
Start with five headline cards for units produced, sales value, gross margin, first-pass yield and inspection score. Monthly sales and margin, customer-segment value and product-category volume place commercial and operational results on one screen.
Production Trend
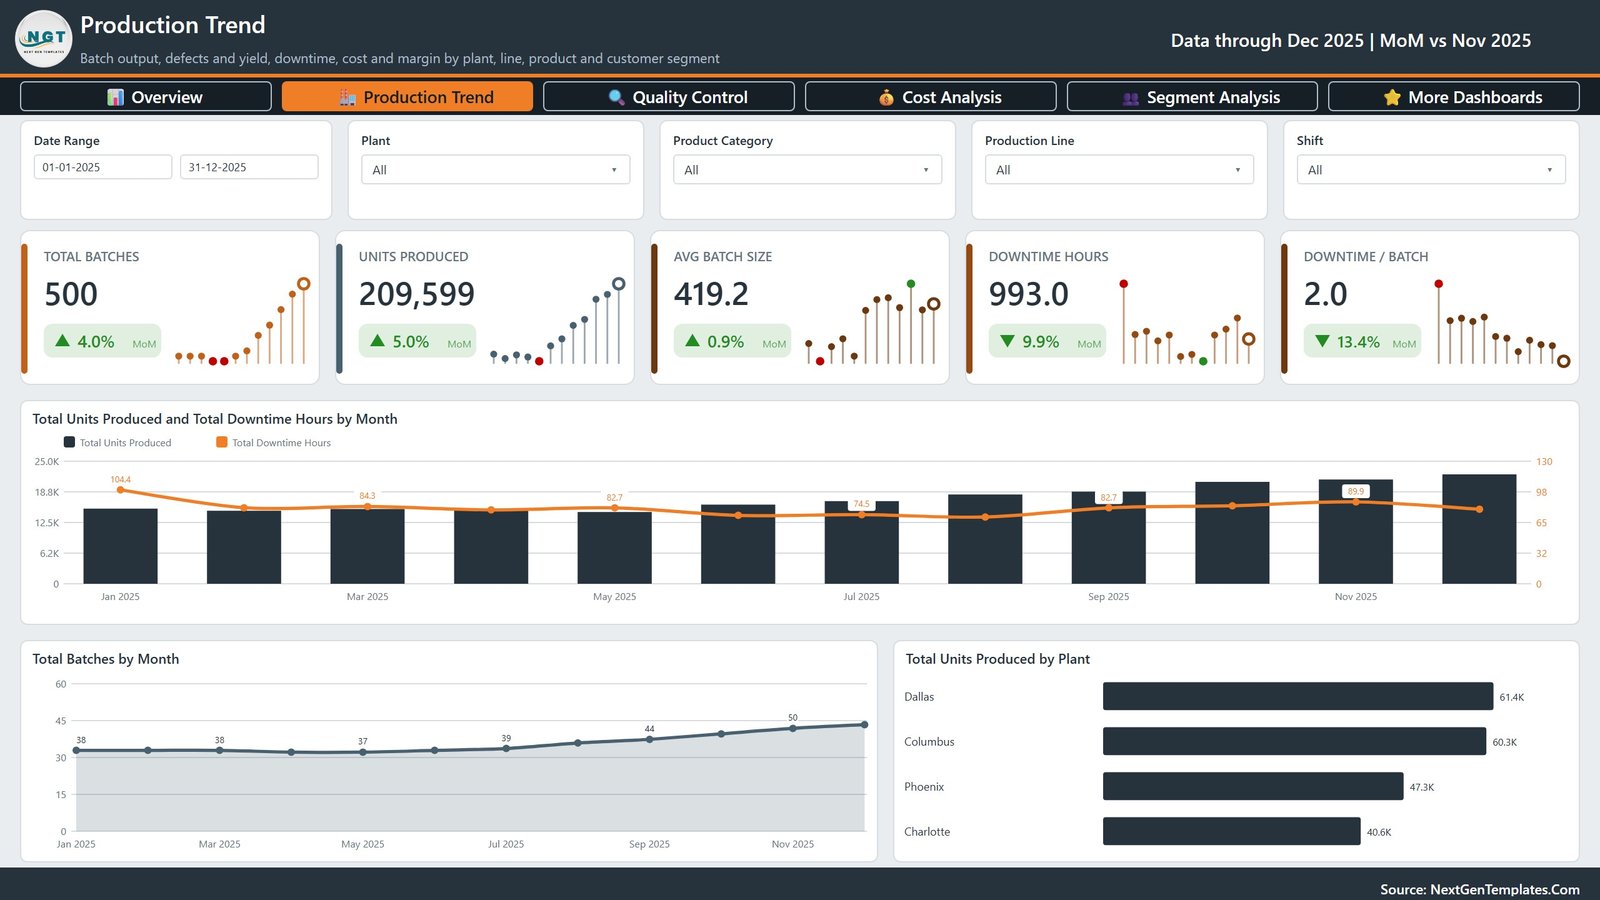
Track total batches, units, average batch size, downtime hours and downtime per batch. Monthly production and downtime trends are paired with batch trends and plant output.
Quality Control
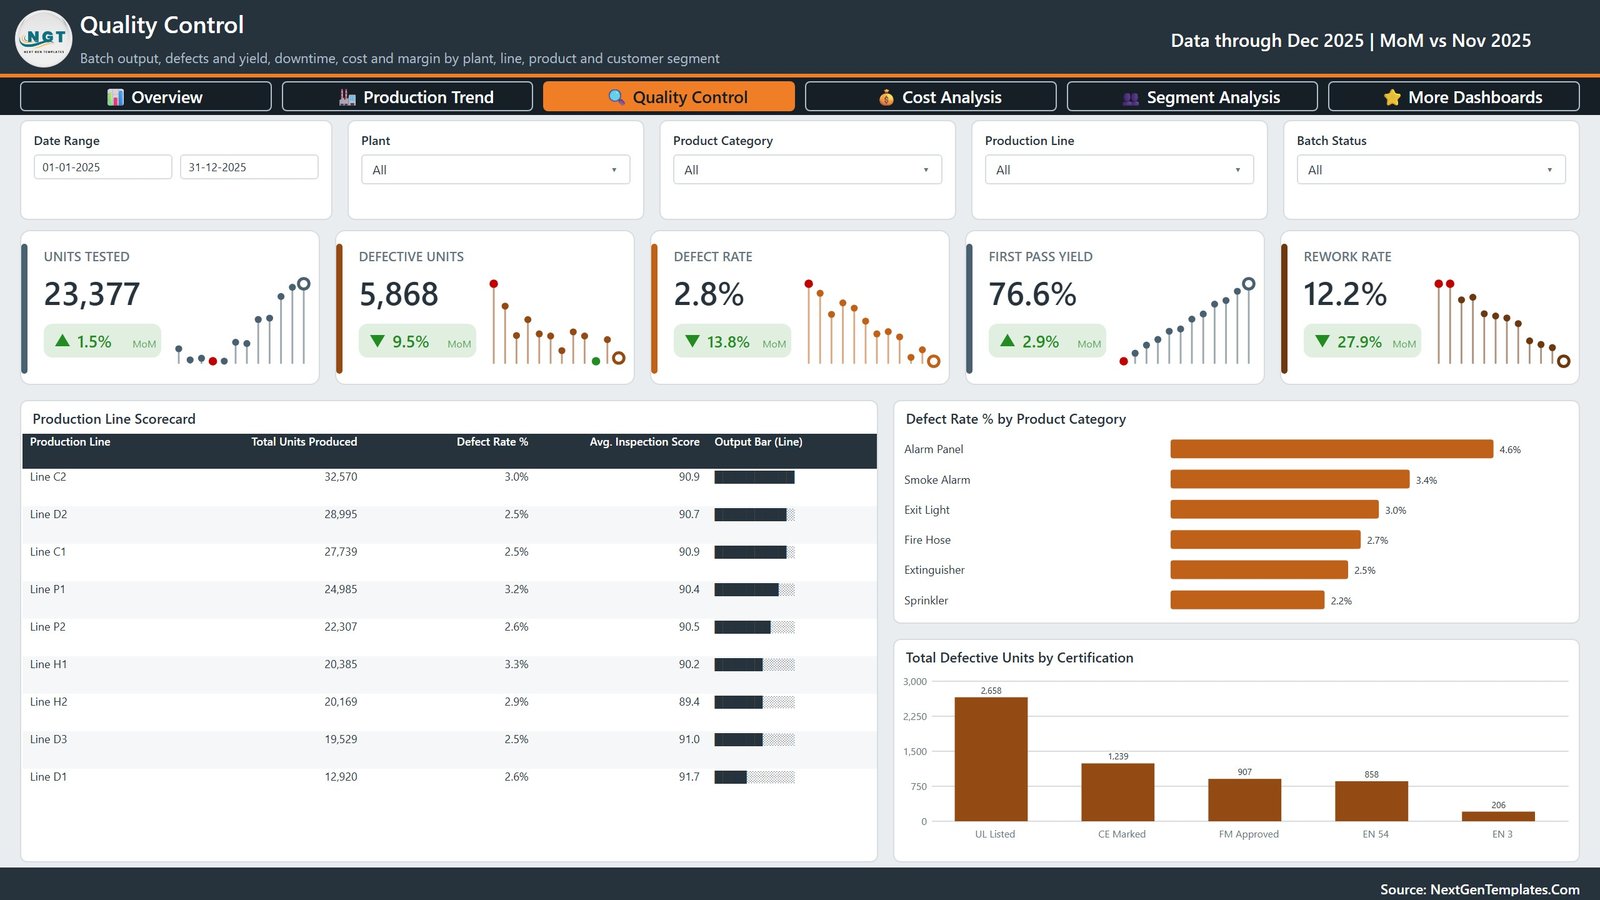
Review units tested, defective units, defect rate, first-pass yield and rework rate. A production-line scorecard, product-category defect-rate chart and certification breakdown support quality discussions without claiming regulatory approval.
Cost Analysis
Bring production cost, gross profit, margin, unit cost and average batch value together. Compare material and labor cost by quarter and examine plant-level sales and profitability.

Segment Analysis
Compare sales, revenue per unit, average batch value, units and margin across Commercial, Industrial, Distributor, Government and Residential sample segments. The page also analyzes units by the certification labels in the source data.

Fire Safety Equipment Manufacturing Dashboard in Power BI vs. Excel vs. Paid MES/SaaS – Where This Fits
| Area | This Power BI template | Excel dashboard | Paid MES/SaaS |
|---|---|---|---|
| Template cost | One-time $17.99 sale price | Usually a one-time workbook purchase | Often subscription and implementation fees |
| Platform | Power BI Desktop | Microsoft Excel | Vendor-specific web platform |
| Best use | Interactive multi-page analysis | Local spreadsheet reporting | Operational workflow and system integration |
| Data collection | Uses data you connect or replace | Usually manual or imported tables | May integrate with ERP, machines or shop-floor systems |
| Compliance evidence | No | No | Depends on the configured system and controls |
| Customization | Edit report pages, model and measures in Desktop | Edit sheets, formulas and charts | Depends on contract and permissions |
| Year-1 cost at 5 users | $17.99 for the template plus any Microsoft licensing | Template plus Microsoft 365 licensing | Varies widely by vendor and deployment |
Who This Template Is For – and Who It’s Not For
Good fit: fire-extinguisher, alarm-panel, sprinkler, fire-hose, smoke-alarm or exit-light manufacturers; plant managers; production supervisors; quality teams; finance analysts; and Power BI developers who already have structured batch records.
Not a fit: teams seeking an ERP, MRP, MES, live machine connection, inspection-certificate generator, maintenance system, inventory workflow or legal/compliance assurance. The certification fields are reporting labels from your source data; the dashboard does not validate UL, CE, FM, EN or any other standard.
How to Use the Fire Safety Equipment Manufacturing Dashboard in Power BI
- Download and extract the ZIP file.
- Open the PBIX in Power BI Desktop.
- Review the included sample workbook and map your own batch data to the same field structure.
- Update the data-source path in Power Query if required, then refresh.
- Check measures and category mappings against your own definitions.
- Use the page slicers to review plants, products, lines, segments and time periods.
- Customize branding and visuals, then publish to Power BI Service only if your organization has the appropriate Microsoft license and sharing permissions.
Real-World Use Cases
A plant manager can compare output and downtime across Dallas, Columbus, Phoenix and Charlotte-style plant records. A quality lead can review defect and rework patterns by line and product category. A finance analyst can place cost per unit, quarterly labor/material cost and margin beside production volume. These are reporting examples; users must define and validate their own measures.
Frequently Asked Questions
What files are included?
An editable PBIX file, an Excel sample-data workbook and a Power BI dashboard user manual PDF inside one ZIP.
Do I need Power BI Desktop?
Yes. Use Microsoft Power BI Desktop to open and edit the PBIX report.
Can I replace the sample data?
Yes. Keep compatible fields or adjust Power Query and the model to match your own structured source.
Does this dashboard certify fire-safety equipment?
No. It is a reporting template and does not test products, issue certificates or prove compliance.
Does it connect directly to machines or an ERP?
No direct integration is included. A Power BI developer can configure supported sources separately.
Can I change the visuals and colors?
Yes. The PBIX is editable in Power BI Desktop.
About the Author
Built by PK – Microsoft Certified Professional with 15+ years of Excel, Google Sheets, and Power BI experience. Founder of NextGenTemplates, reaching 300K+ subscribers across YouTube channels. Every template is hand-built and tested before release.
Explore Related Templates
- Contract Manufacturing Dashboard in Power BI
- Manufacturing Efficiency Dashboard in Power BI
- Footwear Manufacturing Dashboard in Power BI
- Browse Power BI templates
- Browse Power BI dashboards
Download the Fire Safety Equipment Manufacturing Dashboard in Power BI to start with a ready five-page reporting model instead of a blank PBIX. Replace the demo records, verify the measures for your business and use the report as an internal management view.
Last updated: September 16, 2026.






























Reviews
There are no reviews yet.