

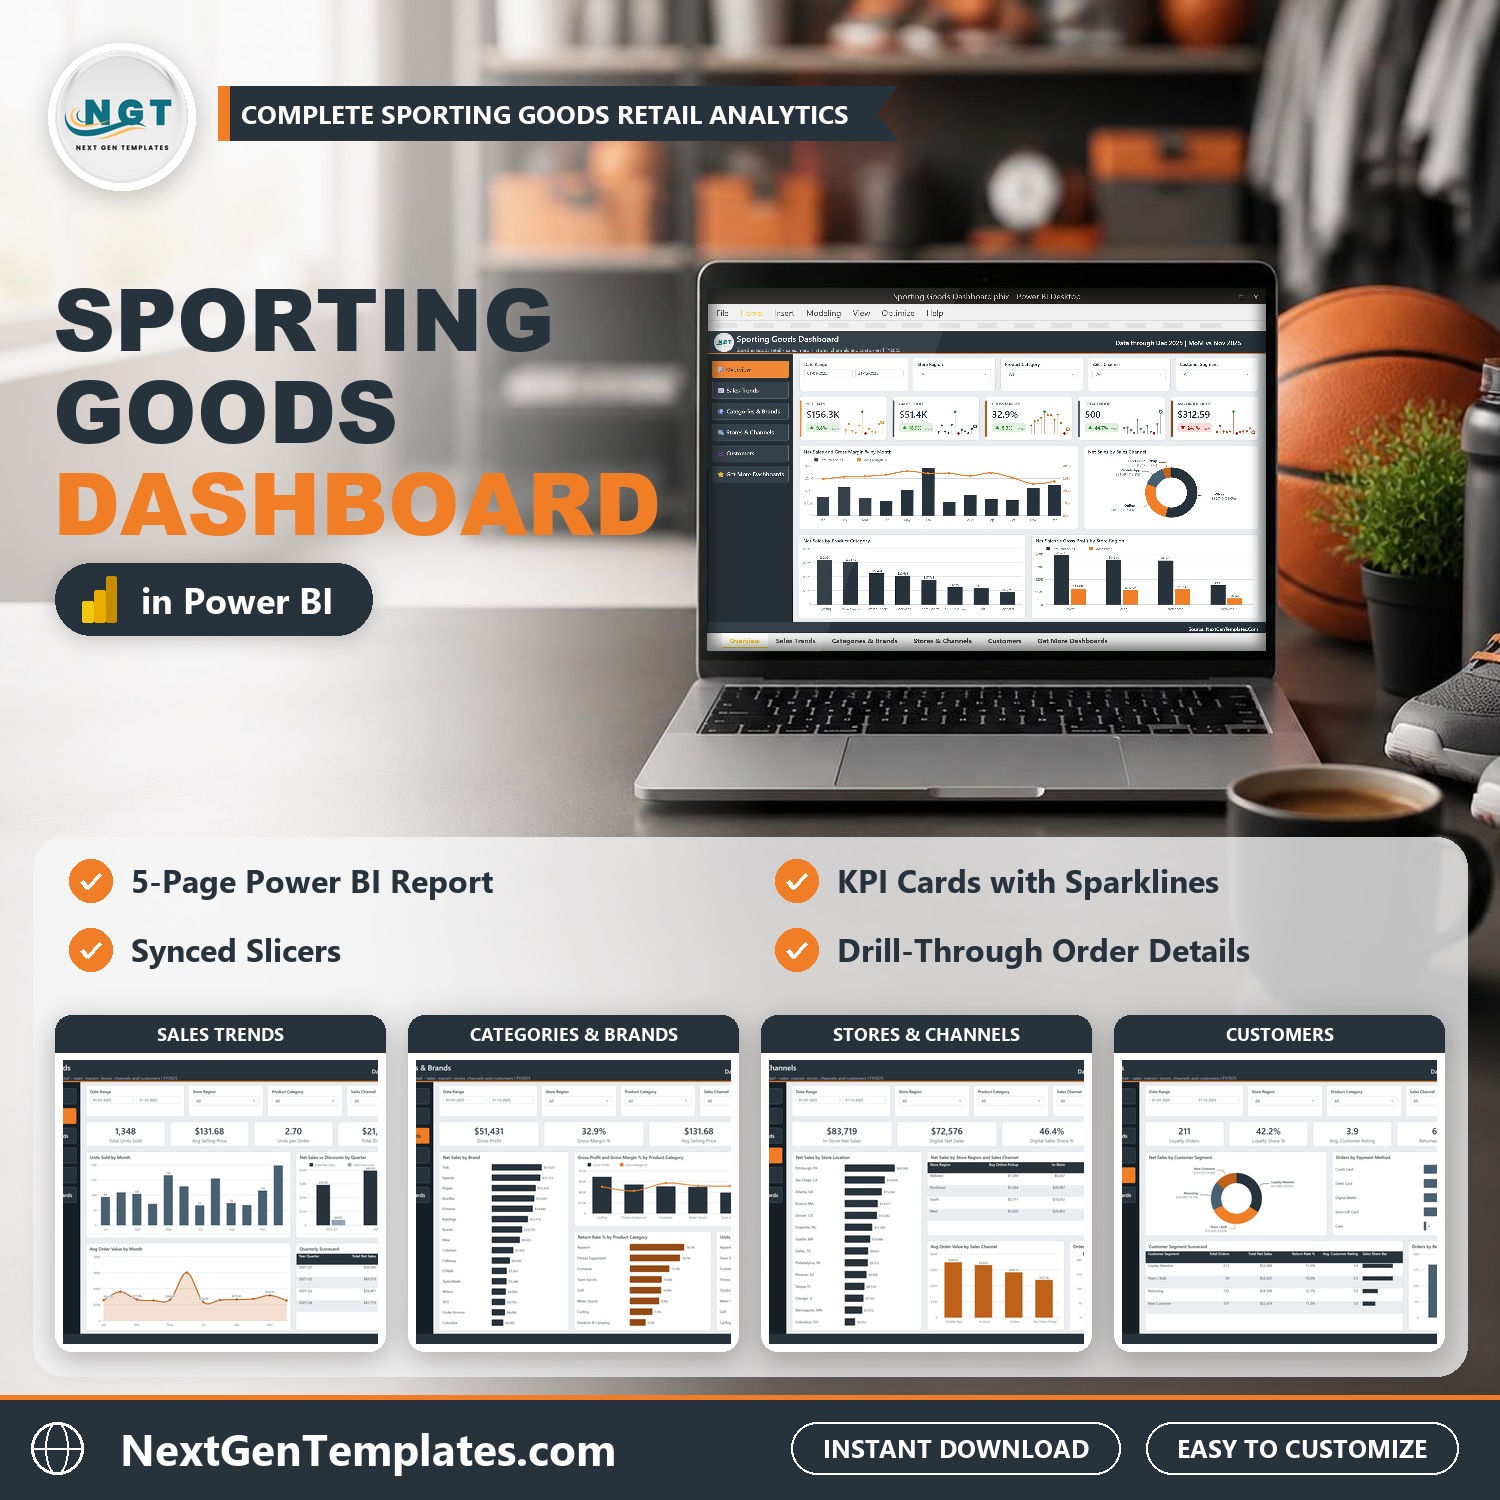
The Sporting Goods Dashboard in Power BI gives a sporting goods retailer one report for net sales, gross profit, margin, brands, stores, sales channels and customers. It is a ready-made Power BI dashboard template: open the .pbix file, use the slicers, and see which categories, stores and channels really make you money.
Watch the Sporting Goods Dashboard in Power BI walkthrough
The download includes the editable .pbix report, a Data.xlsx file with 500 sample orders for January to December 2025, and the Power BI dashboard user manual (PDF). The sample data is fictional, so you can learn the report first and then replace it with your own orders.
Key Features of the Sporting Goods Dashboard in Power BI
- Five analysis pages – Overview, Sales Trends, Categories & Brands, Stores & Channels and Customers, plus a Get More Dashboards page.
- KPI cards with month-over-month change – Net Sales, Gross Profit, Gross Margin, Total Orders and Avg Order Value, each with a green or red MoM badge and a monthly sparkline.
- Synced slicers – Date Range, Store Region, Product Category, Sales Channel and Customer Segment filter every chart, with Brand, Store Location and Payment Method slicers on the pages where they matter.
- Drill-through to order details – right-click any bar, choose Drill through > Details and see the individual orders behind it.
- Tooltip pages – hover a chart to see margin, orders and the channel mix for that point.
- Retail analytics in one place – a retail analytics dashboard that covers sales, discounts, returns, ratings and payment methods without extra setup.
- One theme file – the custom colour theme drives every visual, so you can recolour the report in one place.
Dashboard Pages
1. Overview
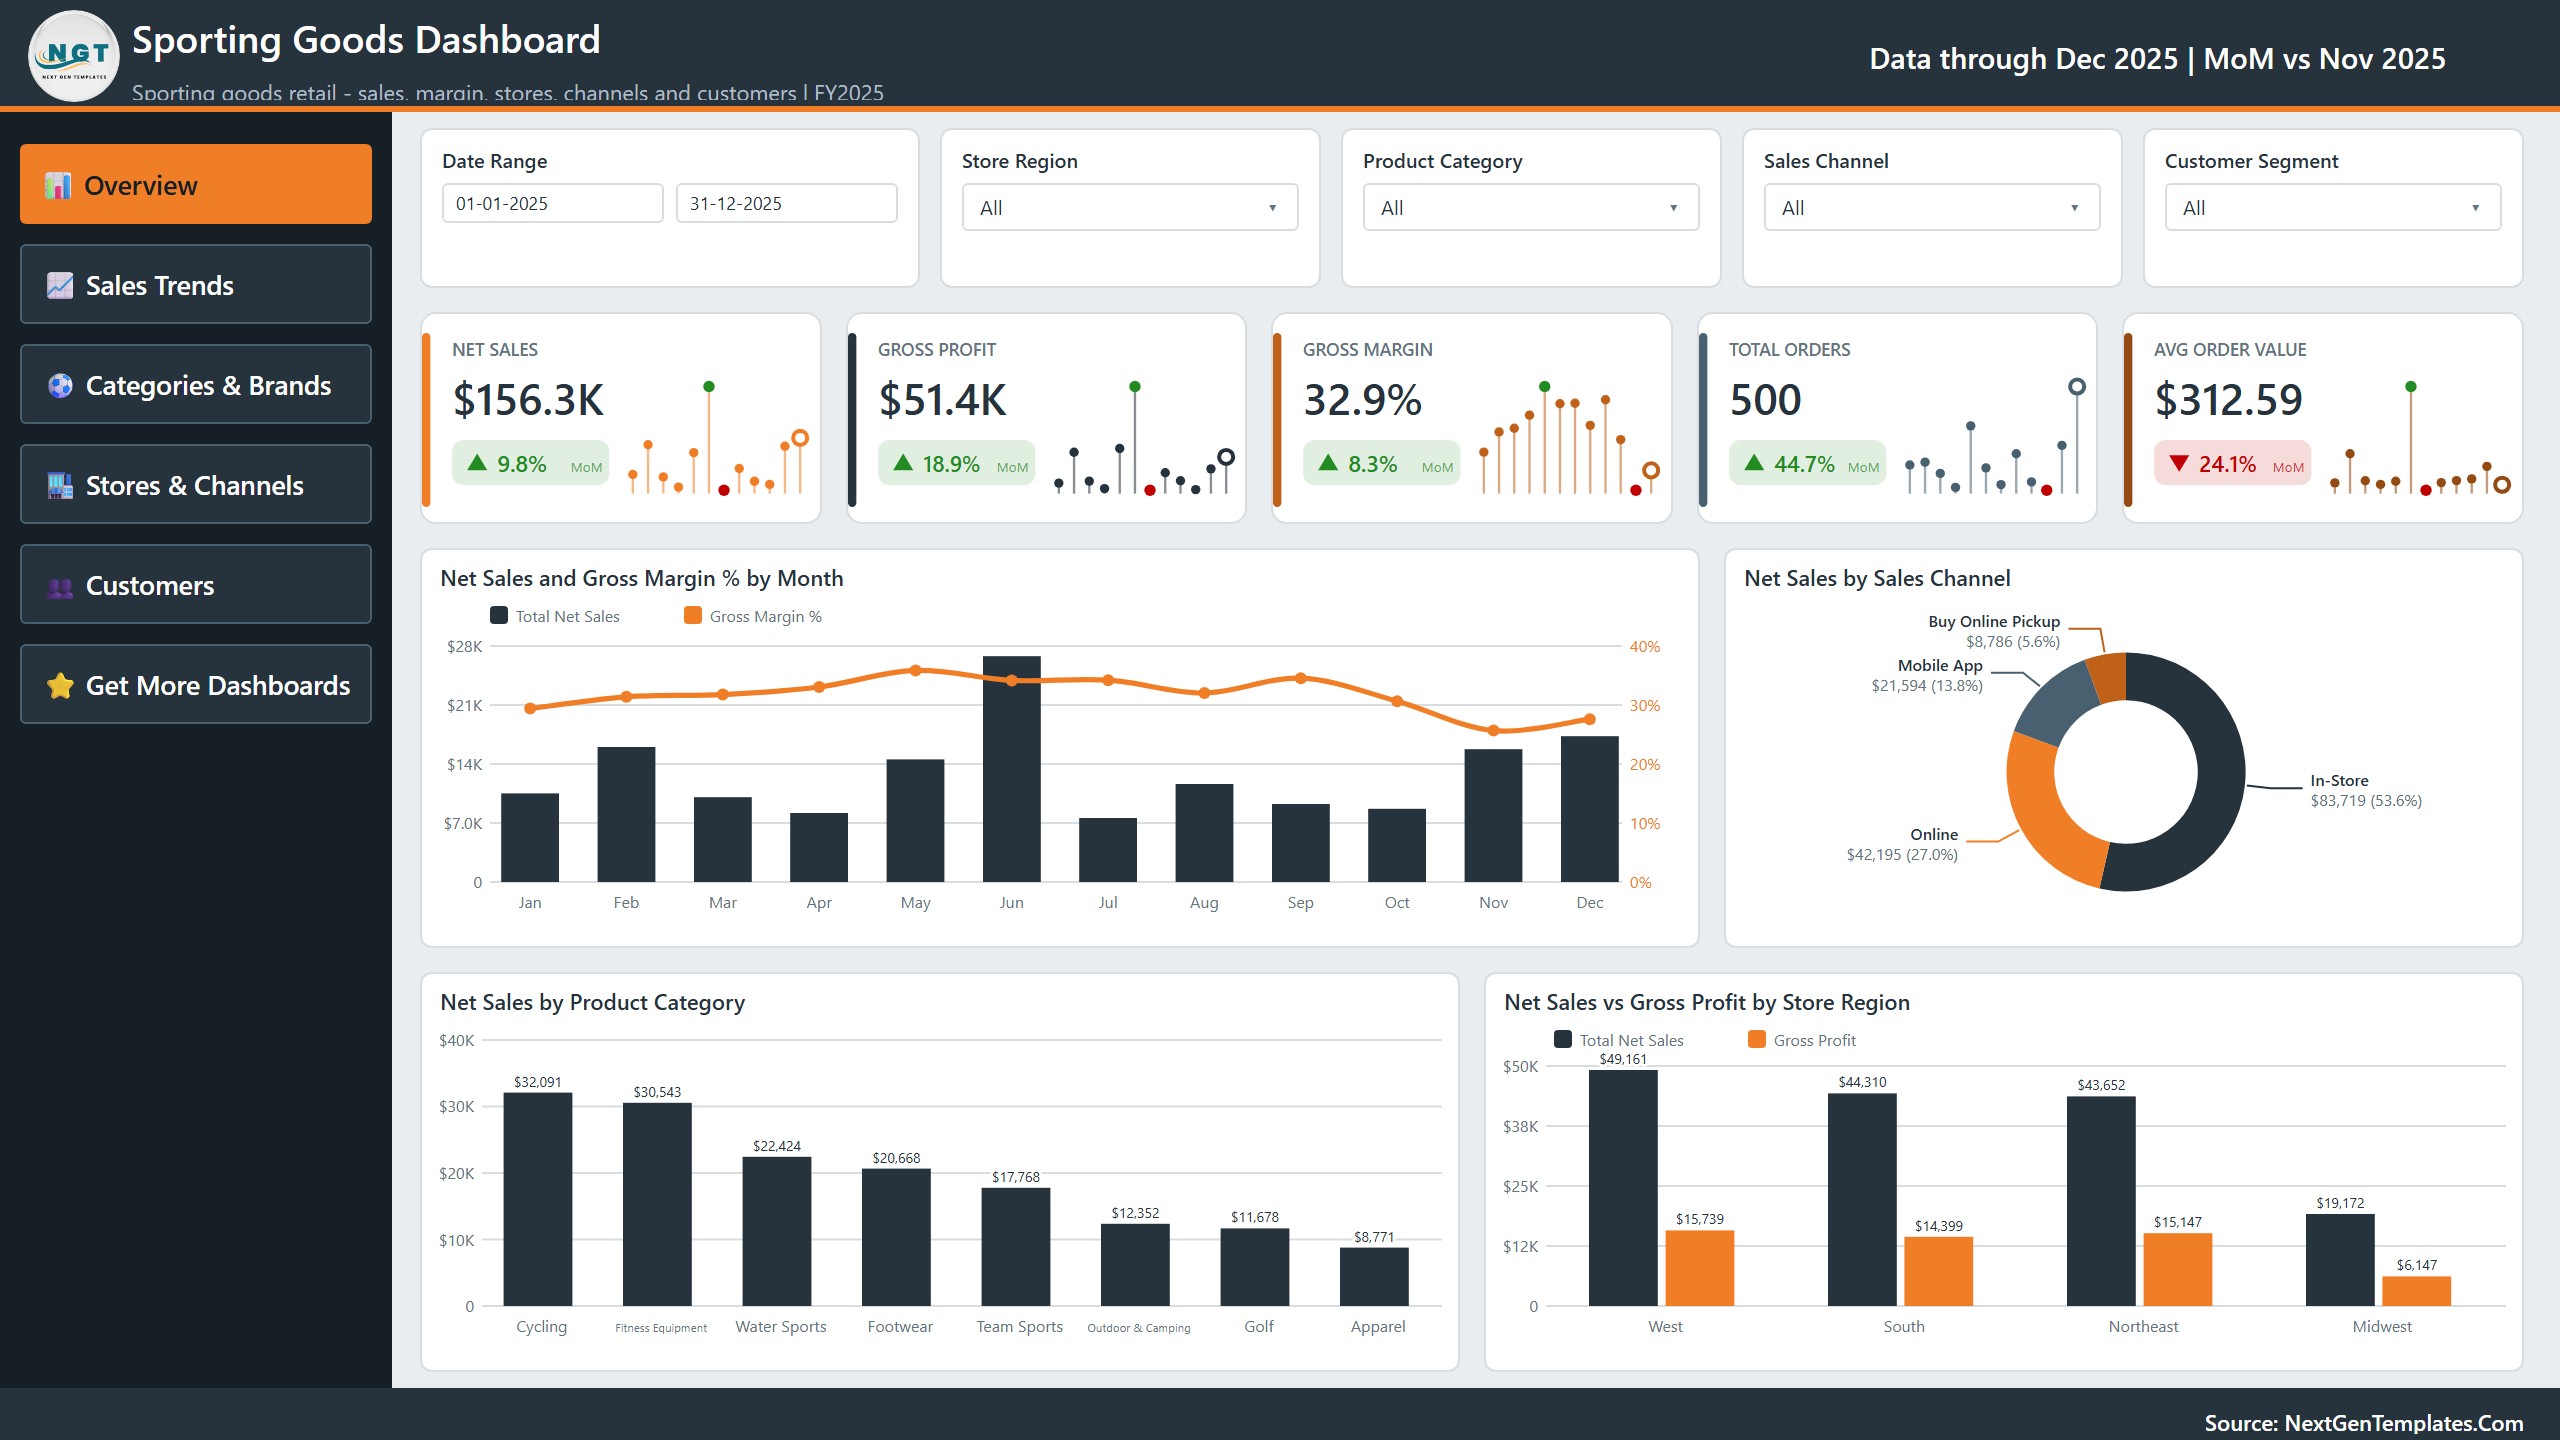
Five KPI cards sit at the top: Net Sales ($156.3K in the sample), Gross Profit, Gross Margin, Total Orders and Avg Order Value. Below them:
- Net Sales and Gross Margin % by Month – monthly net sales as columns with the margin line on a second axis, so a high-sales month with a weak margin stands out at once.
- Net Sales by Sales Channel – a donut that splits sales between In-Store, Online, Mobile App and Buy Online Pickup.
- Net Sales by Product Category – Cycling, Fitness Equipment, Water Sports, Footwear, Team Sports, Outdoor & Camping, Golf and Apparel ranked by sales.
- Net Sales vs Gross Profit by Store Region – West, South, Northeast and Midwest side by side, sales against profit.
2. Sales Trends
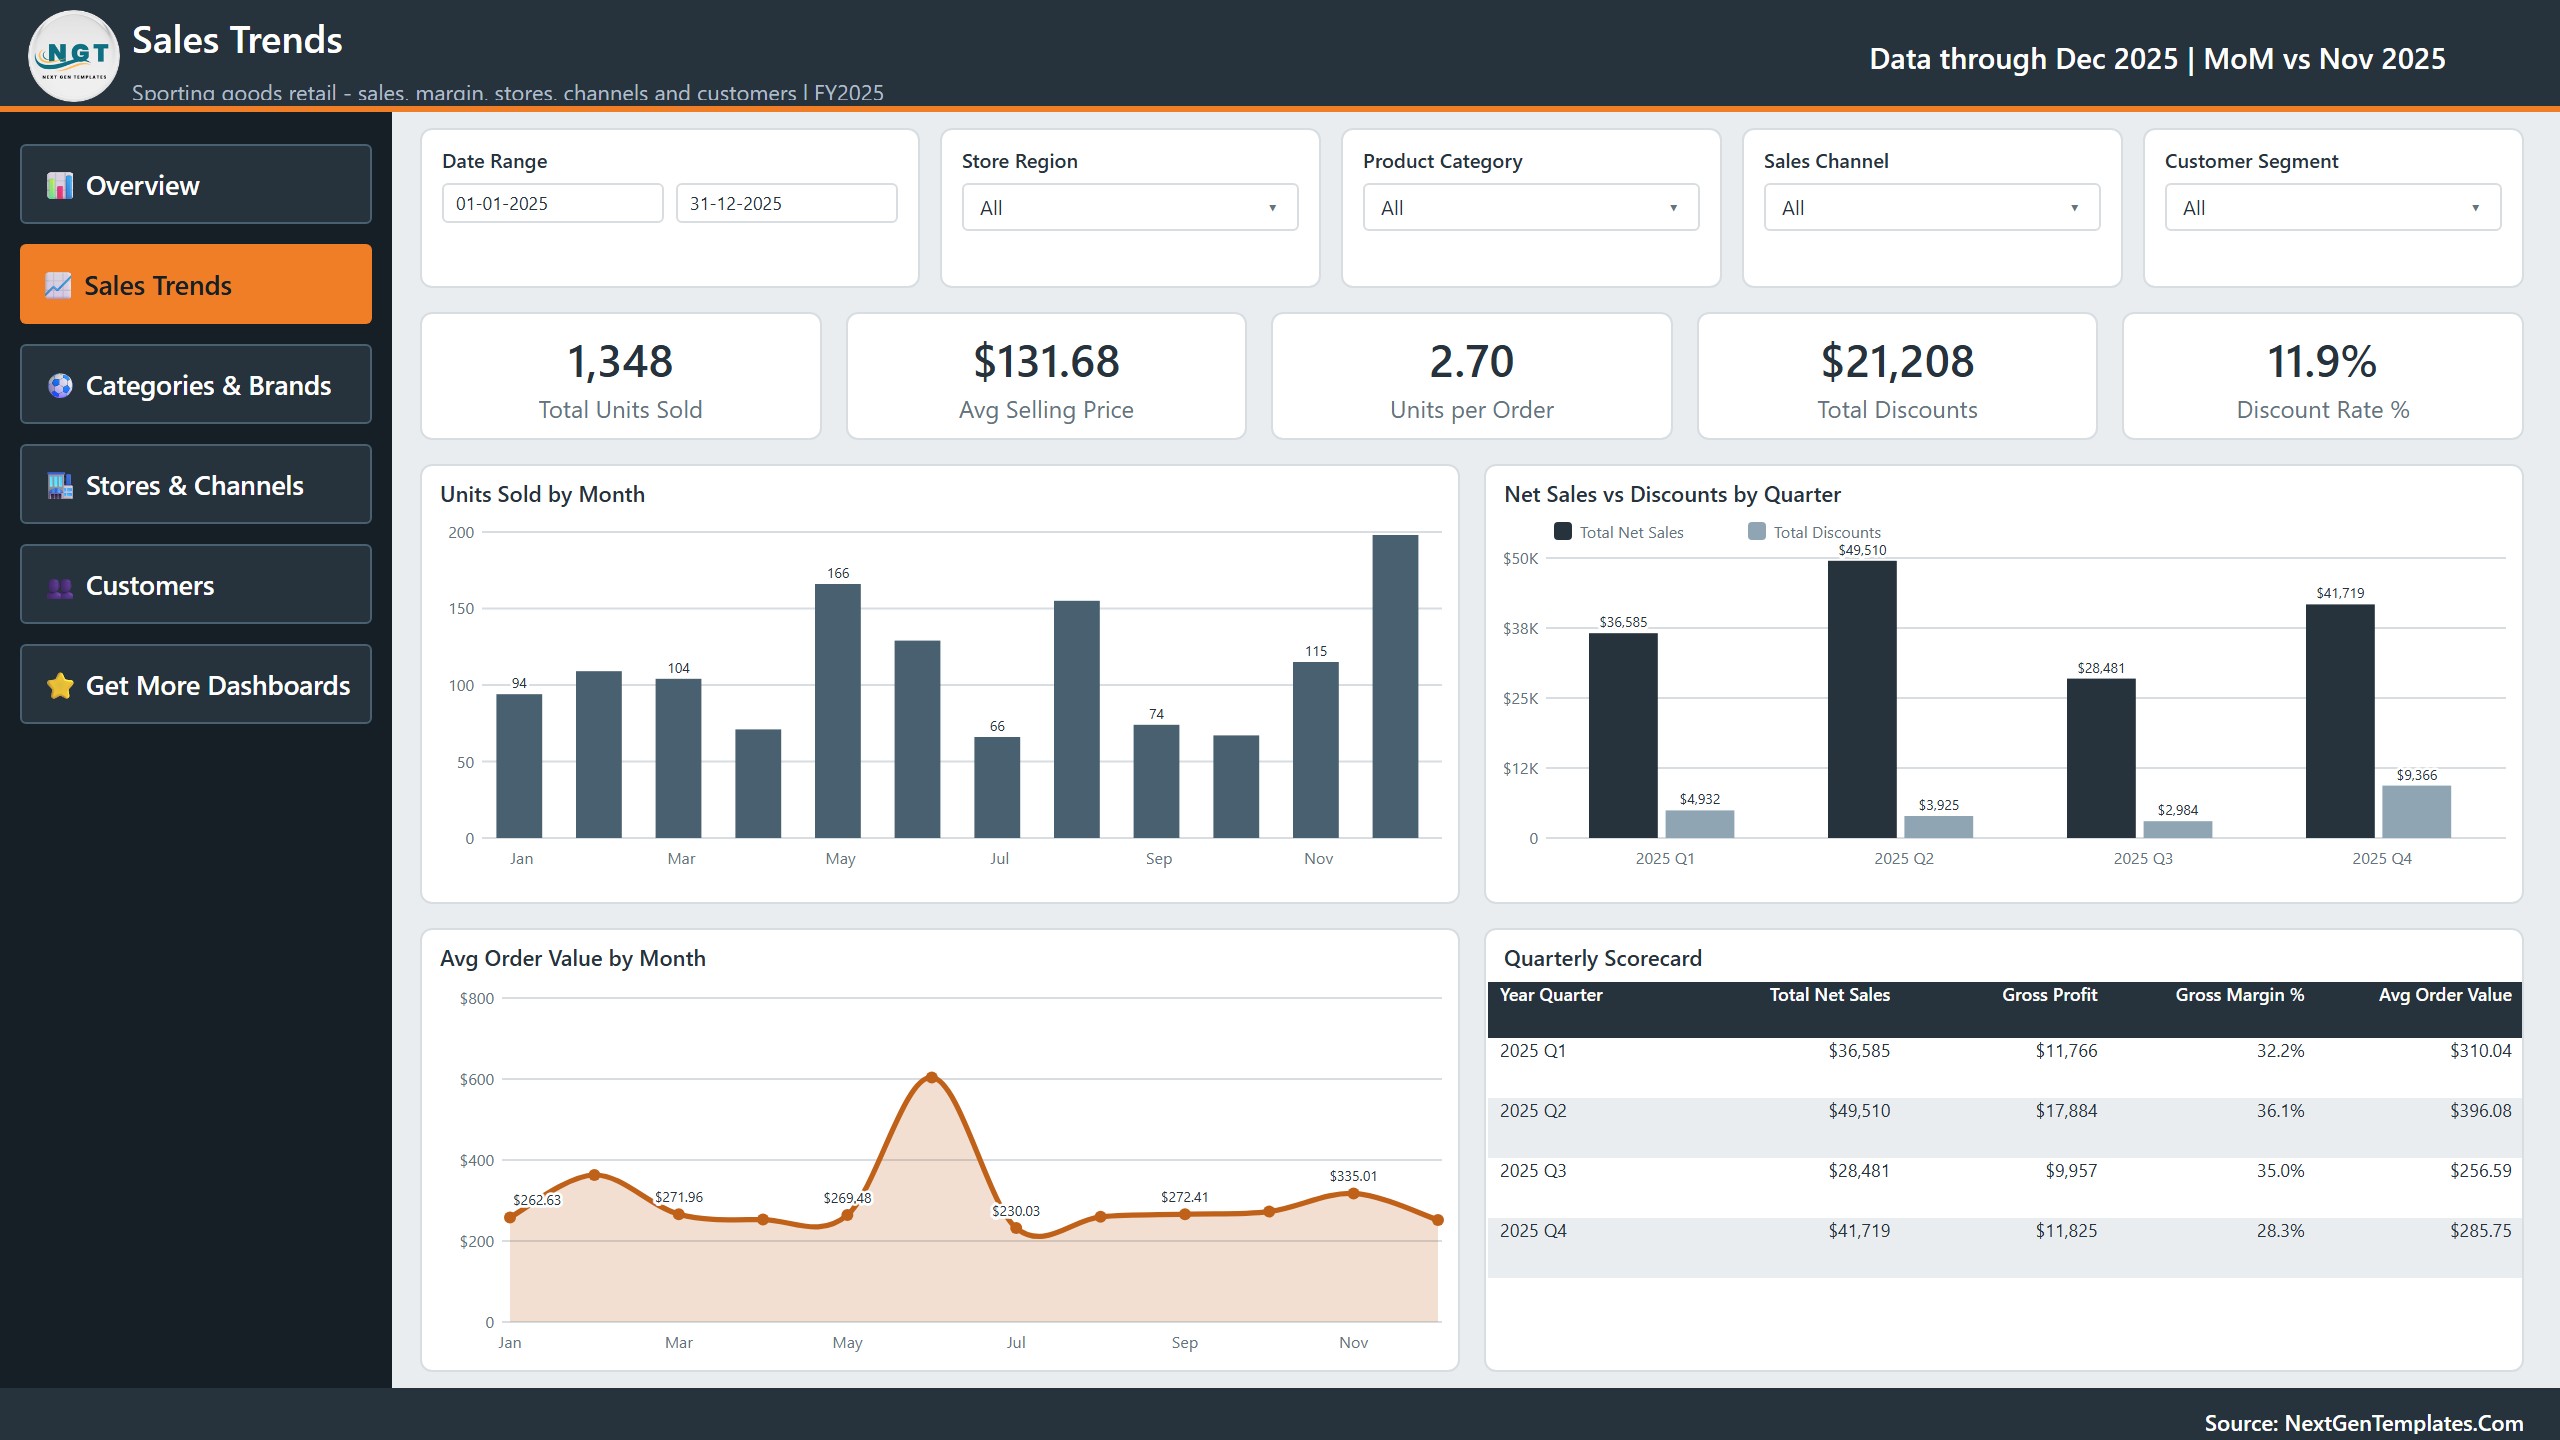
Cards for Total Units Sold, Avg Selling Price, Units per Order, Total Discounts and Discount Rate %. Charts:
- Units Sold by Month – the seasonal pattern of unit volume across the year.
- Net Sales vs Discounts by Quarter – shows how much of each quarter’s sales was given away as discounts.
- Avg Order Value by Month – spots the months when customers bought bigger baskets.
- Quarterly Scorecard – a table with Net Sales, Gross Profit, Gross Margin % and Avg Order Value for each quarter.
3. Categories & Brands

Cards for Gross Profit, Gross Margin %, Avg Selling Price and Return Rate %. Charts:
- Net Sales by Brand – 16 brands ranked, from Trek and Speedo down to Columbia.
- Gross Profit and Gross Margin % by Product Category – profit columns with the margin line, so a big category with a thin margin is easy to see.
- Return Rate % by Product Category – which categories come back most often.
- Units Sold by Product Category – volume next to value.
4. Stores & Channels

Cards for In-Store Net Sales, Digital Net Sales, Digital Sales Share % and Avg Order Value. Charts:
- Net Sales by Store Location – 15 US store cities ranked by sales.
- Net Sales by Store Region and Sales Channel – a matrix of region by channel with totals.
- Avg Order Value by Sales Channel – compares basket size across Mobile App, In-Store, Online and Buy Online Pickup.
- Orders and Return Rate % by Sales Channel – order counts with the return rate line.
5. Customers
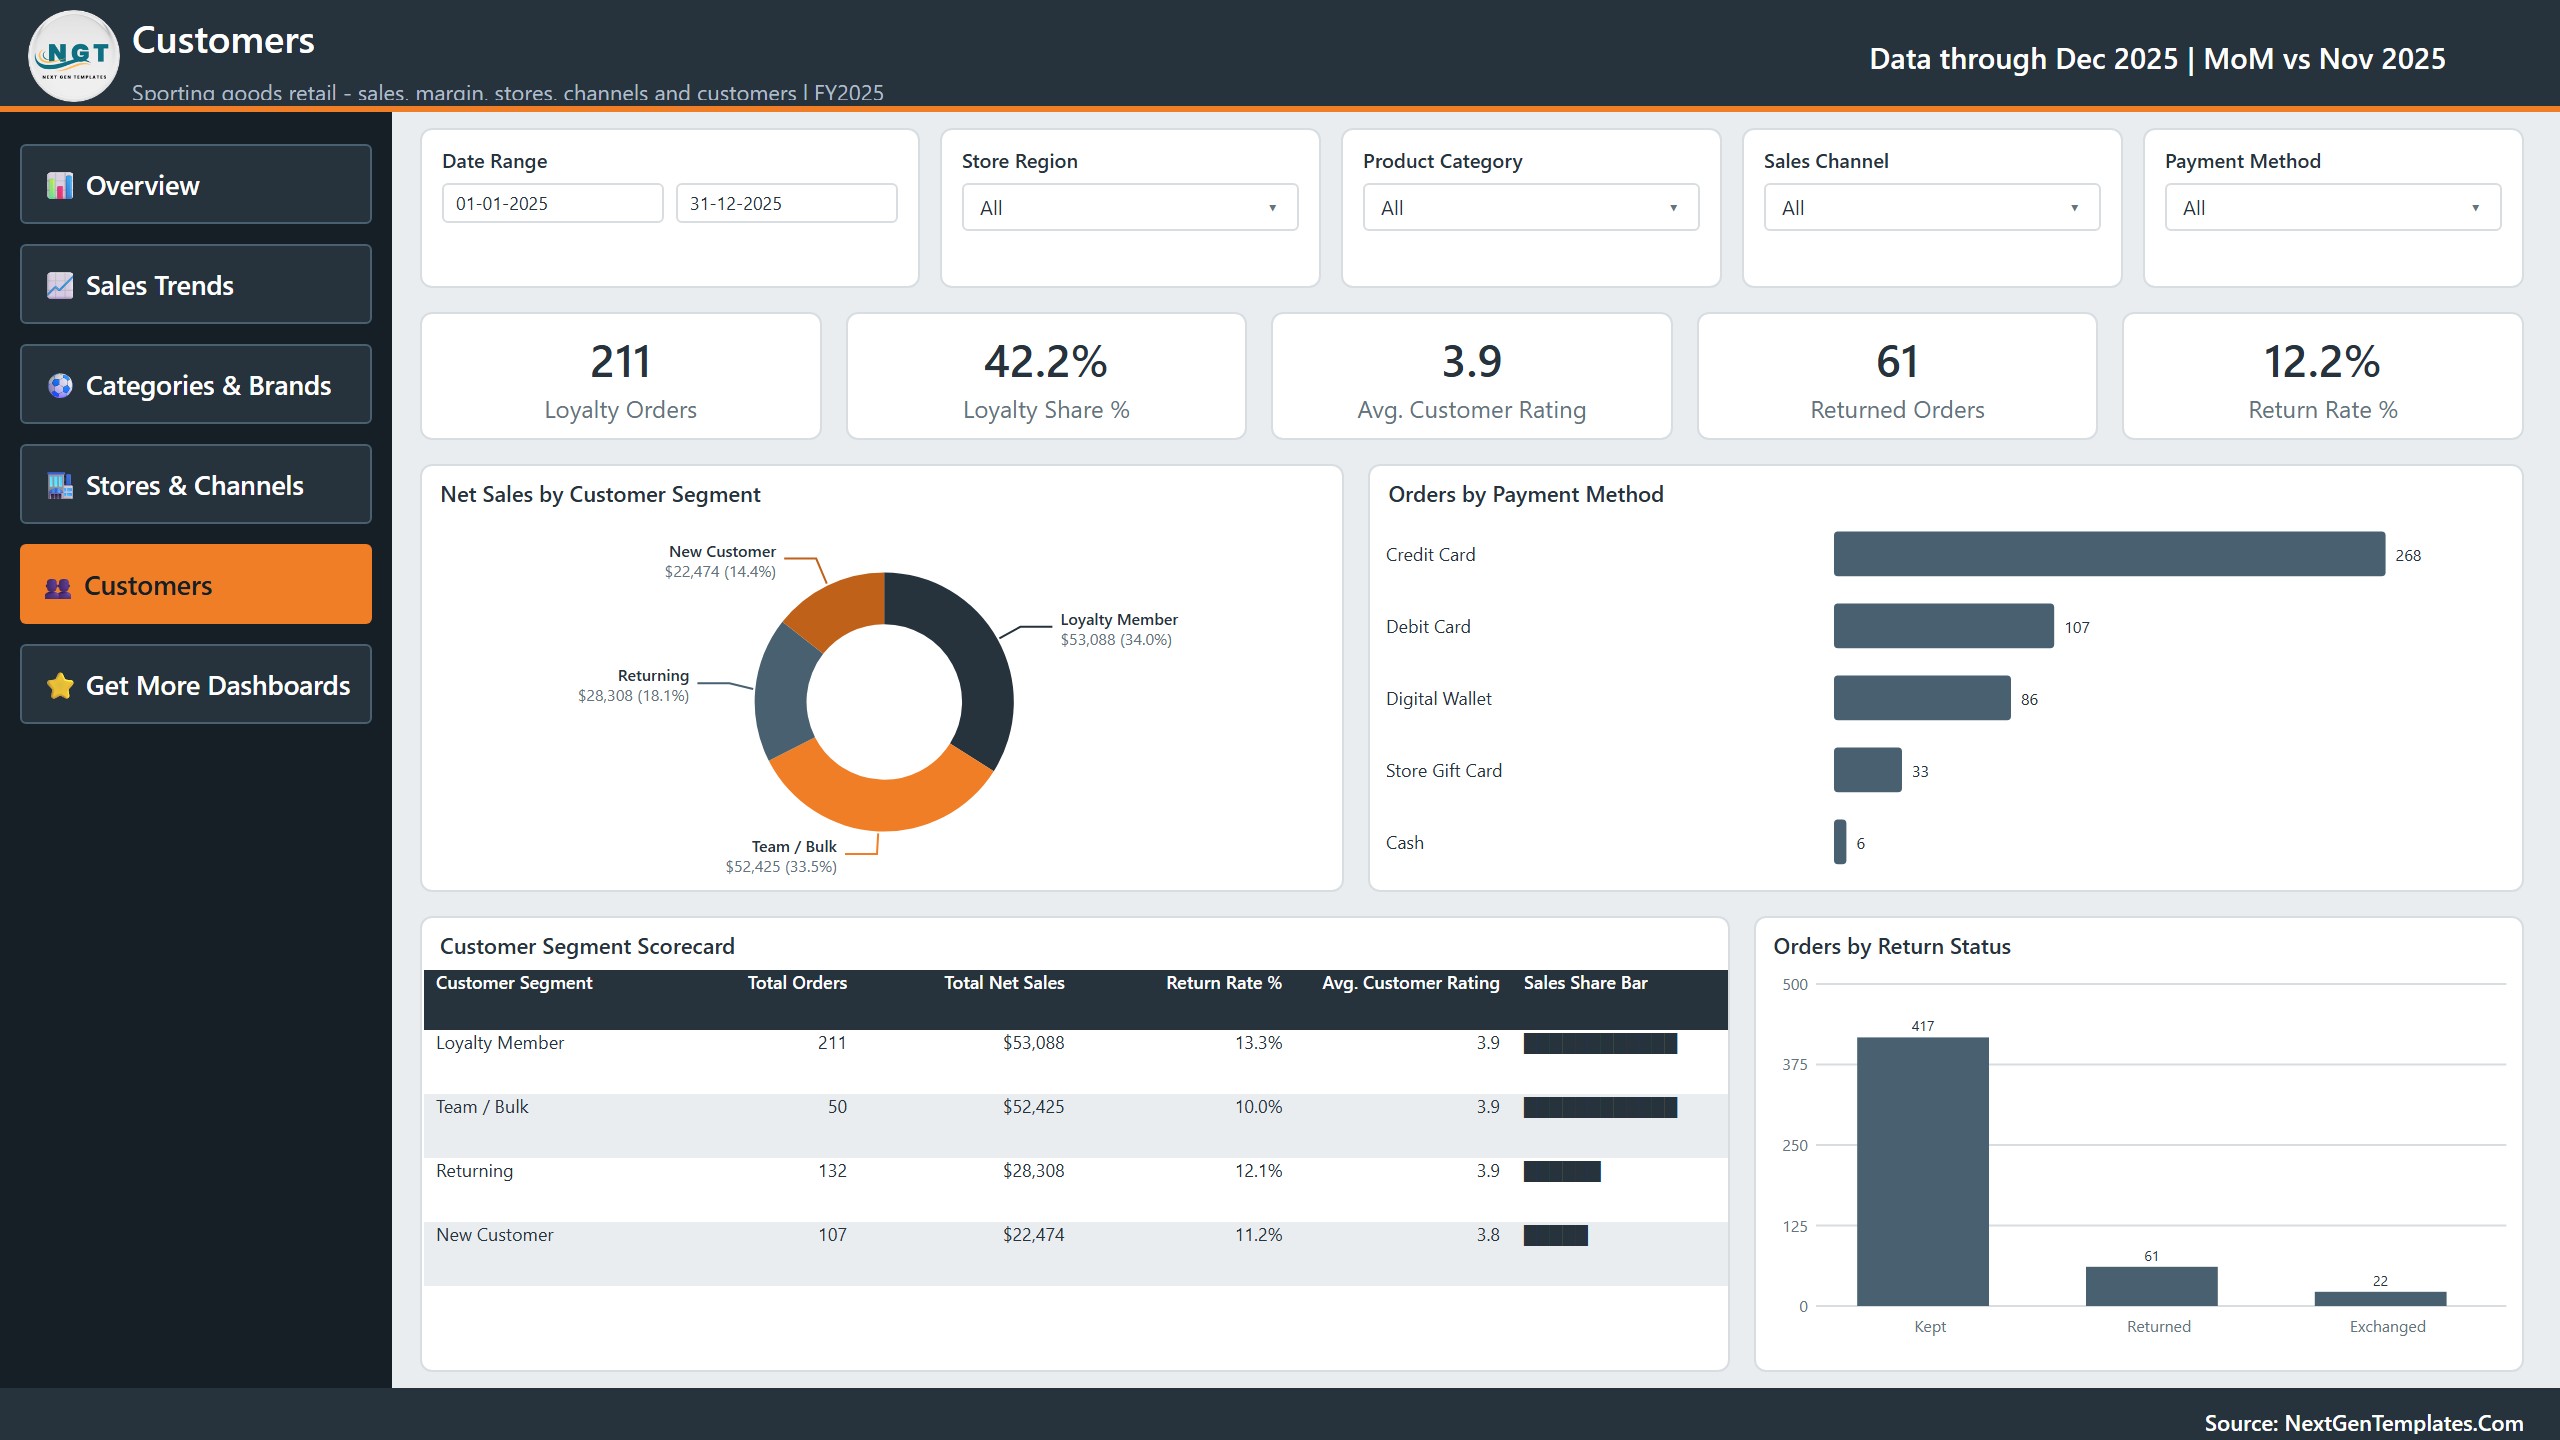
Cards for Loyalty Orders, Loyalty Share %, Avg. Customer Rating, Returned Orders and Return Rate %. Charts:
- Net Sales by Customer Segment – Loyalty Member, Team / Bulk, Returning and New Customer.
- Orders by Payment Method – Credit Card, Debit Card, Digital Wallet, Store Gift Card and Cash.
- Customer Segment Scorecard – orders, net sales, return rate, rating and a sales share bar per segment.
- Orders by Return Status – Kept, Returned and Exchanged.
Who Is This Power BI Retail Dashboard For?
- Owners and managers of sporting goods, outdoor, cycling, golf or fitness equipment stores.
- Retail analysts who need a power bi retail dashboard they can hand to a manager on day one.
- Multi-store chains that sell in store and online and want one view of every channel.
- Power BI learners who want a clean, real-world power bi sales dashboard to study.
How to Use It
- Download the ZIP and extract it to a folder on your PC.
- Open Sporting Goods Dashboard in Power BI.pbix in Power BI Desktop (free from Microsoft).
- Explore the sample data with the slicers and the left-side page buttons.
- To use your own data, paste your orders into Data.xlsx with the same 17 column headers (Order ID, Order Date, Store Region, Store Location, Sales Channel, Product Category, Brand, Customer Segment, Payment Method, Units Sold, Unit Price, Gross Sales, Discount Amount, Net Sales, Cost of Goods, Return Status, Customer Rating).
- Click Home > Refresh. If Power BI asks where the file is, point it to your Data.xlsx in Transform data > Data source settings.
Comparison: This Template vs Building From Scratch
| Feature | Sporting Goods Dashboard in Power BI | Building it yourself |
|---|---|---|
| Report pages | 5 analysis pages + Get More Dashboards page | Designed one by one |
| KPI cards | MoM badges and sparklines ready | DAX and SVG measures to write |
| Slicers | Synced across pages | Sync settings set by hand |
| Drill-through | Details page included | Build and wire it yourself |
| Tooltips | Custom tooltip pages | Default tooltips only |
| Sample data | 500 orders, 17 columns | Find or create test data |
| Theme | One custom theme file | Format every visual |
| Time to first report | Minutes | Days |
Frequently Asked Questions
Do I need Power BI Pro?
No. The .pbix opens in the free Power BI Desktop. You only need a Pro or Premium licence if you want to publish and share it in the Power BI Service.
Can I use my own sales data?
Yes. Replace the rows in Data.xlsx with your orders using the same column headers, then click Refresh.
Is the sample data real?
No. The 500 orders are fictional sample records for 2025, made for learning and demonstration.
Can I change the colours or add pages?
Yes. The report is fully editable. The custom theme controls the colours of every visual.
Does it work on Mac?
Power BI Desktop runs on Windows. On a Mac you can use a Windows virtual machine, or publish the report to the Power BI Service and view it in a browser.
Is this the same as the Sporting Goods KPI Dashboard?
No. This is the full analytical dashboard with five pages of charts. The Sporting Goods KPI Dashboard in Power BI is a separate product focused on monthly KPI targets.
What You Receive
- Sporting Goods Dashboard in Power BI.pbix (editable)
- Data.xlsx with 500 sample orders
- Power BI Dashboard user manual (PDF)
- Instant ZIP download
Related Templates
Looking for more? See the Sporting Goods KPI Dashboard in Power BI, the Sporting Goods KPI Dashboard in Excel, the Fitness Trackers & Wearables Dashboard in Power BI and the Footwear & Accessories Dashboard in Google Sheets, or browse every power bi dashboard template in the store.
Read the full walkthrough on our blog: Sporting Goods Dashboard in Power BI – page-by-page guide.
Get the Sporting Goods Dashboard in Power BI today and see which stores, brands and channels drive your profit.














Reviews
There are no reviews yet.