

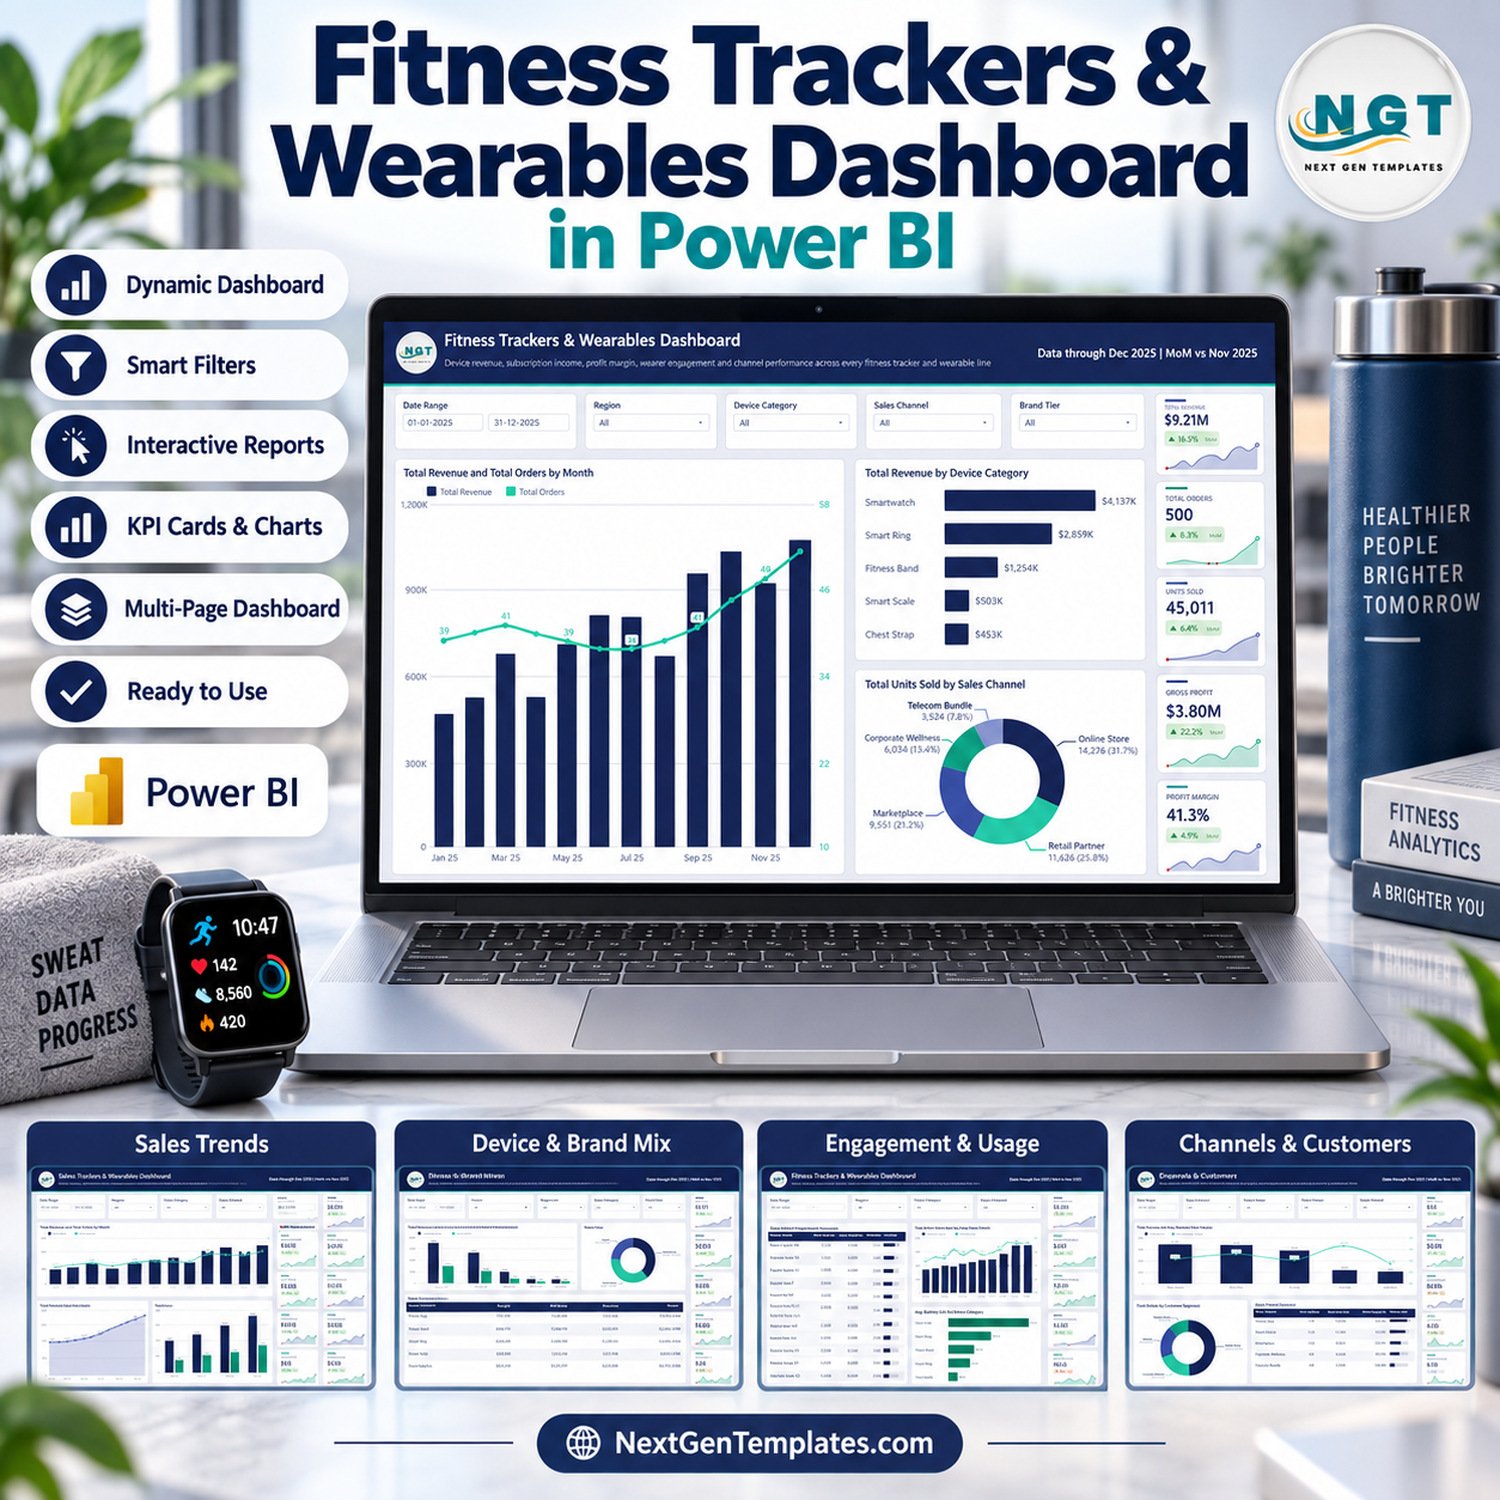
Fitness Trackers & Wearables Dashboard in Power BI turns sample commercial and device-usage records into five visible analytical pages for wearable technology reporting. The included demo view contains 500 orders, 45,011 units sold, and $9.21M in revenue, clearly presented as sample data rather than promised business results. Buyers can inspect every page screenshot before purchase, download the PBIX plus Data.xlsx and the user manual, and work without a recurring template subscription. Built by a Microsoft Certified Professional whose channels reach 300K+ subscribers, this report is designed for descriptive business analysis—not medical diagnosis, treatment, coaching, or personal health advice.
Key Features of Fitness Trackers & Wearables Dashboard in Power BI
- Five visible report pages: Overview, Sales Trends, Device & Brand Mix, Engagement & Usage, and Channels & Customers.
- Filters for date range, region, device category, sales channel, brand tier, customer segment, and subscription plan where relevant.
- Commercial KPIs for revenue, orders, units sold, gross profit, profit margin, device revenue, subscription income, average order value, fulfillment, returns, and warranty claims.
- Descriptive engagement fields for active users, average daily steps, average sleep hours, sync sessions, and battery life.
- Comparisons across smartwatch, smart ring, fitness band, smart scale, and chest strap categories.
- Views by month, quarter, device model, brand tier, region, customer segment, and channel.
- A hidden Details page plus two tooltip pages support report interactions without crowding the main navigation.
- PBIX, Data.xlsx, and a Power BI Dashboard user manual are included in the customer ZIP.
The report is a wearable analytics dashboard, a Power BI fitness dashboard, a fitness device sales dashboard, and a wearable technology dashboard for business reporting. Those phrases describe its analytical scope; they do not imply medical validation.
What’s Inside the Fitness Trackers & Wearables Dashboard in Power BI
Overview
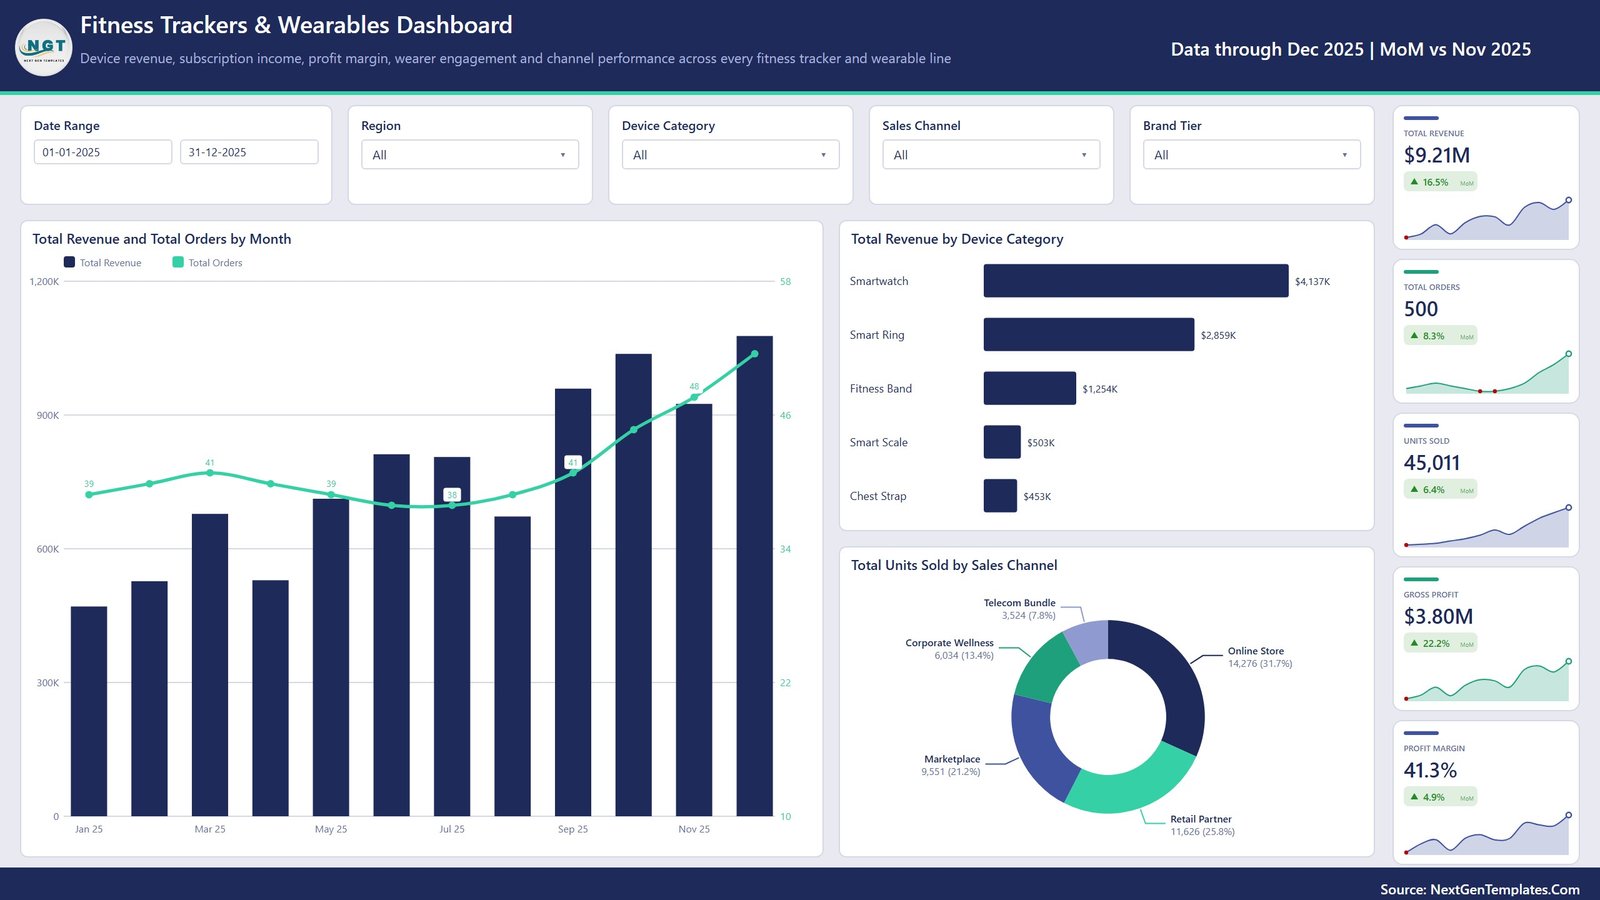
The Overview combines monthly revenue and order movement with revenue by device category and units sold by sales channel. KPI cards summarize total revenue, total orders, units sold, gross profit, and profit margin.
Sales Trends
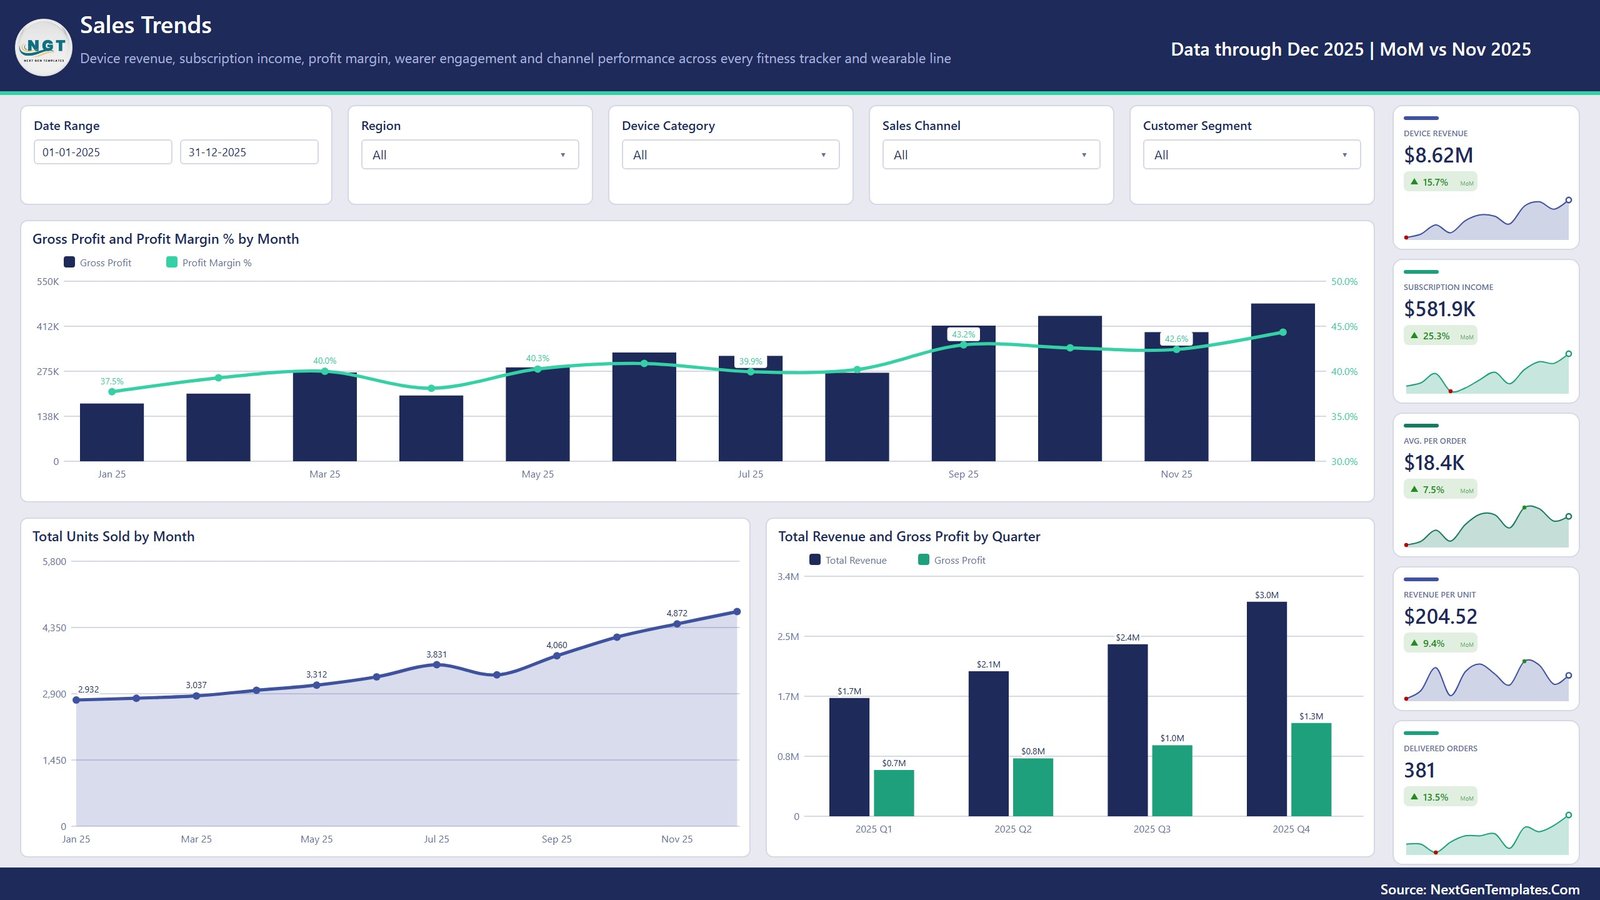
Sales Trends compares gross profit with profit margin by month, units sold by month, and revenue with gross profit by quarter. Supporting cards cover device revenue, subscription income, average revenue per order, revenue per unit, and delivered orders.
Device & Brand Mix
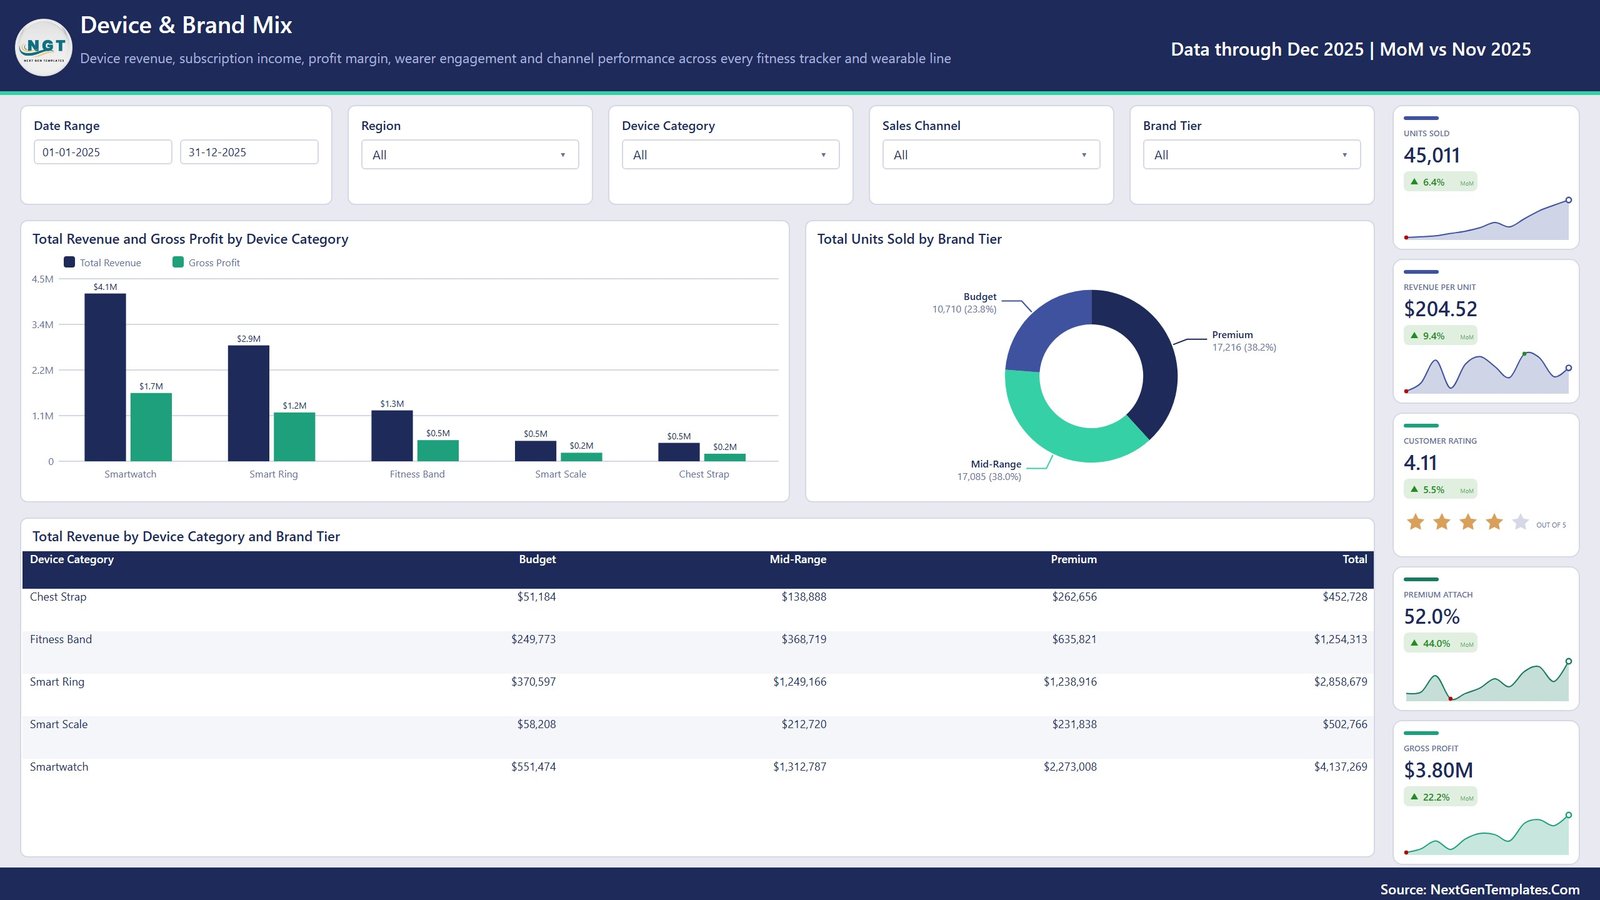
This page compares revenue and gross profit by device category, units by brand tier, and a revenue matrix across Budget, Mid-Range, and Premium tiers. The displayed customer rating is a sample-data field, not a health score.
Engagement & Usage
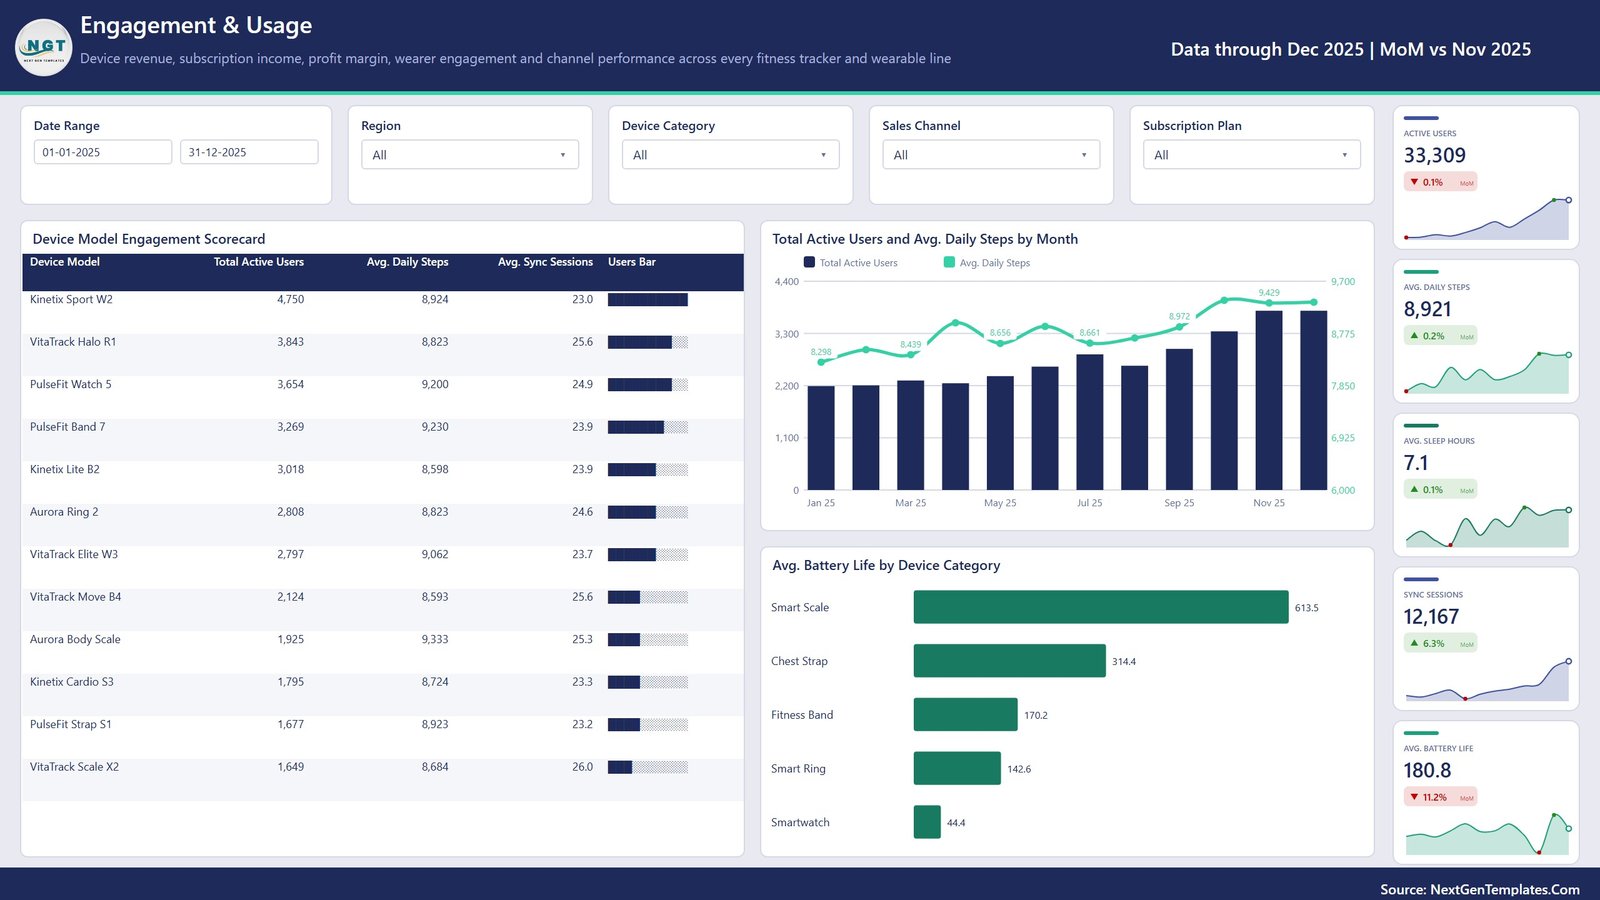
Engagement & Usage presents a device-model scorecard, active users and average daily steps by month, and average battery life by device category. These are descriptive fields from the supplied dataset and are not clinical measurements.
Channels & Customers
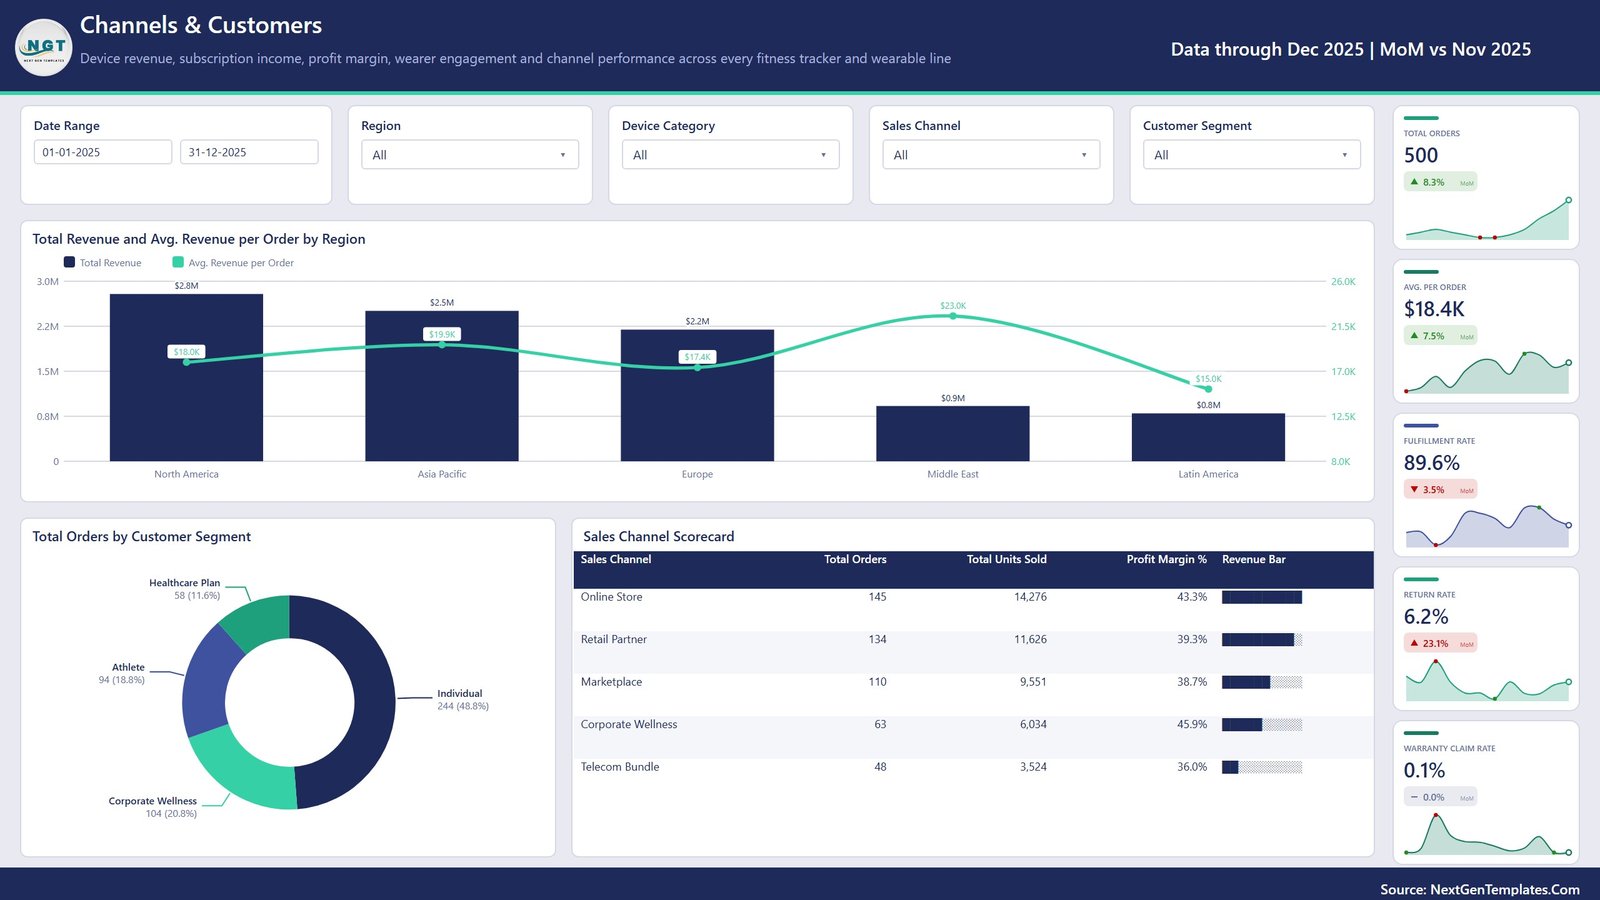
This page compares revenue and average order value by region, orders by customer segment, and channel results for orders, units, margin, fulfillment, returns, and warranty claims.
Fitness Trackers & Wearables Dashboard in Power BI vs. Tableau vs. Paid Analytics SaaS – Where This Fits
| Need | This Power BI template | Tableau alternative | Paid analytics SaaS |
|---|---|---|---|
| Cost | One-time template price | Requires a separate build and licensing decision | Usually monthly or annual |
| Platform | Power BI Desktop PBIX | Tableau workbook | Browser-based vendor platform |
| Setup | Review fields, replace sample data, refresh | Rebuild or map the analysis | Configure connectors and accounts |
| Collaboration | Desktop file; sharing may require Power BI Service | Often depends on Tableau Cloud or Server | Usually included by subscription tier |
| Customization | Editable report and data model | Editable with Tableau skills | Varies by vendor and plan |
| Wearable focus | Sales, subscriptions, usage, devices, and channels | Requires a custom design | May prioritize operational integrations |
Who This Template Is For – and Who It’s Not For
This template fits wearable-device brands, fitness technology retailers, subscription teams, sales analysts, channel managers, and Power BI consultants who need a presentation-ready starting point. It is not a live device integration, ecommerce system, CRM, medical record, diagnostic tool, activity recommendation engine, or substitute for qualified medical guidance. It does not promise that changing a displayed metric will improve anyone’s health.
How to Use the Fitness Trackers & Wearables Dashboard in Power BI
- Download and unzip the customer package.
- Open the PBIX in Microsoft Power BI Desktop.
- Review the sample pages, filters, fields, and Data.xlsx structure.
- Map your own consistent business data to the expected columns.
- Refresh the model and validate totals against your source.
- Use the filters and visible pages for commercial reporting.
- Publish to Power BI Service only if your organization has the appropriate access and licensing.
Real-World Use Cases
Wearable brand analyst: Review device-category revenue, brand-tier mix, subscriptions, and unit movement before a monthly commercial meeting.
Retail channel manager: Compare online, retail partner, marketplace, corporate wellness, and telecom bundle performance.
Product operations lead: Monitor sample engagement and battery-life fields alongside returns and warranty claims without presenting them as medical outcomes.
Frequently Asked Questions
What files are included?
The ZIP contains the Power BI PBIX, Data.xlsx, and a Power BI Dashboard user manual.
How many report pages are included?
There are five visible analytical pages, one visible Get More Dashboards page, one hidden Details page, and two hidden tooltip pages.
Can I use my own data?
Yes. Review the supplied Data.xlsx structure, map your fields carefully, and validate the refreshed totals.
Does this connect directly to a smartwatch or fitness tracker?
No. The included report uses structured source data; it does not provide a live device API connection.
Is this a medical or wellness recommendation tool?
No. It describes business and sample engagement data only and is not medical advice or a clinical system.
Do I need Power BI Desktop?
Yes. Open and edit the PBIX in Microsoft Power BI Desktop.
About the Author
Built by PK – Microsoft Certified Professional with 15+ years of Excel, Google Sheets, and Power BI experience. Founder of NextGenTemplates, reaching 300K+ subscribers across YouTube channels. Every template is hand-built and tested before release.
Explore Related Templates
Compare the Smart Wearables KPI Dashboard in Power BI, Sports Team Dashboard in Power BI, and CrossFit Gym KPI Dashboard in Power BI. Browse the Power BI collection or the Power BI Dashboard category for more options.
Ready to organize wearable product reporting? Download the Fitness Trackers & Wearables Dashboard in Power BI and start with a tested five-page analytical layout.
Last updated: September 16, 2026.






























Reviews
There are no reviews yet.