

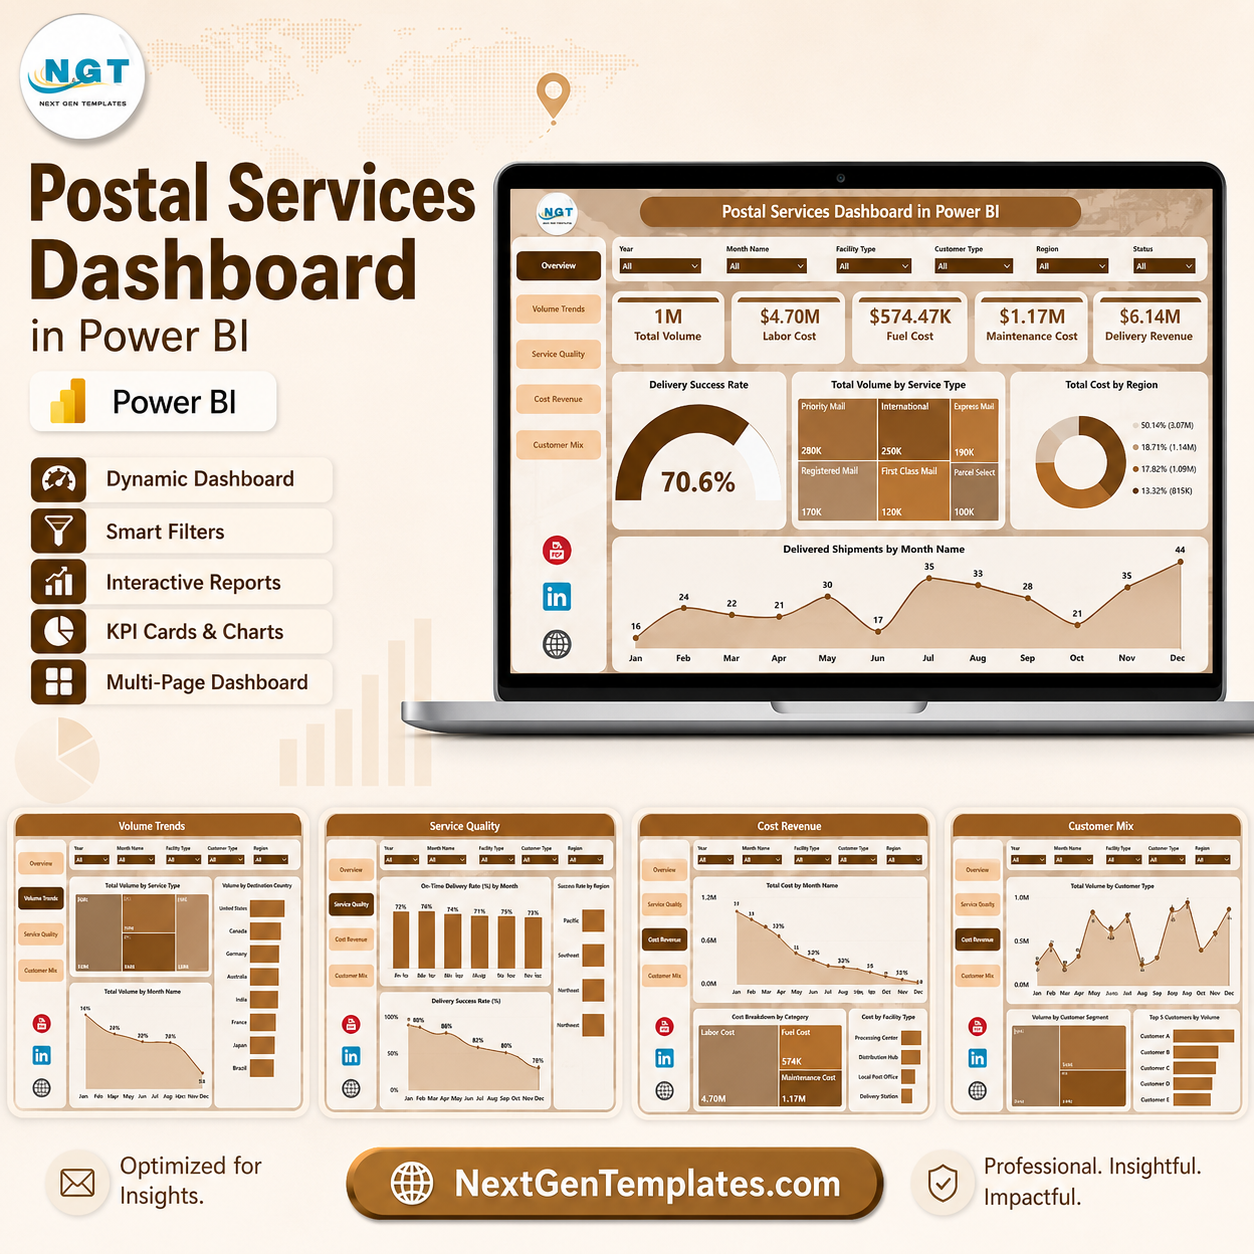

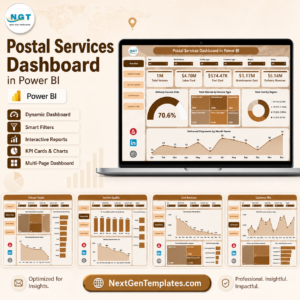
Postal Services Dashboard in Power BI helps postal operations, courier teams, and delivery managers review 5 report pages, 6 executive KPI cards, 16 chart views, and slicer-based filters from one ready-to-use .pbix file. Instead of chasing shipment volume, labor cost, fuel cost, maintenance cost, delivery revenue, and delivery success rate across separate reports, users can open the model in Power BI Desktop, connect or replace the sample data, refresh, and present a clean performance view. Join 8,400+ teams in 40+ countries using NextGenTemplates for one-time dashboard templates. Instant download, no subscription, lifetime access.
Key Features of Postal Services Dashboard in Power BI
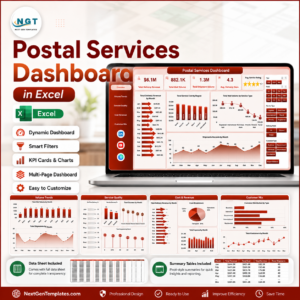
- 5 Power BI report pages – Overview, Volume Trends, Service Quality, Cost Revenue, and Customer Mix.
- 6 headline cards – Total Volume, Labor Cost, Fuel Cost, Maintenance Cost, Delivery Revenue, and Delivery Success Rate.
- 16 postal service charts – Analyze status, service type, region, month, quarter, delivery mode, facility type, and customer type.
- Multiple slicers – Filter reports quickly and compare focused segments without rebuilding visuals.
- Editable .pbix format – Modify visuals, add measures, connect new sources, or adapt the page layout.
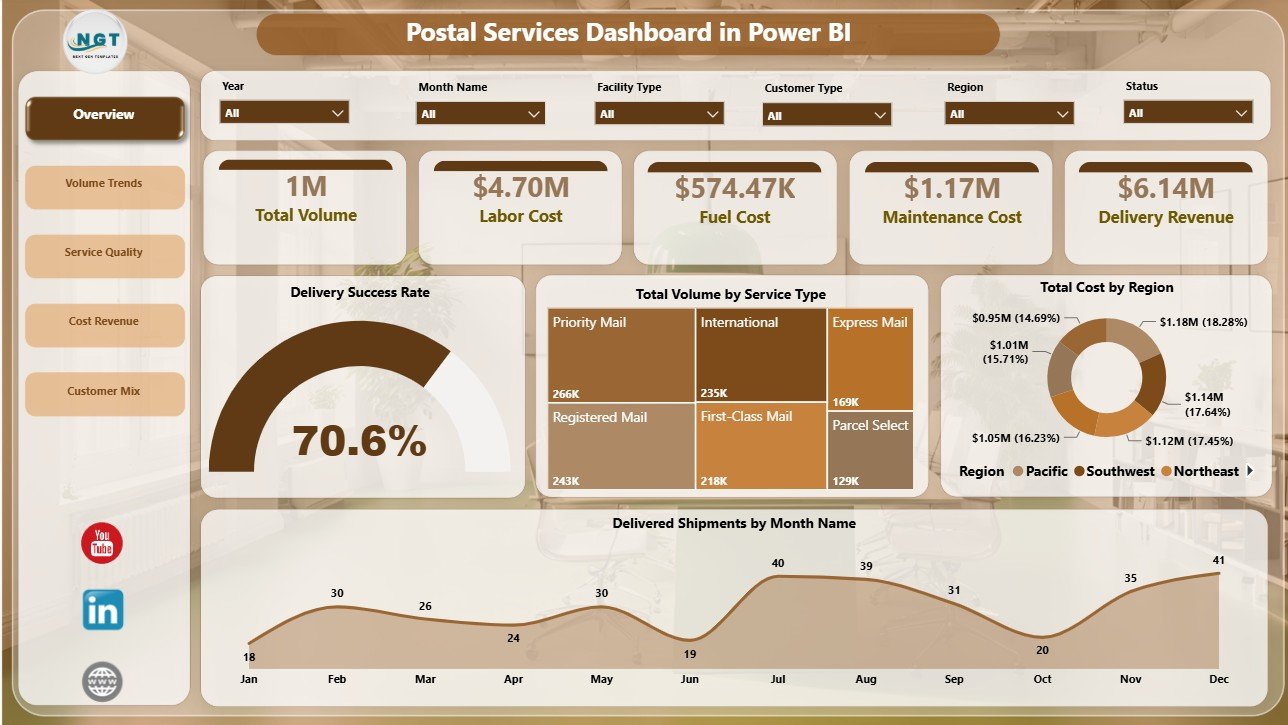
Postal Services Dashboard in Power BI
What’s Inside the Postal Services Dashboard in Power BI
Overview Page
The Overview page gives the high-level operational picture first. Cards show Total Volume, Labor Cost, Fuel Cost, Maintenance Cost, Delivery Revenue, and Delivery Success Rate.
Delivery Success Rate by Status separates delivery outcomes. Total Volume by Service Type shows workload mix, Total Cost by Region highlights costly areas, and Delivered Shipments by Month Name shows monthly delivery movement.
Volume Trends
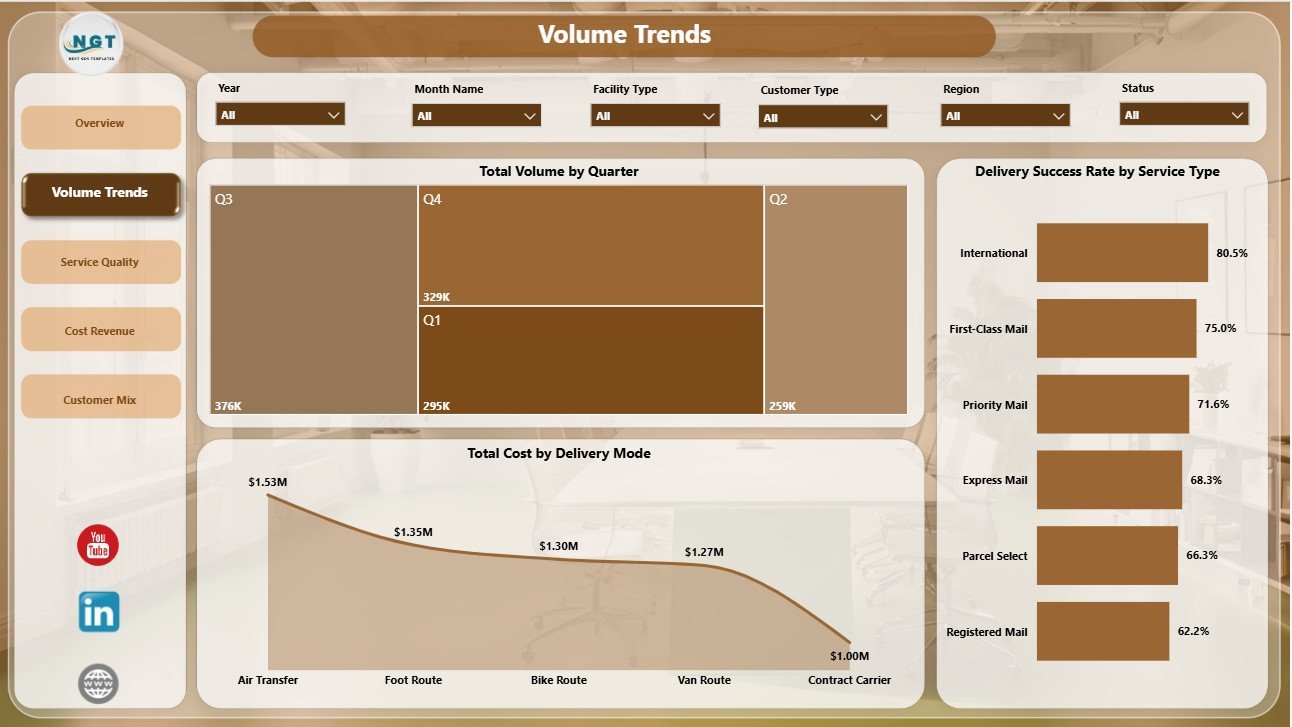
Total Volume by Quarter reveals seasonal or quarterly changes in shipment activity. Delivery Success Rate by Service Type compares reliability across service categories.
Total Cost by Delivery Mode shows whether road, air, branch, express, or other delivery modes are creating higher cost pressure.
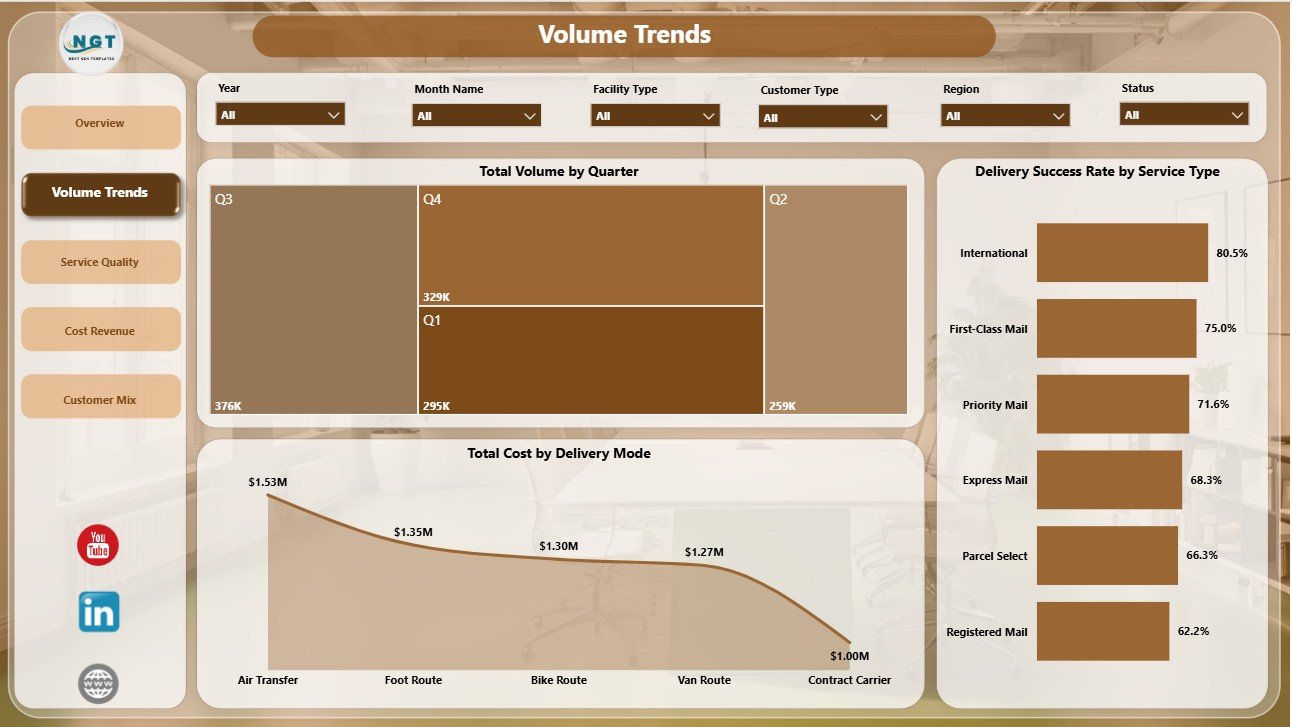
Volume Trends
Service Quality
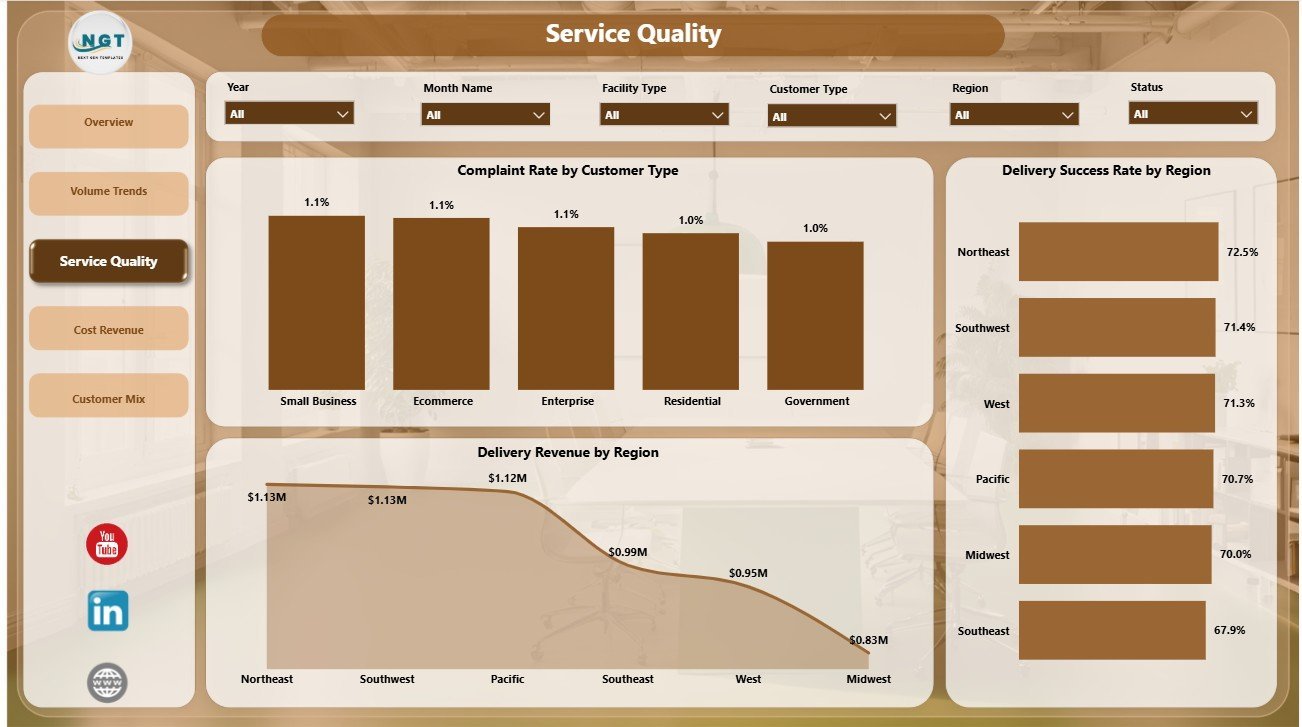
Complaint Rate by Customer Type helps identify which customer groups need better handling or communication. Delivery Success Rate by Region compares regional reliability.
Delivery Revenue by Region shows where financial contribution is strongest, helping leaders prioritize improvements.
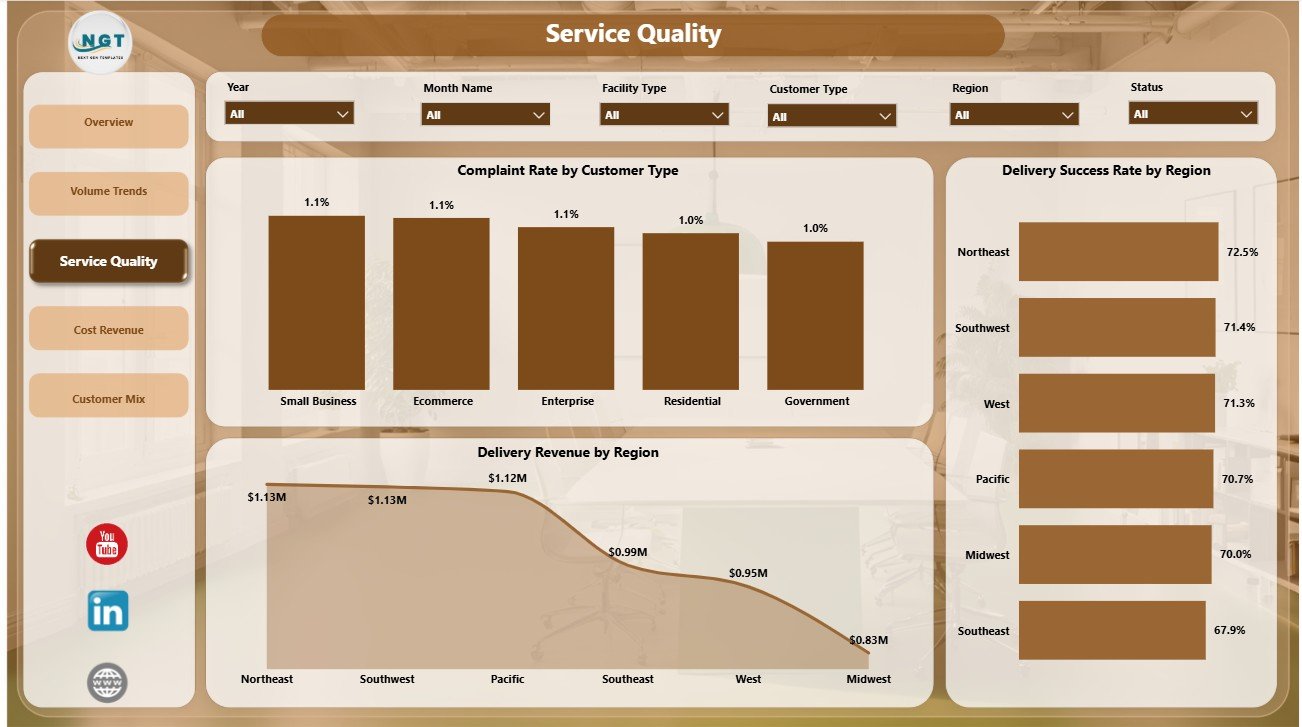
Service Quality
Cost Revenue
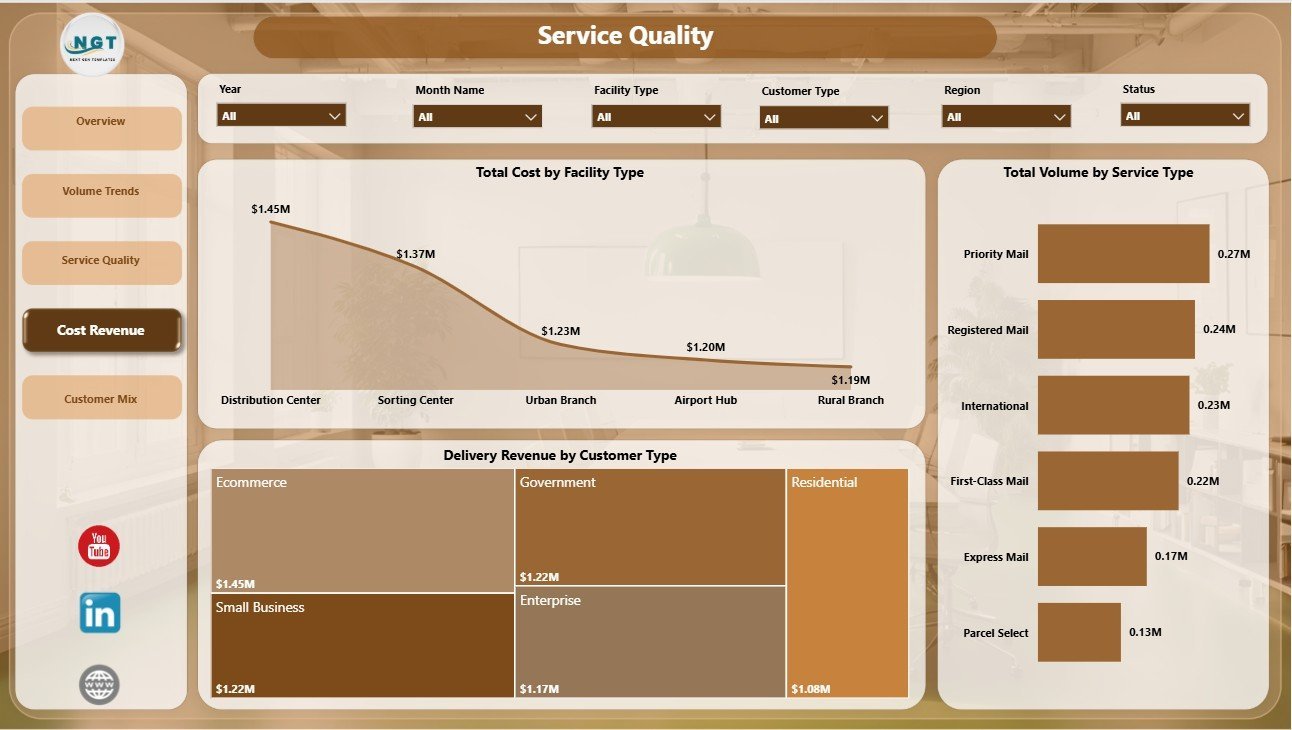
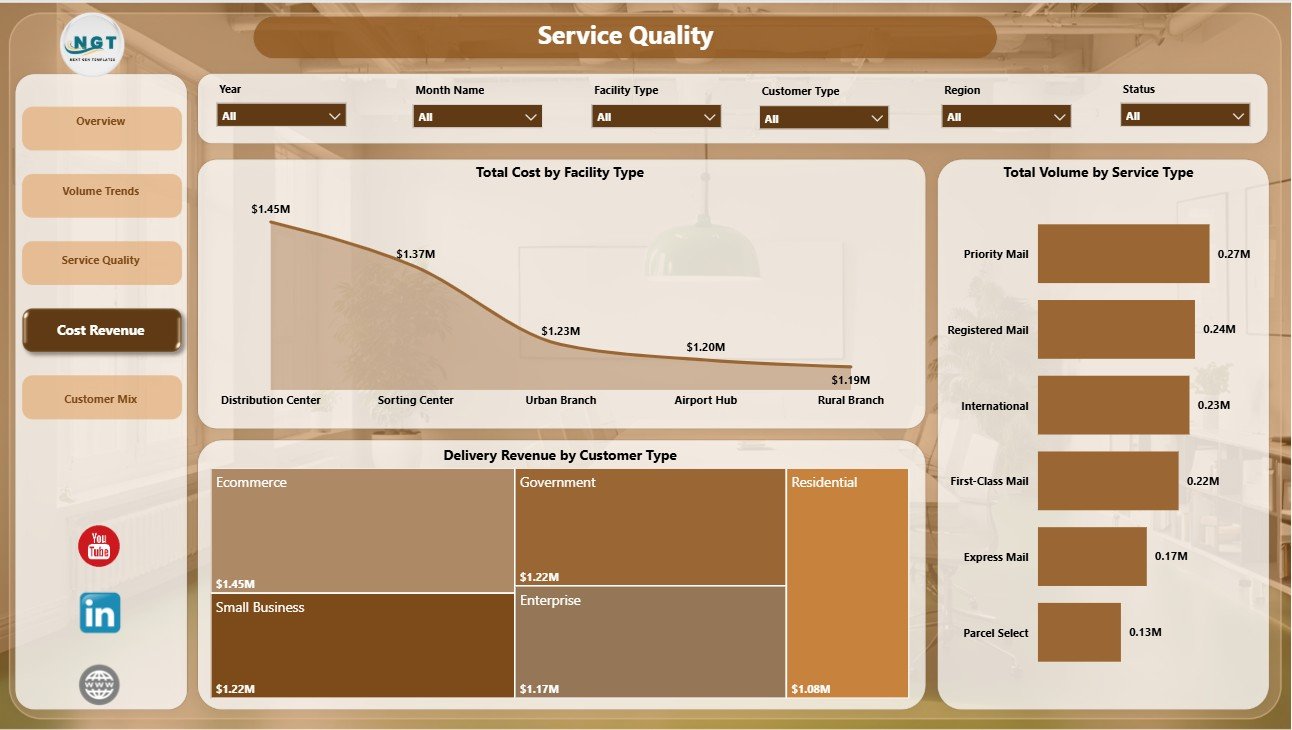
Total Cost by Facility Type shows which facility groups consume the most operating budget. Total Volume by Service Type explains workload distribution.
Delivery Revenue by Customer Type shows which customer segments generate the most income. This page supports budget review, service pricing, and capacity planning.
Cost Revenue
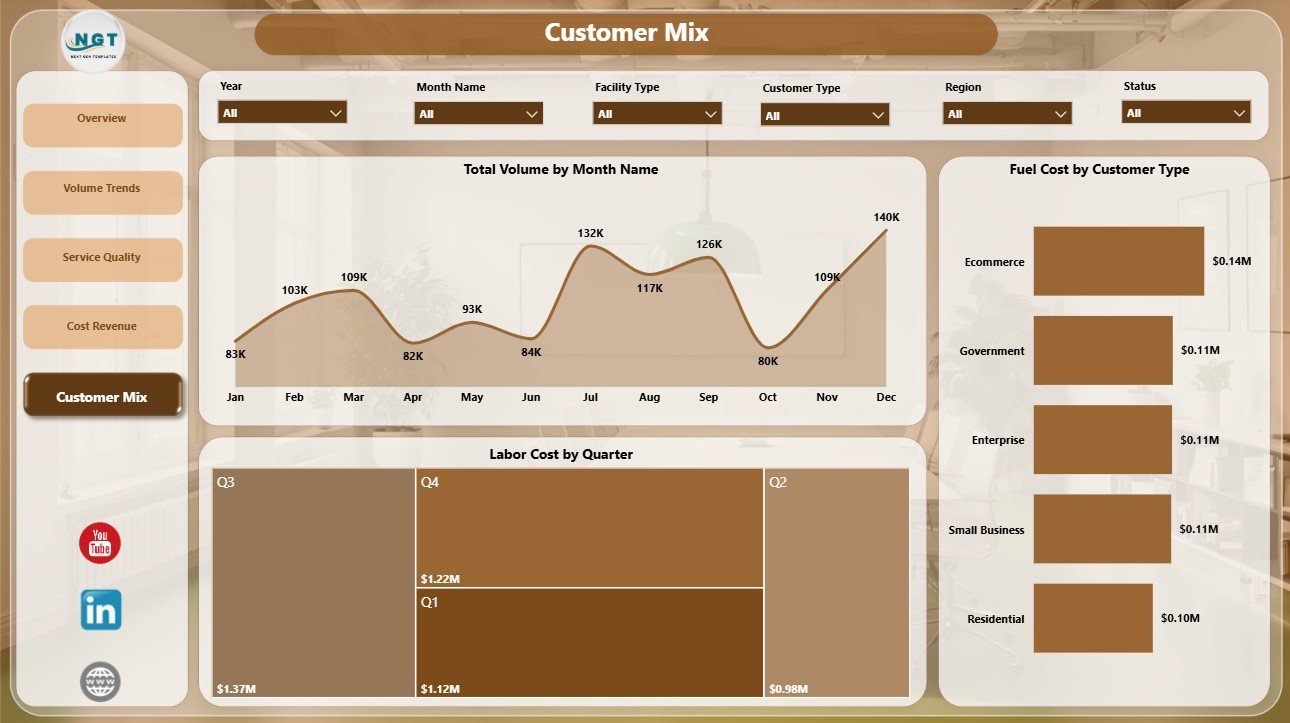
Customer Mix
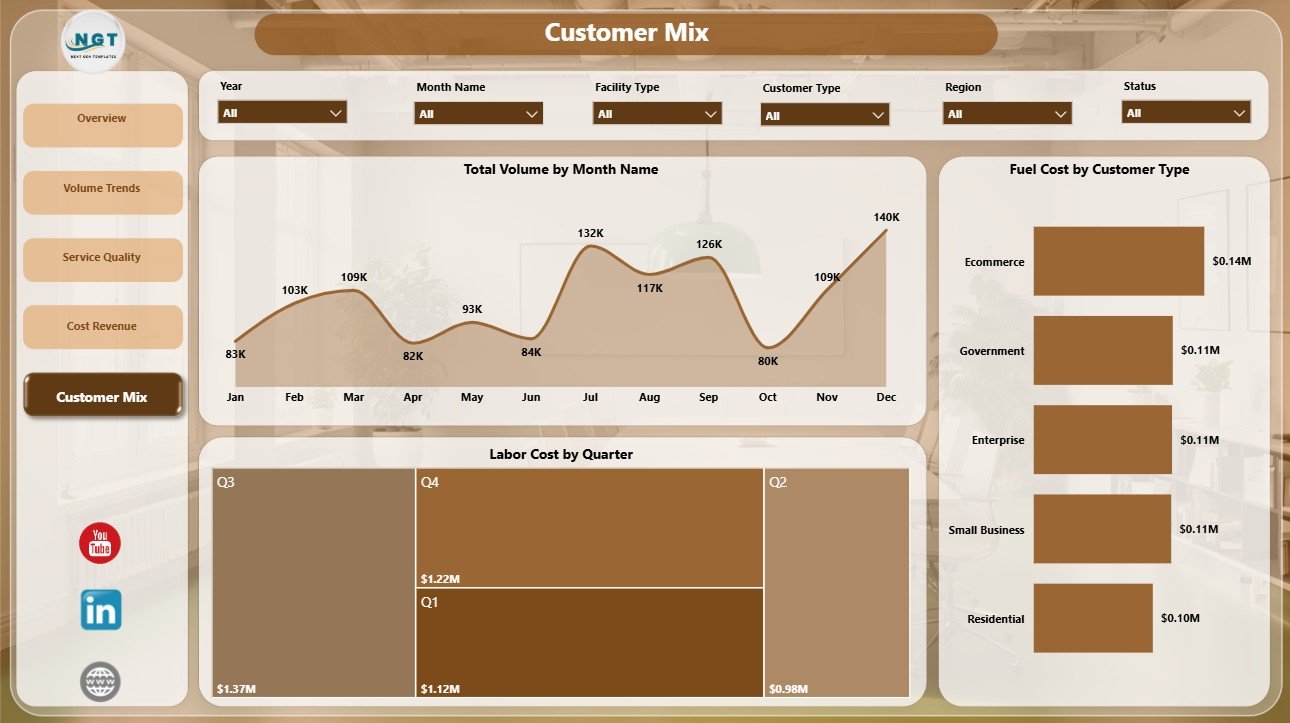
Total Volume by Month Name shows when demand rises or falls across the year. Labor Cost by Quarter supports workforce planning.
Fuel Cost by Customer Type shows whether specific customer groups create heavier delivery cost. The page is helpful for margin review and service planning.
Customer Mix
Postal Services Dashboard in Power BI vs. Tableau vs. Paid Logistics SaaS – Where This Fits
| Feature | This Power BI dashboard | Tableau alternative | Paid logistics SaaS |
|---|---|---|---|
| Cost | $17.99 one-time | License or creator subscription may apply | Usually monthly per user or location |
| Setup time | Open .pbix, connect data, refresh | Build or adapt workbook | Onboarding and configuration required |
| Postal-specific pages | 5 ready report pages | Must be built or purchased | Depends on vendor module |
| Year-1 cost at 5 users | $17.99 plus existing Microsoft tools | Typically higher with licenses | Often hundreds or thousands per year |
Who This Template Is For – and Who It’s Not For
This template is for postal operations managers, courier analytics teams, regional service heads, branch supervisors, finance analysts, and Power BI users who need recurring shipment, cost, delivery, and customer reporting.
It is not for teams that need live parcel tracking, barcode scanning, route optimization, customer notification automation, or a complete transportation management system.
How to Use the Postal Services Dashboard in Power BI
- Download and unzip the file.
- Open the .pbix file in Power BI Desktop.
- Review the included sample data structure.
- Replace the sample source with your own postal service data.
- Refresh the model and review all 5 pages.
- Use slicers to filter by service type, region, customer type, delivery mode, facility type, status, month, or quarter.
Real-World Use Cases
Anita, a regional postal operations manager, reviews the Overview and Service Quality pages before weekly meetings. She filters by region to identify low delivery success and high complaint segments.
Rohit, a courier branch supervisor, uses Volume Trends to compare quarterly workload and cost by delivery mode.
Meena, a finance analyst, uses Cost Revenue and Customer Mix to compare facility cost, labor cost, fuel cost, delivery revenue, and customer contribution.
Frequently Asked Questions
What does this Power BI dashboard track?
It tracks postal volume, labor cost, fuel cost, maintenance cost, delivery revenue, delivery success rate, complaint rate, total cost, delivered shipments, service type, region, delivery mode, facility type, customer type, month, and quarter.
Do I need Power BI Desktop?
Yes. Open the .pbix file in Power BI Desktop, which is available from Microsoft.
Can I use my own data?
Yes. Replace or connect the sample source with your own postal service records and refresh the report.
Can I customize the report pages?
Yes. Since this is a standard .pbix file, you can edit visuals, measures, colors, filters, and page layouts.
Does it include live delivery tracking?
No. This is a reporting dashboard. Live tracking requires a parcel tracking or logistics execution system.
About the Author
Built by PK – Microsoft Certified Professional with 15+ years of Excel, Google Sheets, and Power BI experience. Founder of NextGenTemplates, reaching 300K+ subscribers across YouTube channels. Every template is hand-built and tested before release.
Explore Related Templates
- Trucking and Logistics Dashboard in Power BI
- Logistics Manager Toolkit
- Postal Services Dashboard in Excel
- Postal Services KPI Dashboard in Excel
- Power BI Dashboard Templates
Click here to read the Detailed Blog Post
Download the Postal Services Dashboard in Power BI today and turn postal operations data into a clear, interactive reporting system.
Last updated: July 2026
Watch the demo video:
Compatibility and Requirements
- Works in Power BI Desktop, which is free to download from Microsoft. The template is a .pbix file.
- Power BI Desktop runs on Windows. Microsoft explains the download options in Get Power BI Desktop.






Reviews
There are no reviews yet.