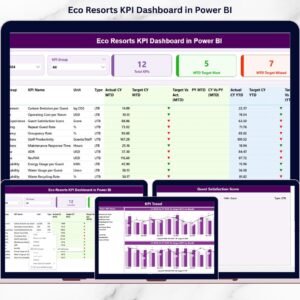
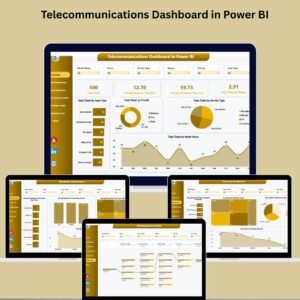
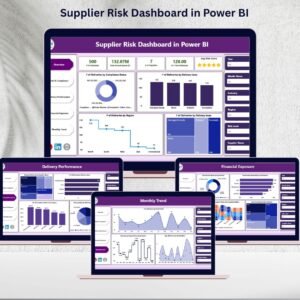
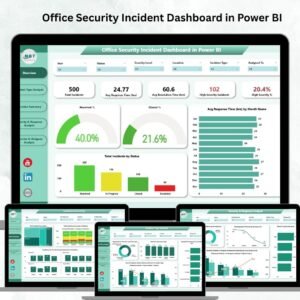
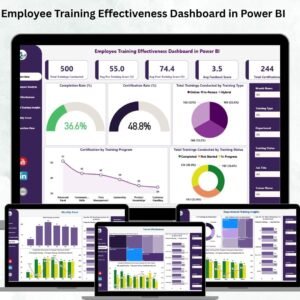
Eco Resorts Dashboard in Power BI brings booking, revenue, occupancy, accommodation, guest, channel, and sustainability reporting into five connected pages. It is built for eco-resort owners, hospitality analysts, consultants, and operations teams that want a polished reporting layer for consistently structured source data.

The package includes an editable PBIX report, Data.xlsx with 500 fictional sample bookings, and a Power BI user manual. Replace the examples with your own validated records, refresh the model, and use the prepared filters to explore the portfolio. The report is analytics-only: it does not accept bookings, connect to a property-management system, verify eco certifications, or calculate regulatory compliance.
Eco Resorts Dashboard in Power BI: five report pages
- Overview: revenue, bookings, occupancy, renewable share, guest rating, monthly performance, accommodation mix, and regional revenue.
- Booking Trends: monthly revenue, nights booked versus available, a monthly summary, average booking value, and headline booking measures.
- Resorts & Accommodation: revenue by eco-certification label, occupancy and margin by accommodation type, and a resort-by-accommodation matrix.
- Sustainability: energy consumed, renewable energy, renewable share, waste generated, waste recycled, regional renewable energy, and resort-level energy intensity.
- Guests & Channels: revenue and gross profit by booking channel, bookings by guest segment, and a resort scorecard.
Filter the prepared analysis
Date Range, Resort, Region, Guest Segment, Accommodation Type, Booking Channel, and Eco Certification filters appear where relevant. They let reviewers move from a portfolio view to a selected resort, market, customer segment, or accommodation category without rebuilding visuals. Results depend entirely on the supplied source records and model definitions.
Editable 500-row sample dataset
The source workbook demonstrates 20 fields, including booking date, resort, region, accommodation type, guest segment, booking channel, certification label, status, nights, capacity, guests, nightly rate, revenue, operating cost, energy, renewable energy, waste, recycling, and rating. The fictional examples are for learning and demonstration, not operational evidence.
A practical reporting workflow
- Keep an untouched backup of the download.
- Review the sample table and map your approved source fields.
- Standardize resort, region, channel, segment, status, and certification labels.
- Replace the examples without changing the prepared structure.
- Refresh Power BI and reconcile totals with the source system.
- Apply filters for the management, commercial, or sustainability review.
Reconciliation matters: an attractive dashboard cannot correct missing bookings, duplicated IDs, inconsistent labels, or incorrectly entered energy and waste figures. Treat certification and sustainability fields as buyer-supplied reporting values, not independent verification or environmental assurance.
Bring different review audiences together
Revenue teams can concentrate on booking value, occupancy, channels, and accommodation mix, while operations teams compare properties and regions. Sustainability reviewers can examine entered energy and waste measures alongside business activity. Keeping those perspectives in one model makes it easier to discuss trade-offs and investigate unusual movements without maintaining separate presentation files.
Always confirm the reporting period, filter context, currency, energy units, and waste units before sharing an export. Restrict access when booking or commercial information is sensitive, and retain only the fields required for the intended review.
Related hospitality dashboards
Compare the published Eco Resorts Dashboard in Excel or the KPI-focused Eco Resorts KPI Dashboard in Power BI. Other useful options include the Eco Lodges Dashboard in Power BI, Capsule Hotels Dashboard in Power BI, and Hotel Revenue RevPAR Dashboard in Power BI.
For general guidance on sustainable tourism, consult the UN Tourism sustainable development resources. Use this template as an internal reporting aid within the measurement standards, controls, and professional review appropriate to your organization.
What you receive
- Editable Microsoft Power BI PBIX report
- Five prepared report pages
- Data.xlsx with 500 fictional sample bookings
- Power BI dashboard user manual
- Instant ZIP download after purchase
Build a repeatable resort review. Download the dashboard, connect it to carefully prepared data, validate the results, and present booking, revenue, guest, operational, and sustainability measures in one consistent report.