

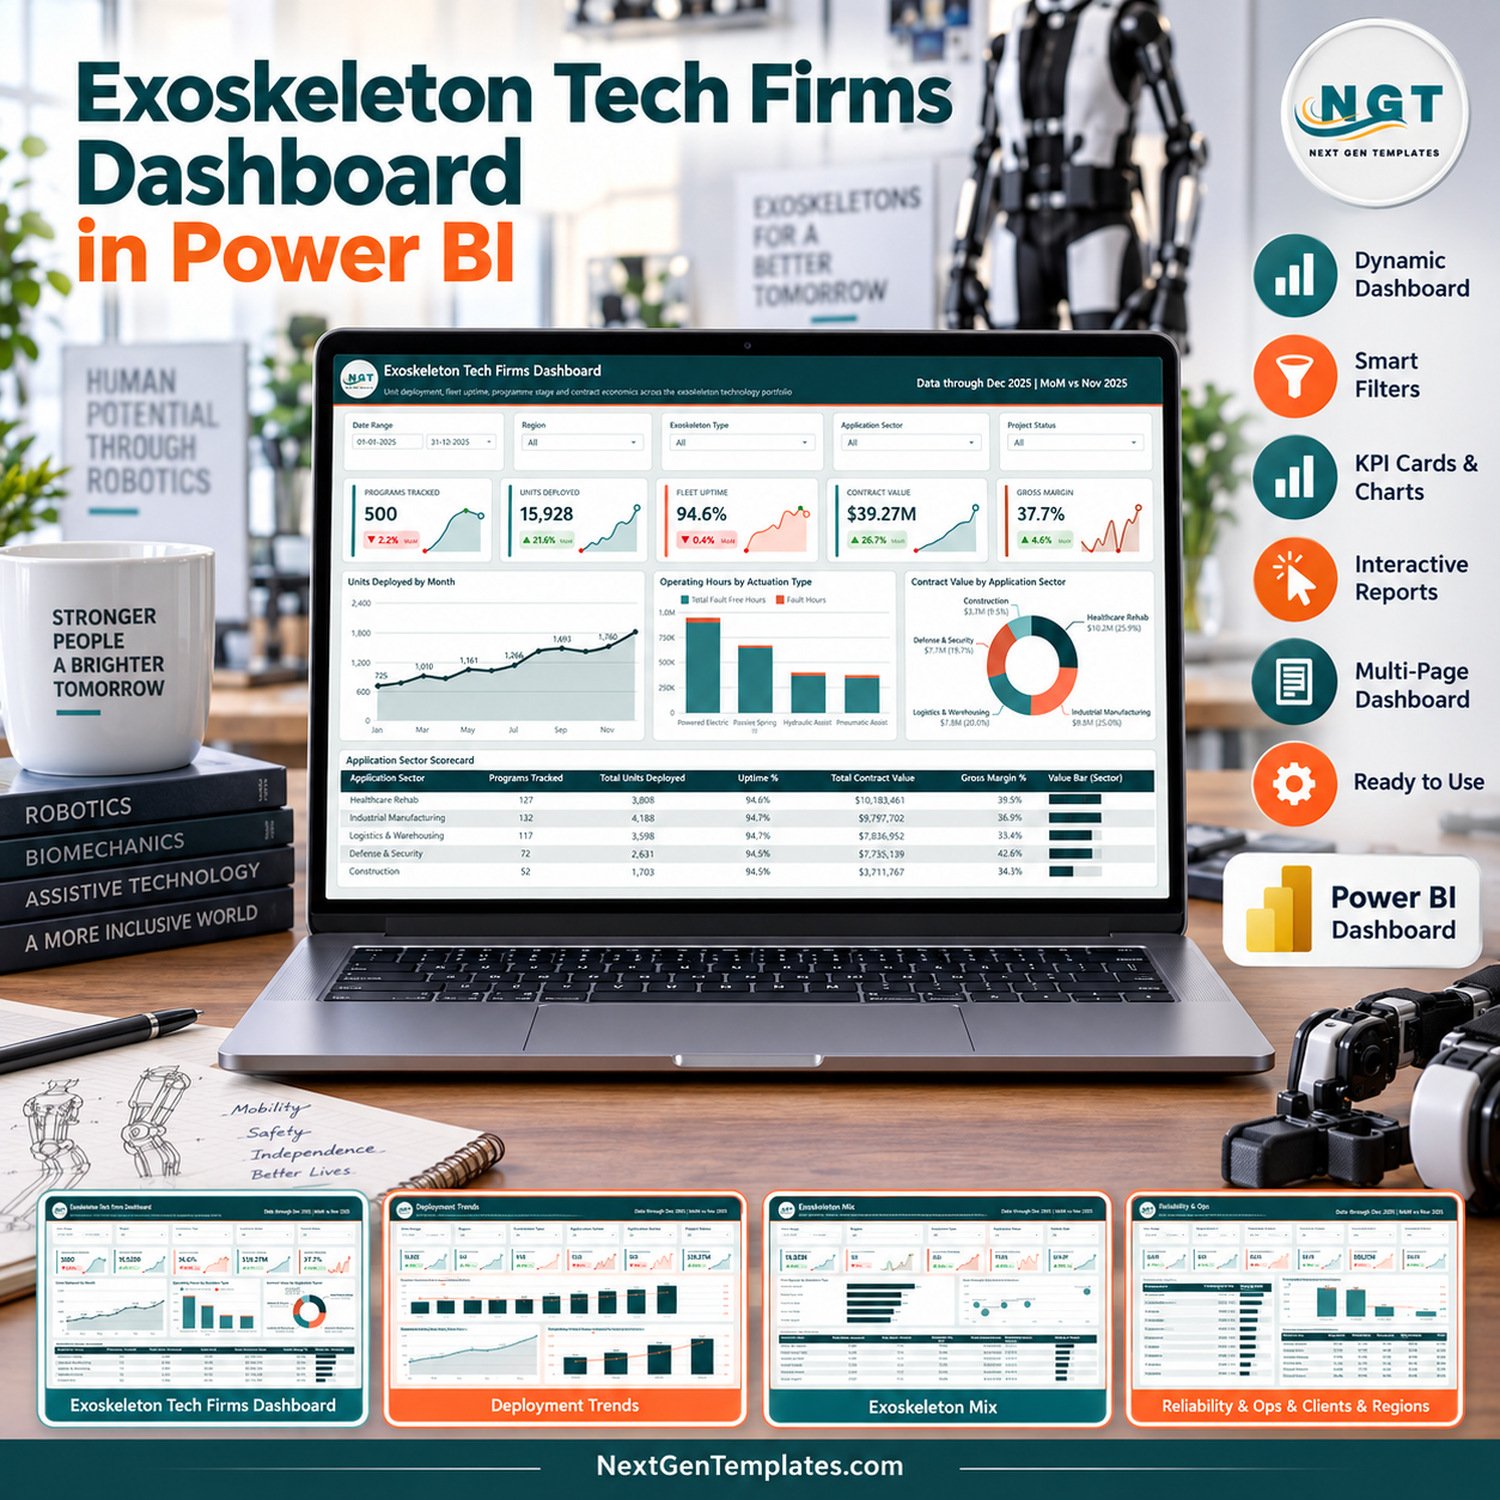
The Exoskeleton Tech Firms Dashboard in Power BI turns 500 programme records into 5 interactive report pages with 25 KPI cards, 16 charts and tables, and 5 slicers on every page. It tracks units deployed, operating hours, fleet uptime, contract value and gross margin across 12 sample firms, 5 regions and 5 application sectors, and every KPI card shows its month-over-month change.
🚀 The sample data ships inside the download, so every page opens fully populated in Power BI Desktop. Swap in your own records, click Refresh, and the whole report recalculates.
✅ Instant download · One-time payment · No subscription · Lifetime access
🔑 Key Features of the Exoskeleton Tech Firms Dashboard in Power BI
📈 25 KPI cards with change badges and sparklines – Each analysis page opens with five cards. Every card shows the current value, a green or red month-over-month badge (December 2025 against November 2025 in the sample) and a twelve-month sparkline.
🎛️ Five slicers on every page – Date Range, Region, Exoskeleton Type and Application Sector appear on all five analysis pages. Each page adds its own filter: Project Status, Development Stage, Actuation Type, Program Lead or Firm Name.
⚙️ Reliability side by side – Operating Hours (2.41M), Fault Free Hours (2.28M), Fleet Uptime (94.6%), Hours Per Unit (151.6) and Fault Rate (5.4%) share one page. Uptime is broken down by development stage and by actuation type and region.
💰 Contract economics – Contract Value ($39.27M), Avg Contract ($78,530), Value Per Client ($8,369) and Gross Margin (37.7%) show what the portfolio earns and how it trends by month and by quarter.
🦾 Exoskeleton type comparison – Passive Back Support, Powered Upper Limb, Powered Full-Body, Lower Limb Rehab and Shoulder Support are compared on units, average assist load in kg, uptime, contract value and operator satisfaction stars.
🏢 Firm and programme lead scorecards – 12 fictional firms and 10 programme leads are ranked in tables with inline data bars, so the strongest and weakest performers are easy to spot.
🗂️ One flat 18-column data table – Data.xlsx holds one row per programme record: Firm ID, Record Date, Firm Name, Region, Exoskeleton Type, Application Sector, Development Stage, Program Lead, Actuation Type, Project Status, Units Deployed, Operating Hours, Fault Free Hours, Avg Assist Load Kg, Enterprise Clients, Contract Value, Production Cost and Operator Satisfaction.
📦 What’s Inside the Power BI Download
The zip holds the .pbix report file, Data.xlsx with 500 sample rows dated January to December 2025, and the Power BI Dashboard User Manual (PDF). The report has five analysis pages and one closing page.
Page 1: Exoskeleton Tech Firms Dashboard (Overview)
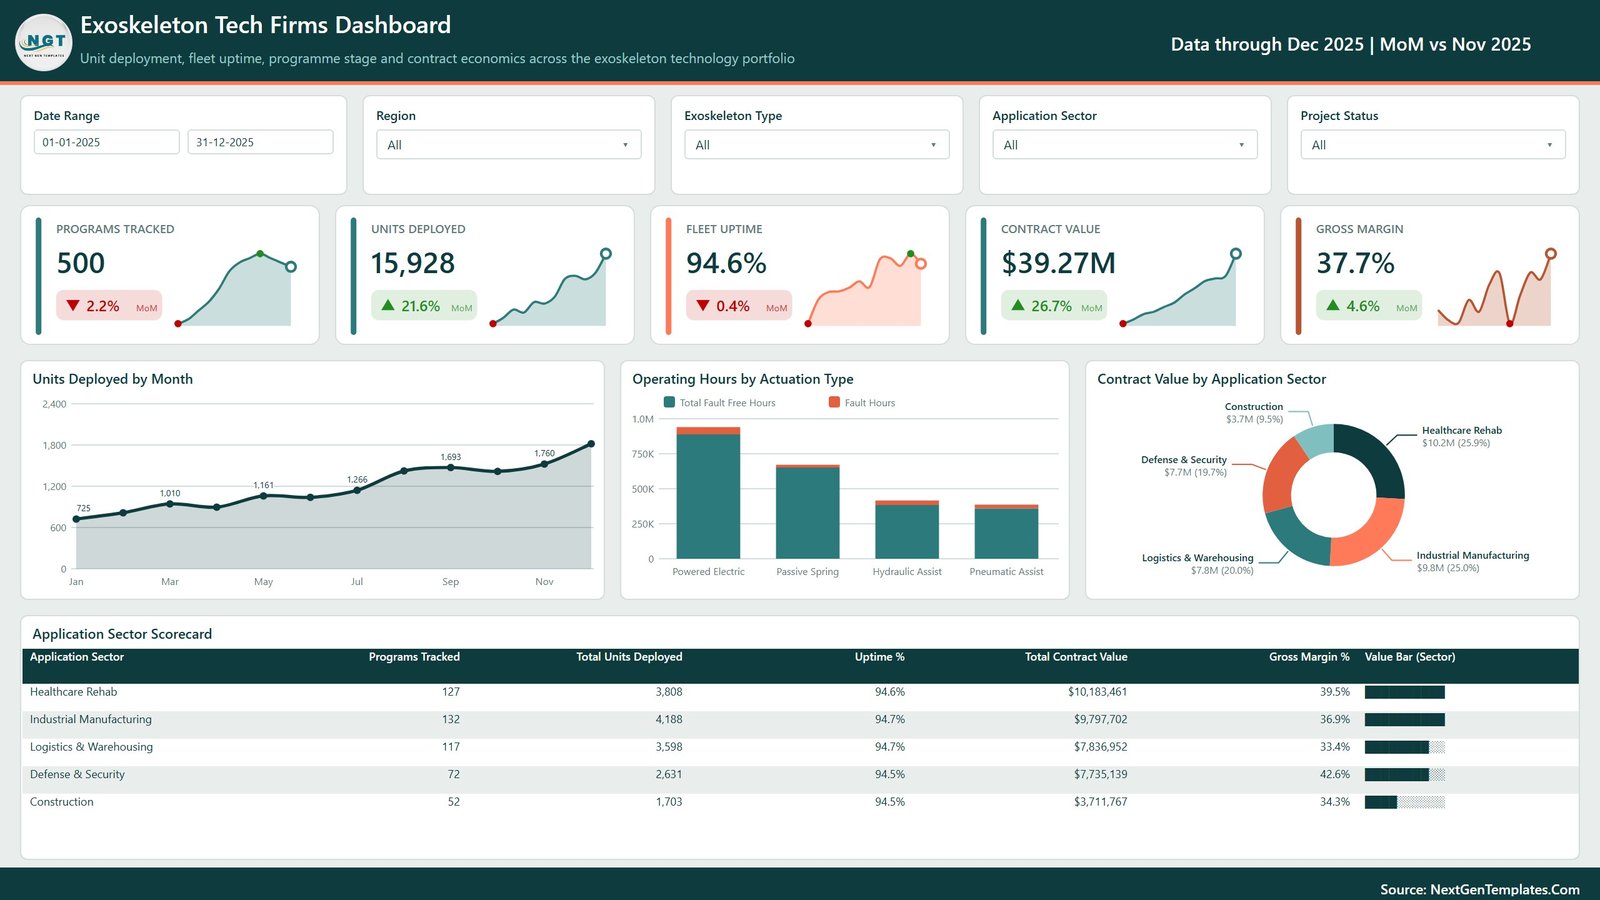
Cards for Programs Tracked (500), Units Deployed (15,928), Fleet Uptime, Contract Value and Gross Margin. Charts show Units Deployed by Month, Operating Hours by Actuation Type (fault-free hours stacked with fault hours) and Contract Value by Application Sector. The Application Sector Scorecard lists programmes, units, uptime %, contract value and gross margin % for each sector. This page has a Project Status slicer.
Page 2: Deployment Trends
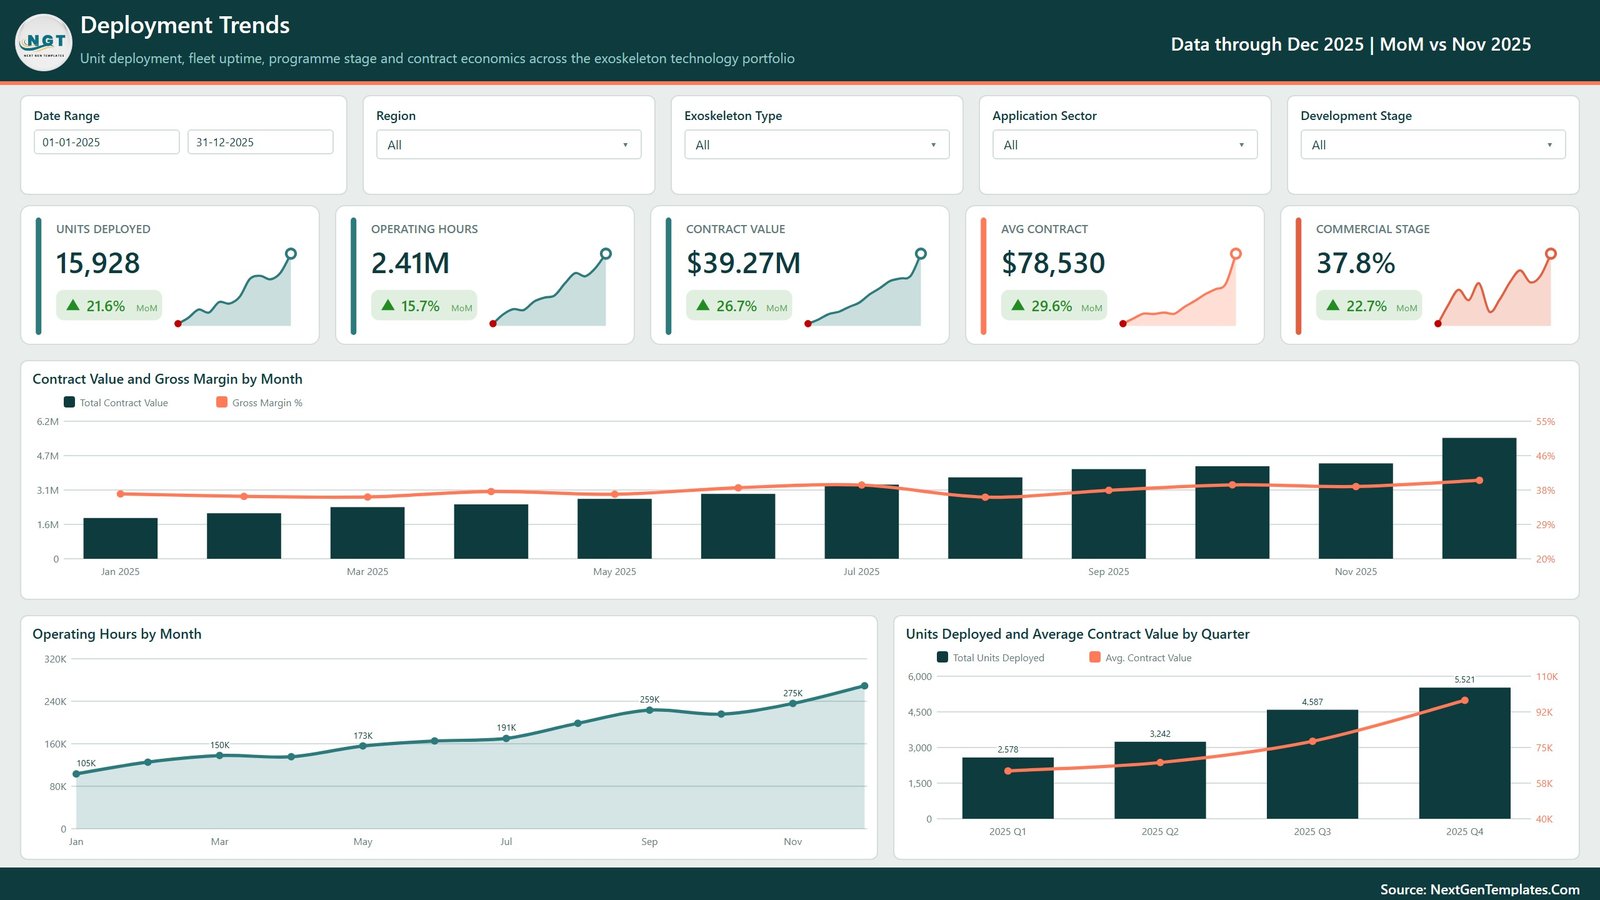
Cards for Units Deployed, Operating Hours, Contract Value, Avg Contract and Commercial Stage share (37.8%). Charts show Contract Value and Gross Margin by Month, Operating Hours by Month, and Units Deployed and Average Contract Value by Quarter. The page filter is Development Stage.
Page 3: Exoskeleton Mix
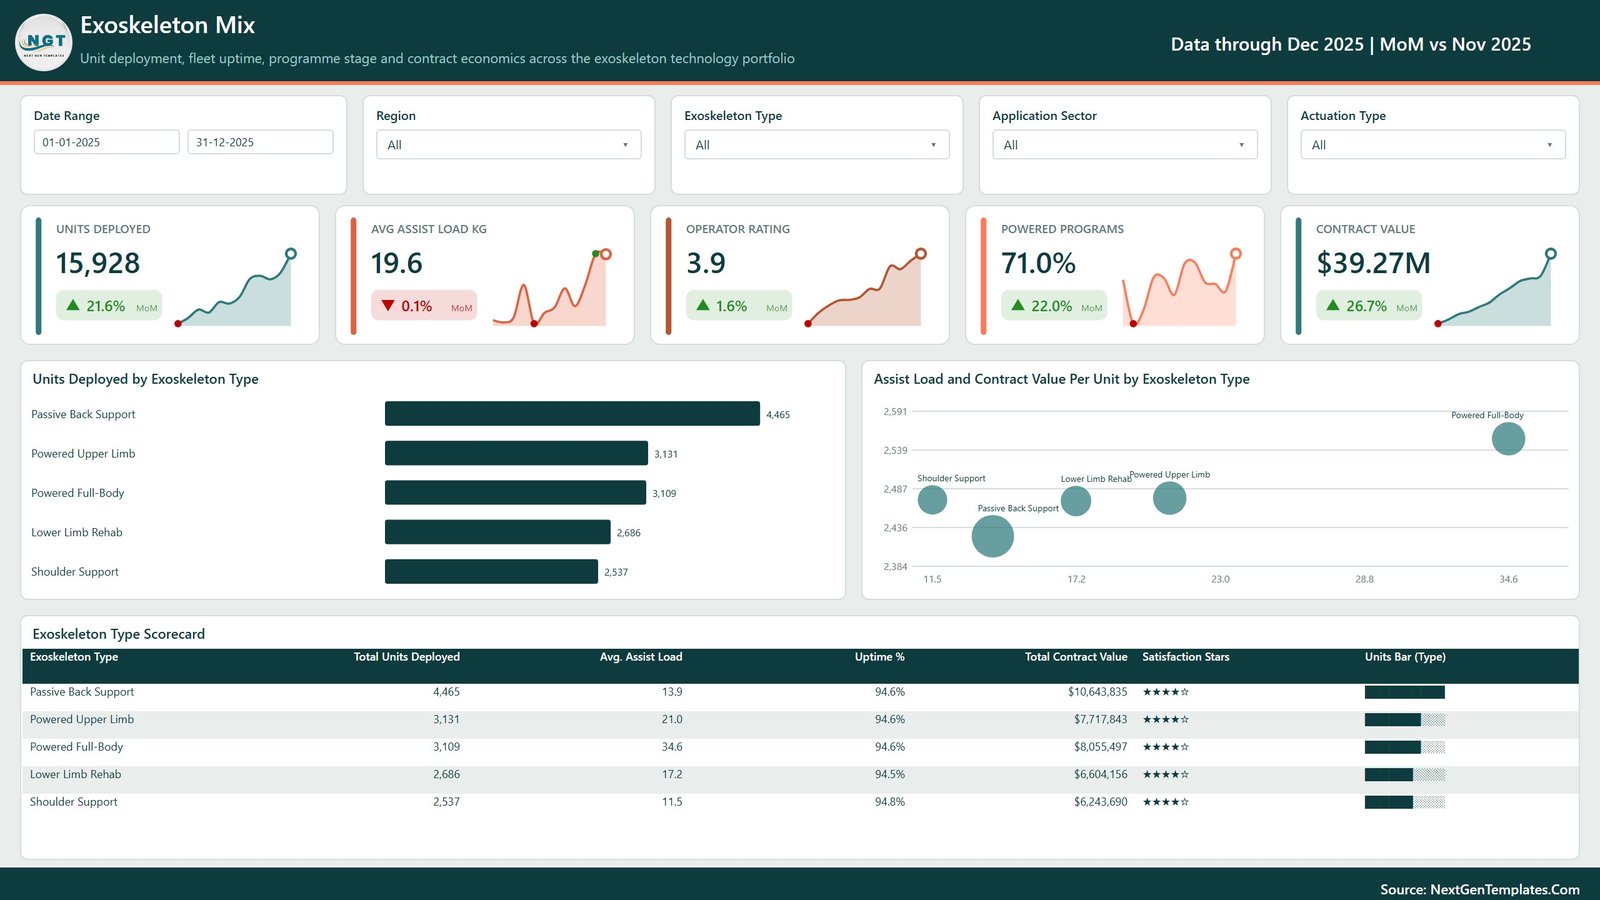
Cards for Units Deployed, Avg Assist Load (19.6 kg), Operator Rating (3.9), Powered Programs share (71.0%) and Contract Value. Charts show Units Deployed by Exoskeleton Type and Assist Load and Contract Value Per Unit by Exoskeleton Type. The Exoskeleton Type Scorecard adds uptime and satisfaction stars. The page filter is Actuation Type.
Page 4: Reliability & Ops
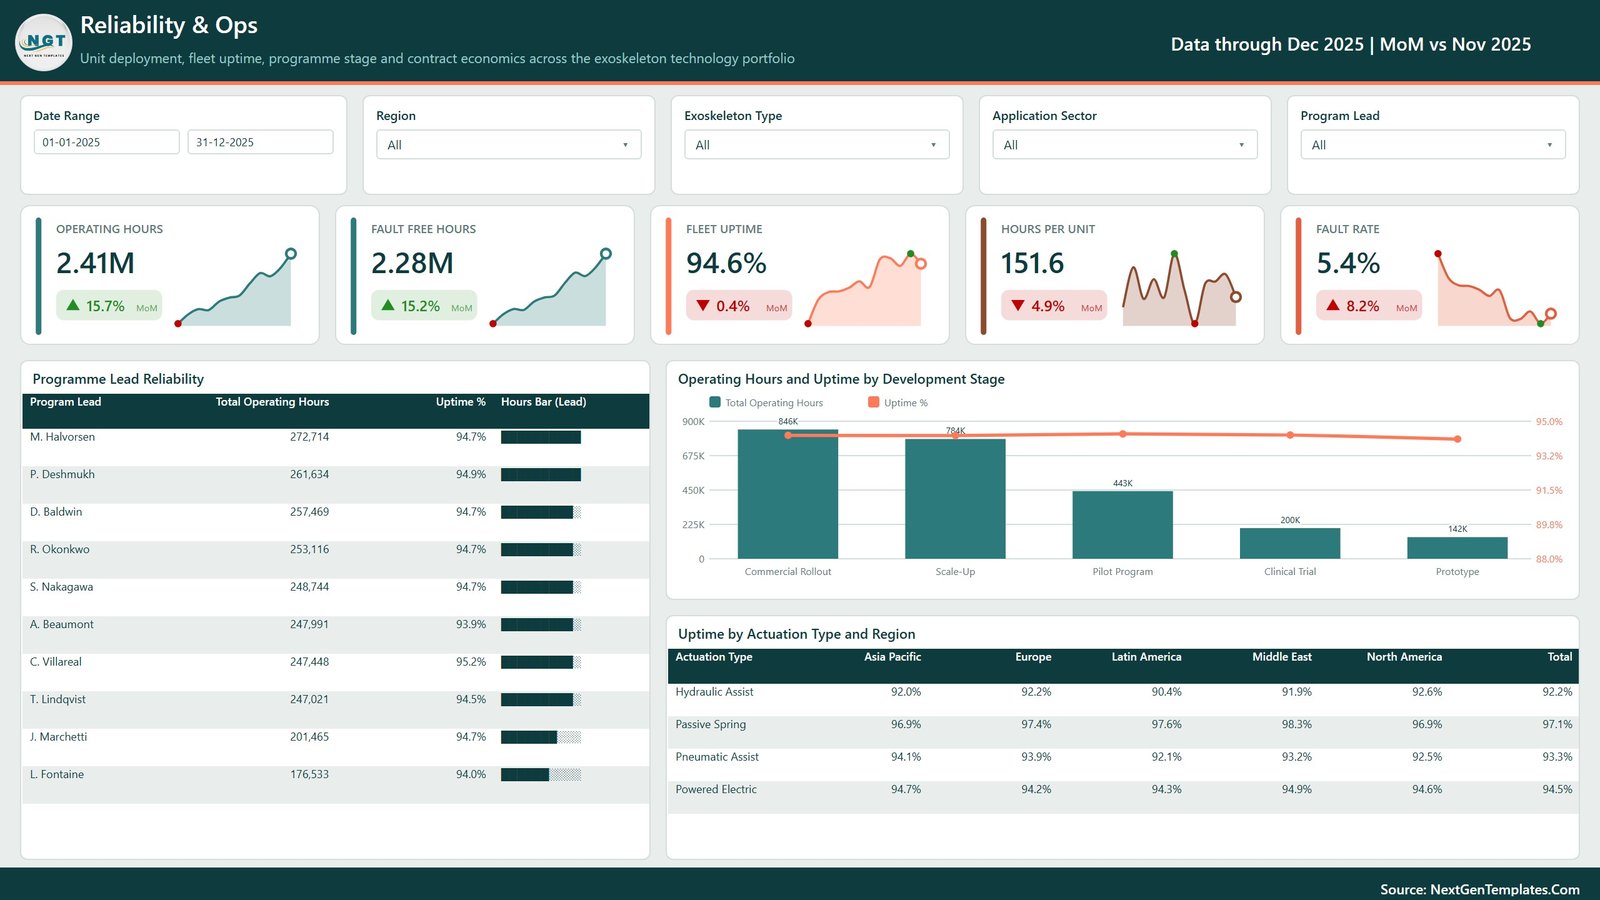
Cards for Operating Hours, Fault Free Hours, Fleet Uptime, Hours Per Unit and Fault Rate. The Programme Lead Reliability table ranks 10 leads by operating hours and uptime. There is also a chart of Operating Hours and Uptime by Development Stage, and a matrix of Uptime by Actuation Type and Region. The page filter is Program Lead.
Page 5: Clients & Regions
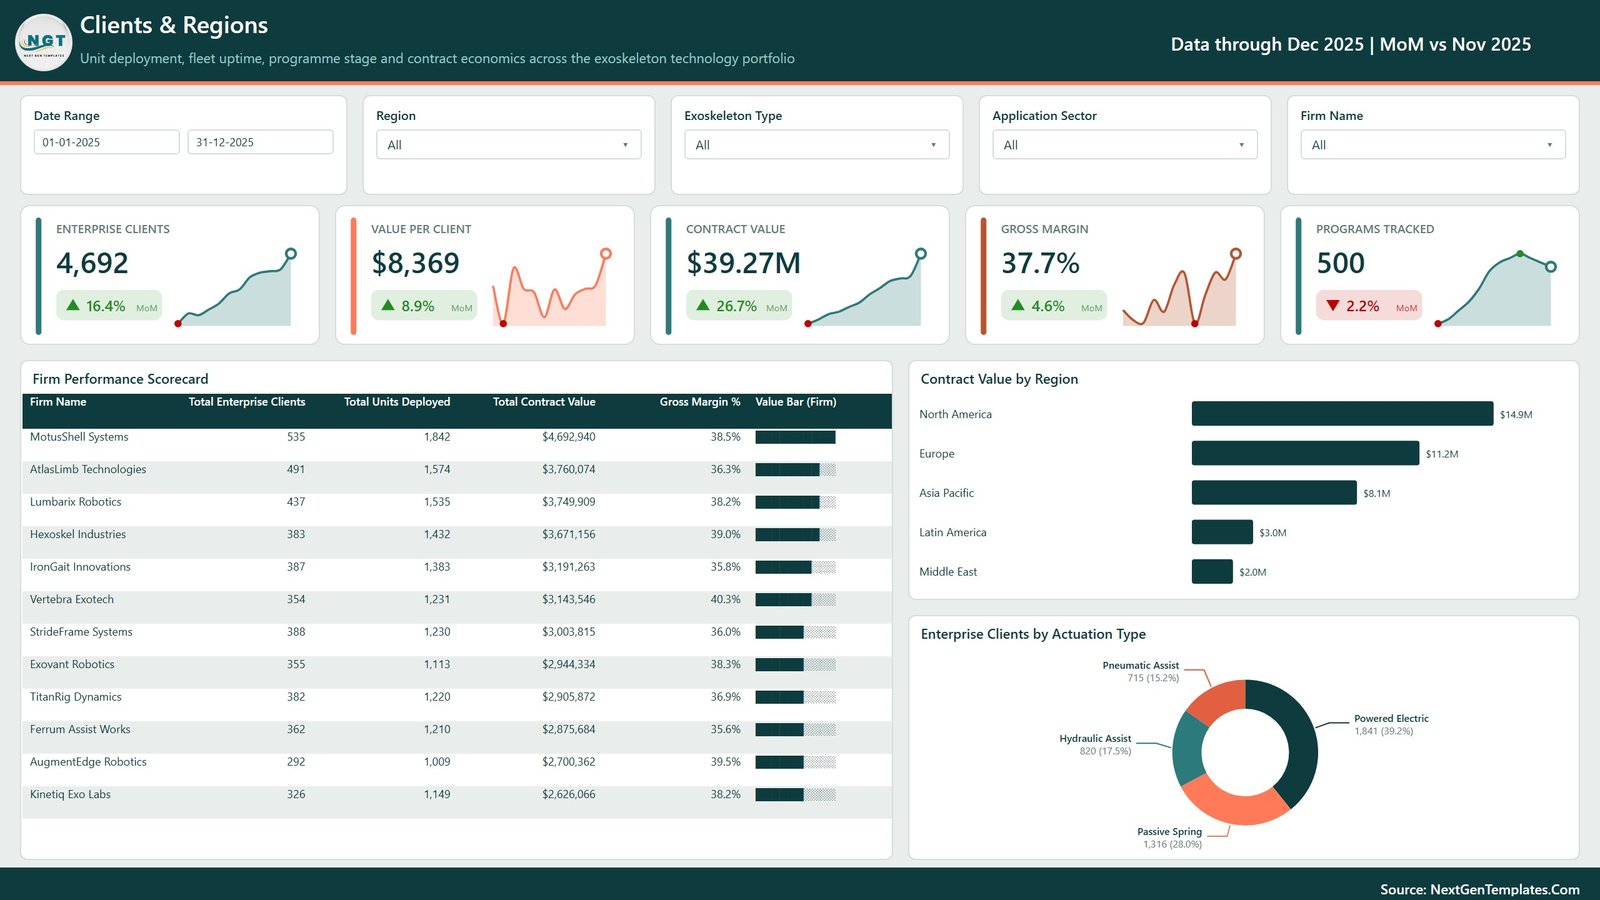
Cards for Enterprise Clients (4,692), Value Per Client, Contract Value, Gross Margin and Programs Tracked. The Firm Performance Scorecard ranks all 12 firms. Charts show Contract Value by Region and Enterprise Clients by Actuation Type. The page filter is Firm Name.
Page 6: Get More Dashboards
A closing page that points to more NextGenTemplates Power BI dashboards and custom-build services. It is a navigation page and holds no analysis.
📊 Power BI Template vs. Tableau / Qlik Build vs. Subscription Analytics SaaS
| Feature | This Power BI template | Tableau / Qlik alternative | Subscription analytics SaaS |
|---|---|---|---|
| Cost | ✅ $17.99 one-time (regular $29.99) | Software licence plus your build time | Recurring per-seat subscription |
| Platform | Power BI Desktop (.pbix), free on Windows | Tableau or Qlik workbook | Vendor web app |
| Setup time | ✅ Opens populated in minutes | Days to weeks to design pages from scratch | An onboarding and integration project |
| Exoskeleton-specific pages | ✅ 5 pages for units, uptime, stage, mix and contracts | You design every page | Generic asset or fleet modules |
| Customizable fields and visuals | ✅ Every visual, measure and colour is editable | Yes, once built | Limited to vendor options |
| Real-time team collaboration | After publishing to the Power BI Service (licence needed) | Through Tableau Cloud or Qlik Cloud | ✅ Built in |
| Mobile access | Power BI mobile app once published | Vendor mobile apps | ✅ Usually built in |
| Share with link | Through the Power BI Service or a PDF / PowerPoint export | Through the vendor cloud | ✅ Built in |
| Year-1 cost at 5 users | ✅ One template fee, plus Power BI licences only if you share online | BI licences plus build time | Five seats for twelve months |
For teams that want exoskeleton deployment and contract reporting without paying for a custom build or a per-seat subscription, this template sits in the sweet spot.
👥 Who This Template Is For — and Who It’s Not For
✅ This template is built for:
- Programme and operations managers at wearable robotics or exoskeleton companies who track deployments, operating hours and uptime
- Finance and business development analysts who report contract value and gross margin by sector, region and firm
- Consultants and investors’ analysts preparing portfolio reviews of robotics firms (reporting only, not investment advice)
- Power BI learners who want a realistic multi-page model to study
❌ This template is NOT for:
- Teams that need a medical-device quality, clinical or regulatory reporting system. This is a business analytics template with fictional sample data.
- Mac-only users with no Windows machine, because Power BI Desktop runs on Windows
- Teams that need live telemetry streamed from devices. The model reads a flat table that you refresh.
⚙️ How to Use the Dashboard
- Download and unzip the file from your NextGenTemplates account.
- Open the .pbix in Power BI Desktop, which is free from Microsoft.
- Explore the five pages with the sample data and try each slicer.
- Replace the rows in Data.xlsx with your own records and keep the 18 column headers.
- Go to Home > Transform data > Data source settings, point the source to your file, then click Refresh.
- Publish to the Power BI Service, or export the report to PDF or PowerPoint to share it.
💼 Real-World Use Cases
Maya runs programme delivery at a mid-size industrial exoskeleton maker. Every Monday she filters the Reliability & Ops page to her region to check fleet uptime and fault rate by actuation type. Then she opens the Programme Lead Reliability table to see which leads need support before the monthly review.
Daniel is a finance analyst at a robotics group with several product lines. He uses Deployment Trends to show leadership how contract value and gross margin moved by month, and the quarterly chart to explain whether growth came from more units or larger contracts.
Priya is a Power BI consultant who serves hardware start-ups. She maps a client’s CRM export to the 18 columns, refreshes the model and walks the client through Clients & Regions to compare firms, regions and enterprise client counts, with no build from scratch.
❓ Frequently Asked Questions
What does the Exoskeleton Tech Firms Dashboard in Power BI track?
It tracks units deployed, operating hours, fault-free hours, fleet uptime, fault rate, hours per unit, contract value, average contract, value per client, gross margin, enterprise clients and operator rating. You can slice all of them by date, region, exoskeleton type, application sector and one page-specific filter.
Do I need a paid Power BI licence?
No, you do not need one to use the file. Power BI Desktop is free from Microsoft and opens the .pbix on Windows. You only need Power BI licences to publish and share reports in the Power BI Service, as explained in Microsoft’s licensing guide.
Can I use my own data?
Yes. Replace the sample rows in Data.xlsx with your records, keep the same 18 column headers, update the file path in Power Query and click Refresh. The cards, charts and scorecards then recalculate from your data.
Is the sample data real?
No. The firm names, programme leads and figures are fictional demo data. Labels such as Clinical Trial or Healthcare Rehab are sample categories only. The template holds no clinical, regulatory or safety data and makes no medical-device, efficacy or investment claim.
How is this different from the Excel edition?
The Exoskeleton Tech Firms Dashboard in Excel is a separate workbook build for Microsoft Excel. This Power BI edition is a .pbix report with its own pages, slicers and data model. Buy the edition that matches the tool your team uses.
How does it compare with a subscription analytics tool?
You pay once and keep the file. The pages already cover exoskeleton deployment, reliability and contract metrics, and you can edit every visual. A subscription tool adds hosted collaboration but charges per seat every month.
How long does setup take?
The report opens populated with sample data straight away. Connecting your own data takes about as long as it takes to shape your export into the 18 columns and change one file path in Power Query.
👤 About the Author
Built by PK — Microsoft Certified Professional with 15+ years of Excel, Google Sheets and Power BI experience. Founder of NextGenTemplates, with YouTube channels @PKAnExcelExpert, @NextGenTemplates and @NeoTechNavigators. Every template is hand-built and tested before release.
🔗 Explore Related Templates
🧩 Also available as: Exoskeleton Tech Firms Dashboard in Excel, a separate workbook build for teams that report in Excel.
🏭 Digital Twins in Manufacturing Dashboard in Power BI – asset and production analytics for smart factories.
🤖 Robotics Process Automation Dashboard in Power BI – bot and automation performance reporting.
🧠 Emotion AI Startups Dashboard in Power BI – a portfolio view for a different deep-tech sector.
📋 Robotics Industry KPI Dashboard in Power BI – a month-picker KPI dashboard, a different template family from this analytical dashboard.
📂 Browse all Power BI dashboard templates.
📖 Click here to read the Detailed Blog Post
🎥 Visit our YouTube channel for step-by-step video tutorials
👉 YouTube.com/@NextGenTemplates
Watch the step-by-step video Demo:
📅 Last updated: September 2026














Reviews
There are no reviews yet.