

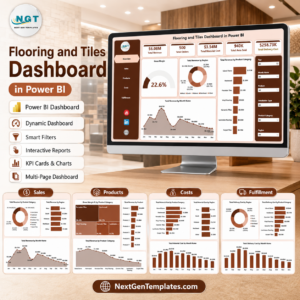
The Flooring Materials Manufacturing Dashboard in Power BI reports 16 distinct KPIs across 5 interactive report pages, with 12 charts, 3 scorecard tables and 5 slicers on every page. The sample model carries 500 production batches, 1.00M units produced and $26.26M of production value across 4 plants, 4 production lines and 6 product categories for the full 2025 calendar year.
🌍 Join 8,400+ teams in 40+ countries using NextGenTemplates to replace paid SaaS tools with one-time-purchase Excel, Google Sheets, Power BI and HTML templates.
✅ Instant download · One-time payment · No subscription · No per-user fees · Lifetime access
📌 Honest scope note: this is a reporting and analysis file. It ships with fictional sample data and is not wired to any MES, ERP or SCADA system, and it is not a production-control or quality-management system of record. Point it at your own export and it becomes your reporting layer — it will not run a line or release a batch.
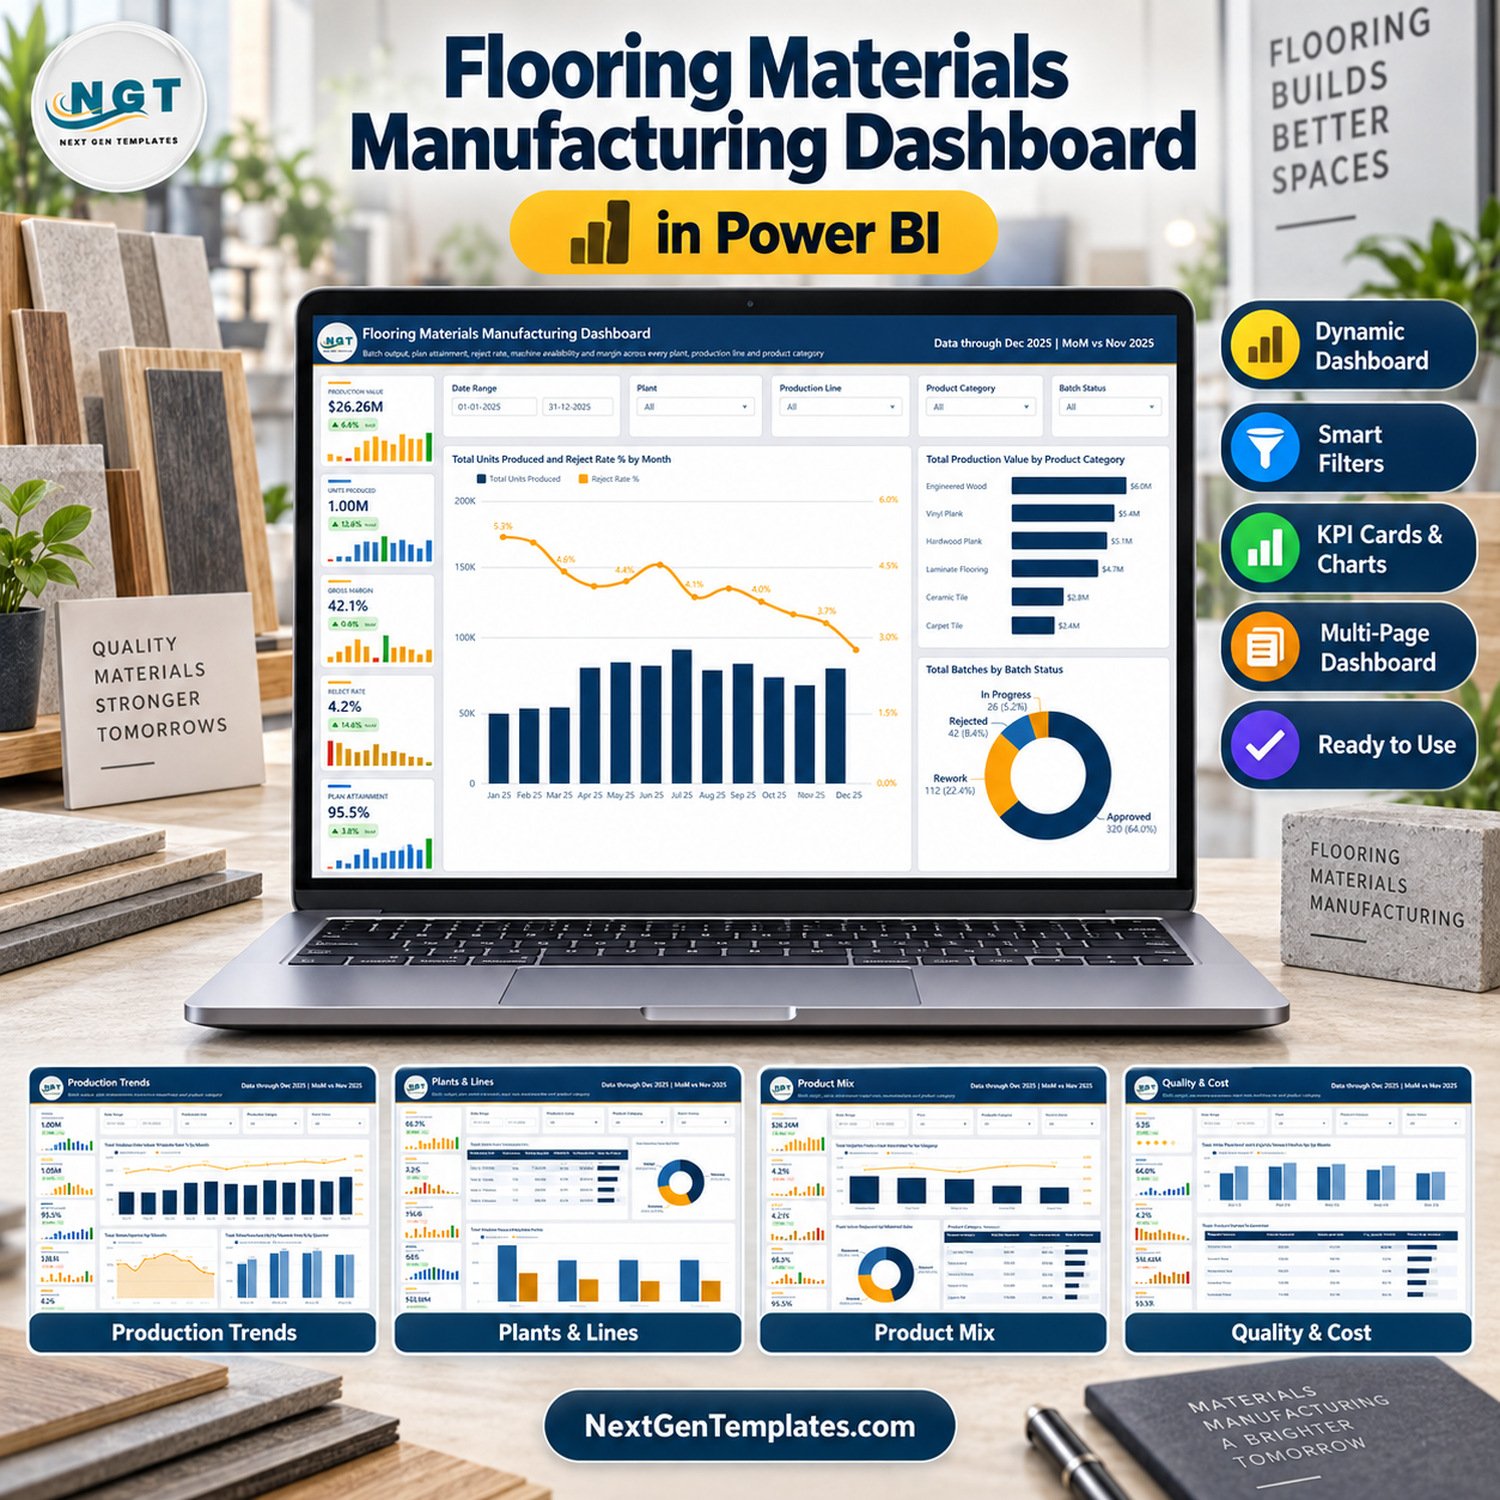
🔑 Key Features of the Flooring Materials Manufacturing Dashboard in Power BI
📊 16 manufacturing KPIs across 25 card slots. Production Value, Units Produced, Planned Units, Plan Attainment, Gross Margin, Reject Rate, Batch Approval Rate, Quality Score, Machine Availability, Downtime Hours, Units per Machine Hr, Batches Run, Value per Unit, Cost per Unit, Production Cost and Raw Material Cost. Every card carries a month-on-month delta and a 12-month sparkline.
🎛️ Five slicers on every page. Date Range, Plant, Production Line and Product Category repeat throughout, and each page adds one contextual slicer — Batch Status on the overview, Shift on Production Trends, Supervisor on Plants & Lines, Material Grade on Product Mix and Batch Status again on Quality & Cost.
🏭 Four plants and four named production lines. Riverton, Lakeside, Brookfield and Northgate plants are split across Line A – Pressing, Line B – Coating, Line C – Extrusion and Line D – Finishing, so output, availability and value can be compared line by line as well as site by site.
🧱 Six flooring product categories and three material grades. Engineered Wood, Vinyl Plank, Hardwood Plank, Laminate Flooring, Ceramic Tile and Carpet Tile are each measured for units, value per unit and gross margin, and every unit is graded Standard, Premium or Commercial.
📈 Three built-in scorecard tables. A Production Line Scorecard, a Product Category Scorecard and a Plant Quality Scorecard each combine hard numbers with an in-row data bar, so the weakest line, the thinnest-margin category and the worst-performing plant are visible without reading a single chart.
🧮 A model you can edit. The .pbix ships with its DAX measures intact and the sample Data.xlsx alongside it, so you can rename a plant, add a seventh category or repoint the queries at your own export without rebuilding a single visual.
📦 What Is Inside the Flooring Materials Manufacturing Dashboard
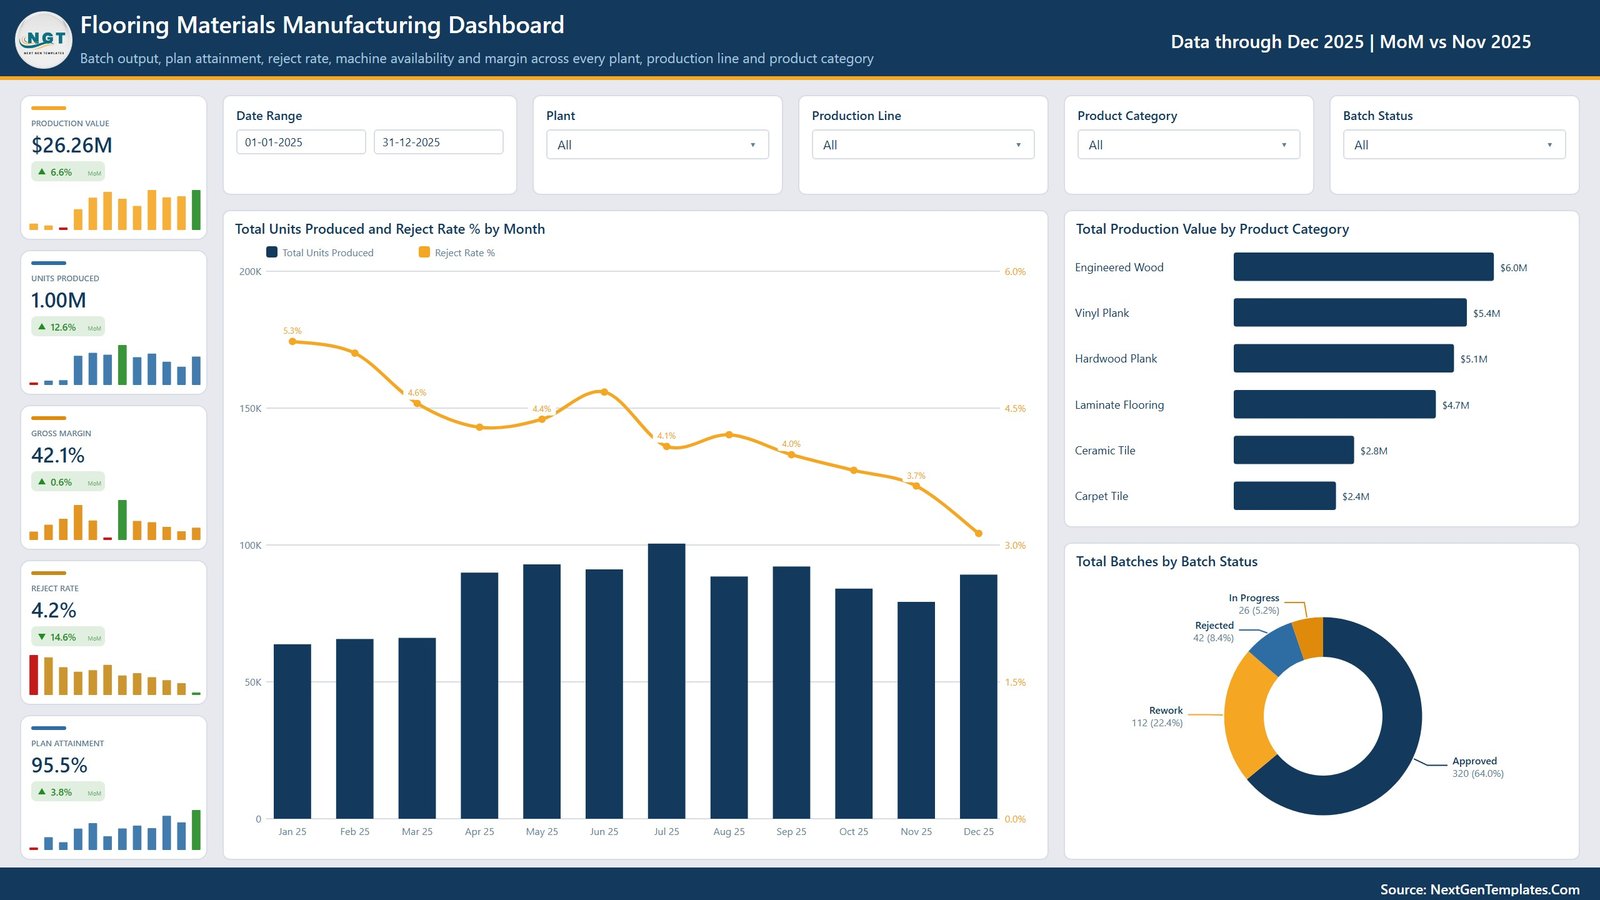
Page 1: Flooring Materials Manufacturing Dashboard (Overview)
The landing page carries Production Value ($26.26M), Units Produced (1.00M), Gross Margin (42.1%), Reject Rate (4.2%) and Plan Attainment (95.5%), each with a month-on-month delta against November 2025. Charts are Total Units Produced and Reject Rate % by Month, Total Production Value by Product Category, and Total Batches by Batch Status — which splits the 500 sample batches into 320 Approved, 112 Rework, 42 Rejected and 26 In Progress.
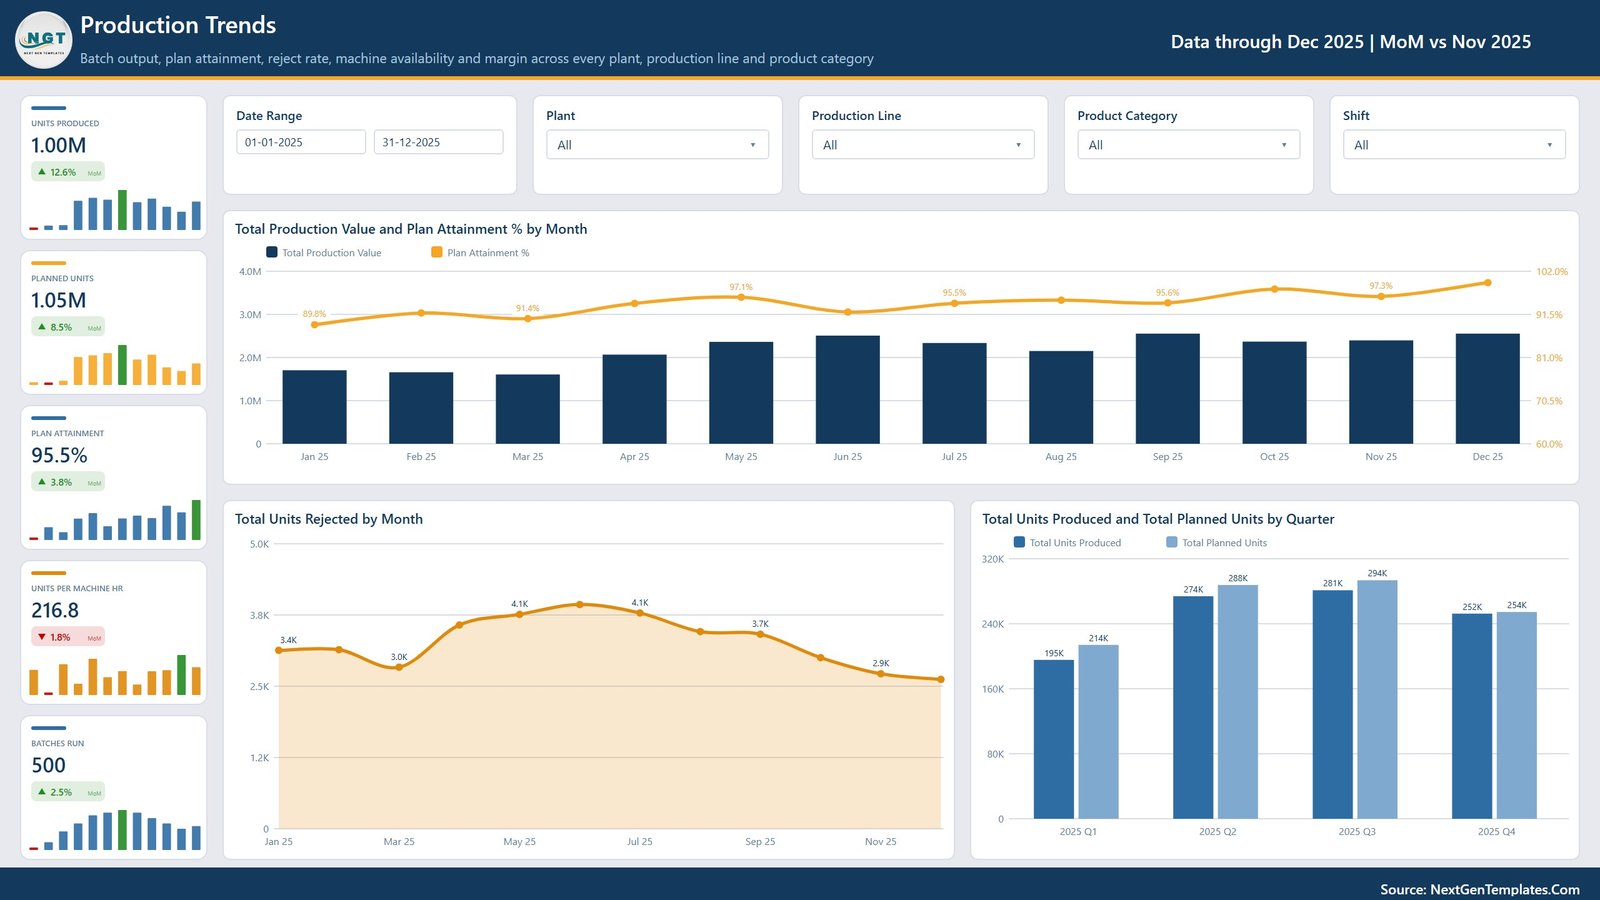
Page 2: Production Trends
This page compares what was planned against what was made: Units Produced, Planned Units (1.05M), Plan Attainment, Units per Machine Hr (216.8) and Batches Run (500). Charts are Total Production Value and Plan Attainment % by Month, Total Units Rejected by Month, and Total Units Produced and Total Planned Units by Quarter — where the sample data shows Q1 at 195K against a 214K plan, closing to 252K against 254K by Q4.
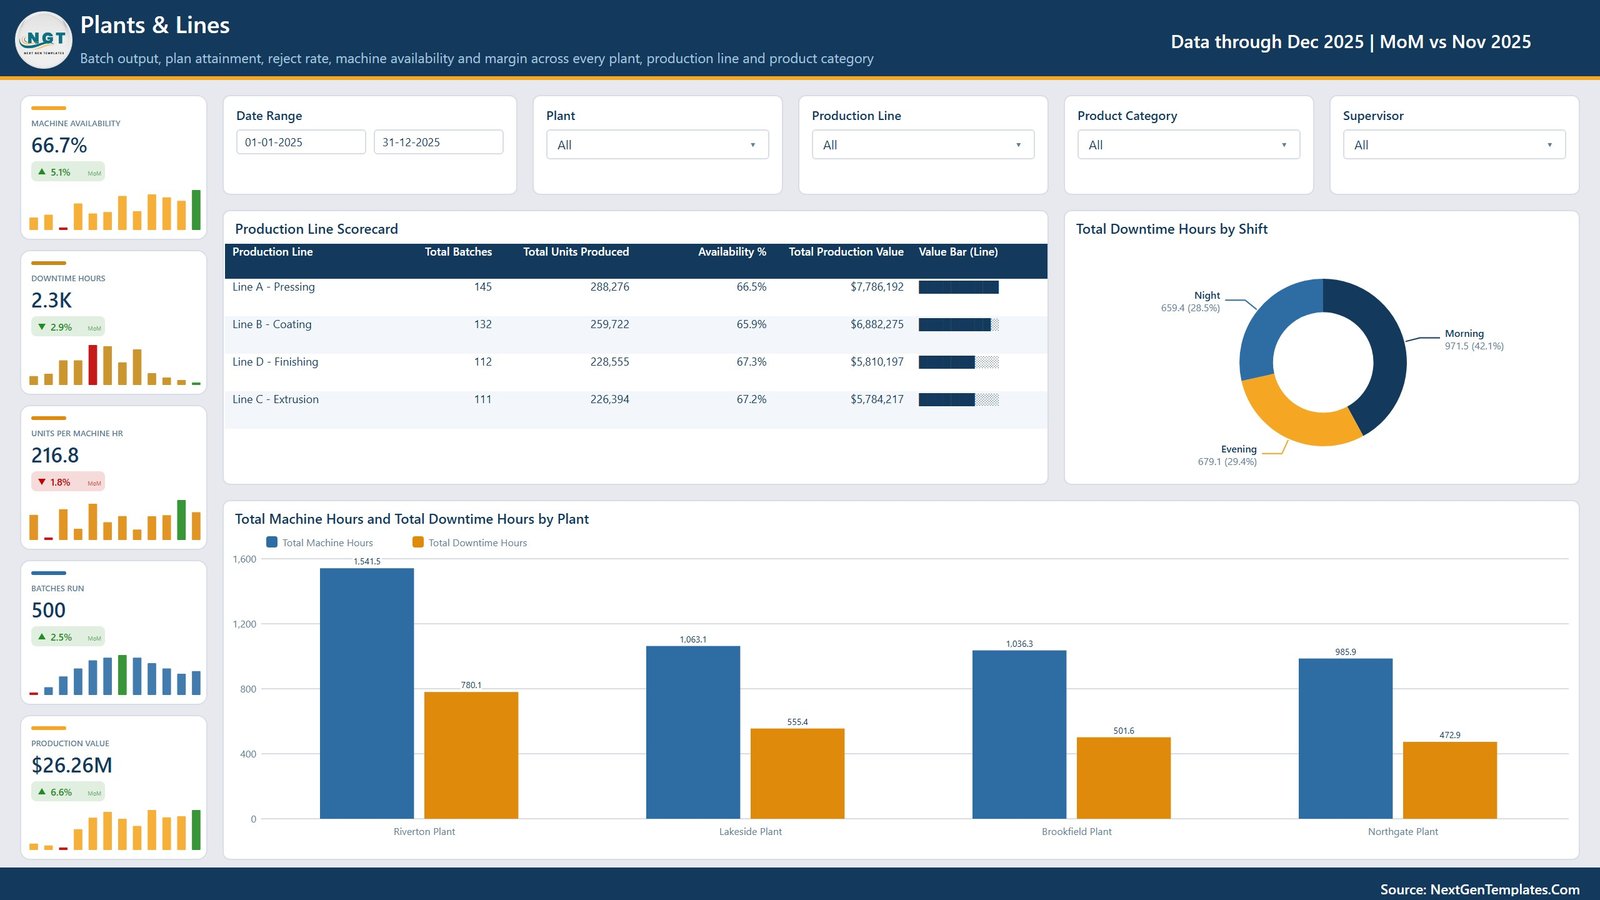
Page 3: Plants & Lines
The asset view reports Machine Availability (66.7%), Downtime Hours (2.3K), Units per Machine Hr, Batches Run and Production Value, sliced by Supervisor. It holds the Production Line Scorecard — batches, units, availability % and production value for all four lines — plus Total Downtime Hours by Shift and Total Machine Hours and Total Downtime Hours by Plant, which shows Riverton carrying 1,541.5 machine hours against 780.1 hours of downtime.
Page 4: Product Mix
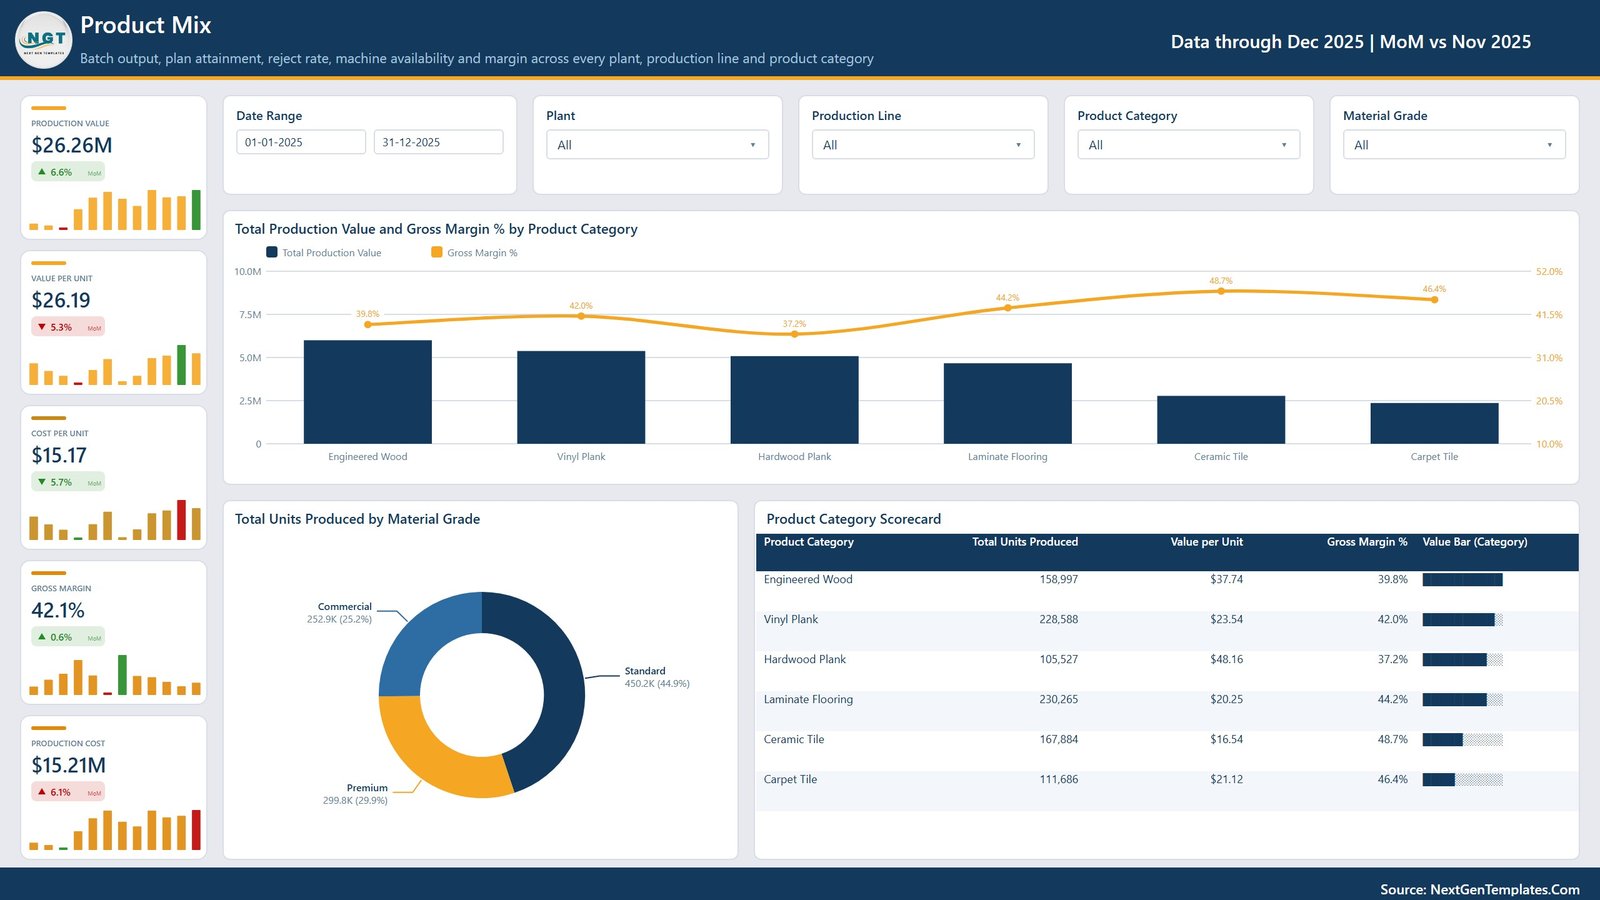
The margin page pairs Production Value with Value per Unit ($26.19), Cost per Unit ($15.17), Gross Margin and Production Cost ($15.21M), sliced by Material Grade. Charts are Total Production Value and Gross Margin % by Product Category, Total Units Produced by Material Grade, and a Product Category Scorecard — where Ceramic Tile earns the best margin at 48.7% while Hardwood Plank sits lowest at 37.2% despite the highest value per unit ($48.16).
Page 5: Quality & Cost
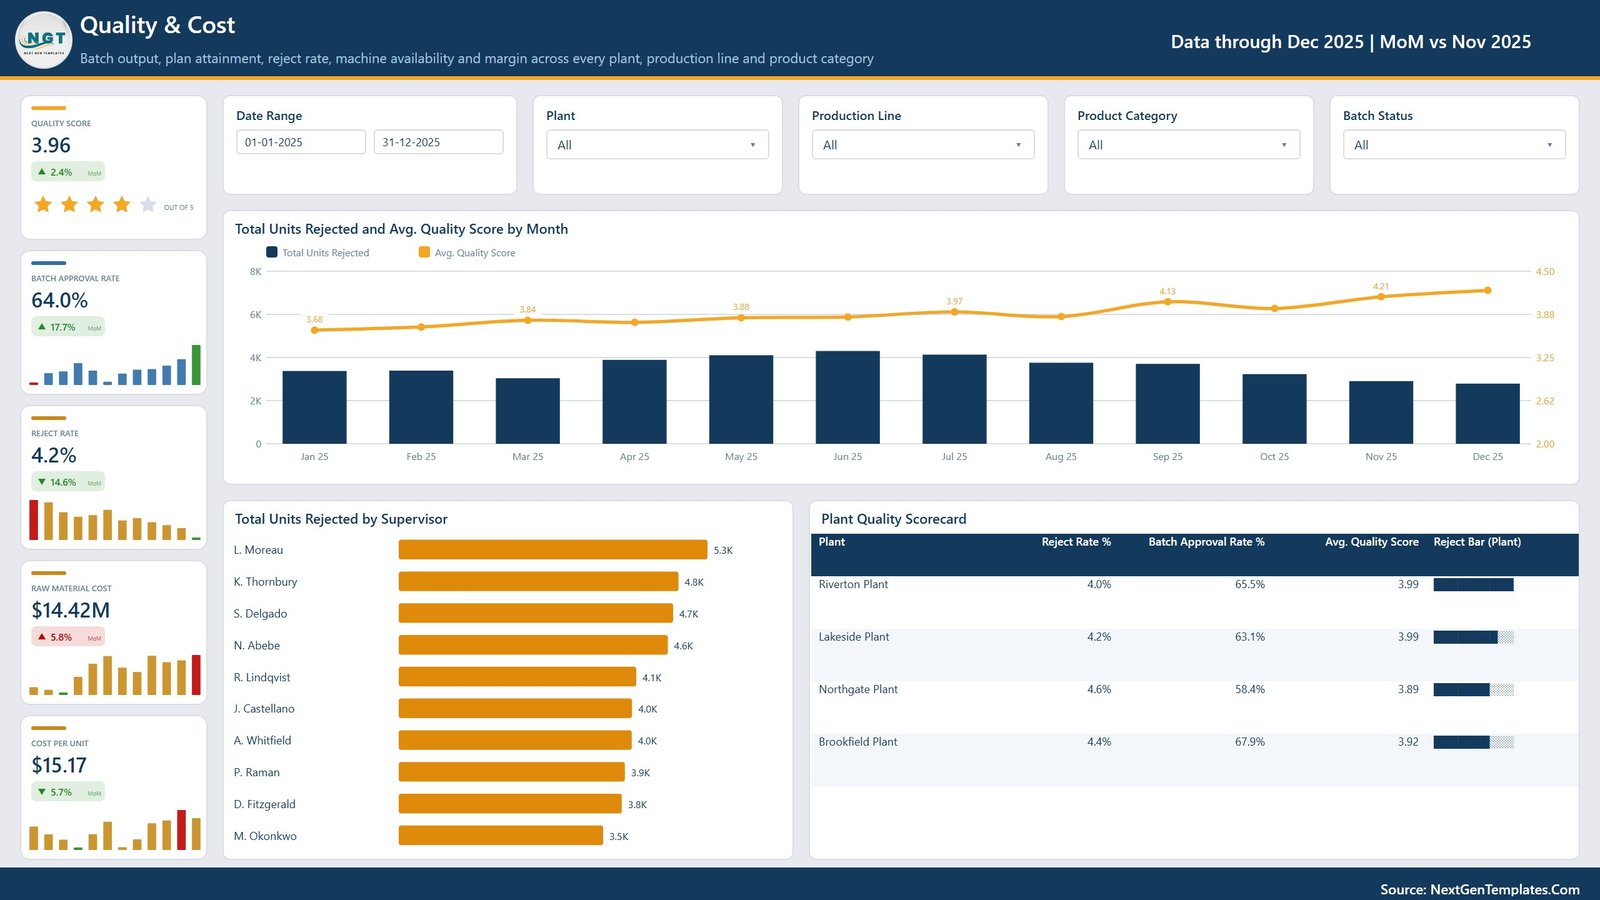
The quality page reports an Avg. Quality Score of 3.96 out of 5 on a star card, Batch Approval Rate (64.0%), Reject Rate, Raw Material Cost ($14.42M) and Cost per Unit. Charts are Total Units Rejected and Avg. Quality Score by Month, Total Units Rejected by Supervisor across ten named supervisors, and a Plant Quality Scorecard — which puts Northgate at the worst reject rate (4.6%) and the lowest approval rate (58.4%).
📊 Flooring Materials Manufacturing Dashboard in Power BI vs. Tableau / Qlik vs. Paid MES Analytics
| Feature | This Power BI Template | Tableau / Qlik Sense | Paid MES Analytics (Tulip, Sight Machine) |
|---|---|---|---|
| Cost | $17.99 one-time ✅ | $70-115 / user / month | $1,000-10,000+ / site / month |
| Platform | Power BI Desktop, free ✅ | Paid desktop plus server licence | Vendor cloud, annual contract |
| Setup time | Under 15 minutes ✅ | Days to build from scratch | Weeks of implementation |
| Report pages included | 5 pages, 15 visuals, ready built ✅ | Blank canvas | Vendor templates, locked |
| Editable measures and visuals | Fully open ✅ | Open, but you build it | Vendor controlled |
| Per-user fees as the team grows | None ✅ | Per named user | Per seat plus per machine |
| Live shop-floor data capture | No — you supply the export | No — connector only | Yes ✅ |
| Mobile viewing | Power BI mobile app, with a Pro workspace | Vendor mobile app | Vendor mobile app |
| Year-1 cost at 5 users | $17.99 ✅ | $4,200-6,900 | $12,000-120,000 |
For a flooring plant that wants plant, line and margin reporting this week without signing an MES contract, this template sits in the sweet spot — buy the reporting layer, keep your existing data capture.
👥 Who This Template Is For — and Who It Is Not For
✅ Built for:
- Production and plant managers at flooring, tile and building-materials manufacturers running 1-10 sites
- Operations analysts who already export batch data to Excel or CSV and need a reporting layer over it
- Quality managers tracking reject rate, batch approval and quality score by plant and supervisor
- Power BI learners who want a finished, realistic manufacturing model to take apart and study
- Consultants preparing a plant-performance pack for a client review
❌ Not for:
- Teams needing live machine telemetry, OEE calculated from PLC tags, or real-time andon — this file reports on data you give it
- Anyone expecting a regulated quality-management system of record for ISO or CE batch release
- Mac-only or browser-only users — authoring needs Power BI Desktop, which is Windows-only
- Buyers who want an Excel workbook rather than a .pbix — see the Excel edition linked below instead
⚙️ How to Use the Flooring Materials Manufacturing Dashboard in Power BI
- Download and unzip the file, then install Power BI Desktop free from Microsoft if you do not already have it.
- Open the .pbix file. All five pages render immediately from the bundled sample data — nothing to configure first.
- Click through the slicers on each page to see how Plant, Production Line, Product Category and the page-specific slicer cross-filter every visual.
- Open the included
Data.xlsxand replace the sample rows with your own batch export, keeping the column headers exactly as they are. - Back in Power BI Desktop, use Transform data to repoint the source at your file, then press Refresh.
- Rename plants, lines, categories and grades to match your own site, and publish to your Power BI workspace if you want to share it.
💼 Real-World Use Cases
Marcus is plant manager at a four-site laminate and vinyl manufacturer. He opens the Plants & Lines page before every Monday production meeting, reads the Production Line Scorecard to see which line lost availability last week, and pulls the Total Machine Hours and Total Downtime Hours by Plant chart straight into his slide deck — replacing the two hours his analyst used to spend rebuilding it in Excel.
Priya runs quality for a ceramic and carpet tile producer. She filters the Quality & Cost page to a single plant and supervisor, watches Reject Rate against Avg. Quality Score month by month, and uses the Plant Quality Scorecard to justify where the next round of operator training goes — without paying per-seat for an analytics platform she would use four days a month.
Daniel is a commercial analyst at a hardwood and engineered-wood group. He lives on the Product Mix page, comparing Value per Unit and Gross Margin % across the six categories, and was able to show his board that Ceramic Tile delivers the strongest margin at 48.7% even though Hardwood Plank carries the highest price per unit.
❓ Frequently Asked Questions
What KPIs does this flooring manufacturing dashboard track?
It reports 16 distinct KPIs across 25 card slots: Production Value, Units Produced, Planned Units, Plan Attainment, Gross Margin, Reject Rate, Batch Approval Rate, Quality Score, Machine Availability, Downtime Hours, Units per Machine Hr, Batches Run, Value per Unit, Cost per Unit, Production Cost and Raw Material Cost — each with a month-on-month delta.
Do I need a paid Power BI licence to use it?
No. The Flooring Materials Manufacturing Dashboard in Power BI opens and refreshes in Power BI Desktop, which Microsoft gives away free. A paid Power BI Pro licence is only needed if you want to publish the report to a shared workspace or view it in the mobile app.
How long does setup take?
Under 15 minutes. The file opens with sample data already loaded, so you can explore all five pages immediately. Swapping in your own data means pasting your batch export into the supplied Data.xlsx, repointing the query and pressing Refresh.
Does it connect to my MES or ERP system?
Not out of the box. This is a reporting template that reads a flat data file, not a production-control system. If your MES or ERP can export batch, machine-hour and cost data to Excel or CSV, you can map it to the supplied columns and refresh — but the template ships with fictional sample data only.
How does this compare to a paid MES analytics platform?
MES platforms such as Tulip or Sight Machine capture live machine data and cost thousands per site per month. This template does not capture anything — it reports on data you already have, for a single one-time payment, which suits plants whose telemetry problem is already solved and whose reporting problem is not.
Is there an Excel version of the same dashboard?
Yes. The Flooring Materials Manufacturing Dashboard in Excel covers the same flooring-plant topic in a workbook rather than a .pbix. The two builds differ in structure — the Excel edition is a workbook with its own sheet layout, while this one is a five-page Power BI report model with DAX measures.
Can I add a plant, a line or a product category?
Yes. Plants, production lines, product categories, material grades, shifts and supervisors are all data values rather than hard-coded visuals, so adding a fifth plant or a seventh category is a matter of adding rows to Data.xlsx and refreshing. No visual needs rebuilding.
👤 About the Author
Built by PK — Microsoft Certified Professional with 15+ years of Excel, Google Sheets and Power BI experience. Founder of NextGenTemplates, reaching 300K+ subscribers across YouTube channels (@PKAnExcelExpert, @NextGenTemplates). Every template is hand-built and tested before release.
🔗 Explore Related Templates
🔄 Also available as: Flooring Materials Manufacturing Dashboard in Excel — the same flooring-plant subject in a workbook, for teams without Power BI Desktop.
🏭 Digital Twins in Manufacturing Dashboard in Power BI — simulation and asset-twin reporting for plants moving beyond batch reporting.
🧩 ERP Systems Dashboard in Power BI — module adoption, data quality and rollout reporting for manufacturers standing up an ERP.
🪟 Glass Installation KPI Dashboard in Power BI — a neighbouring building-materials report for installation rather than production teams.
💎 Manufacturing Business Plan Templates Kit — 19 planning files for the commercial side of the same plant.
Browse the full range of Power BI Dashboard Templates or the wider Power BI Templates library.
📖 Click here to read the Detailed Blog Post
🎥 Visit our YouTube channel for step-by-step video tutorials
👉 YouTube.com/@NextGenTemplates
📅 Last updated: September 2026




















Reviews
There are no reviews yet.