

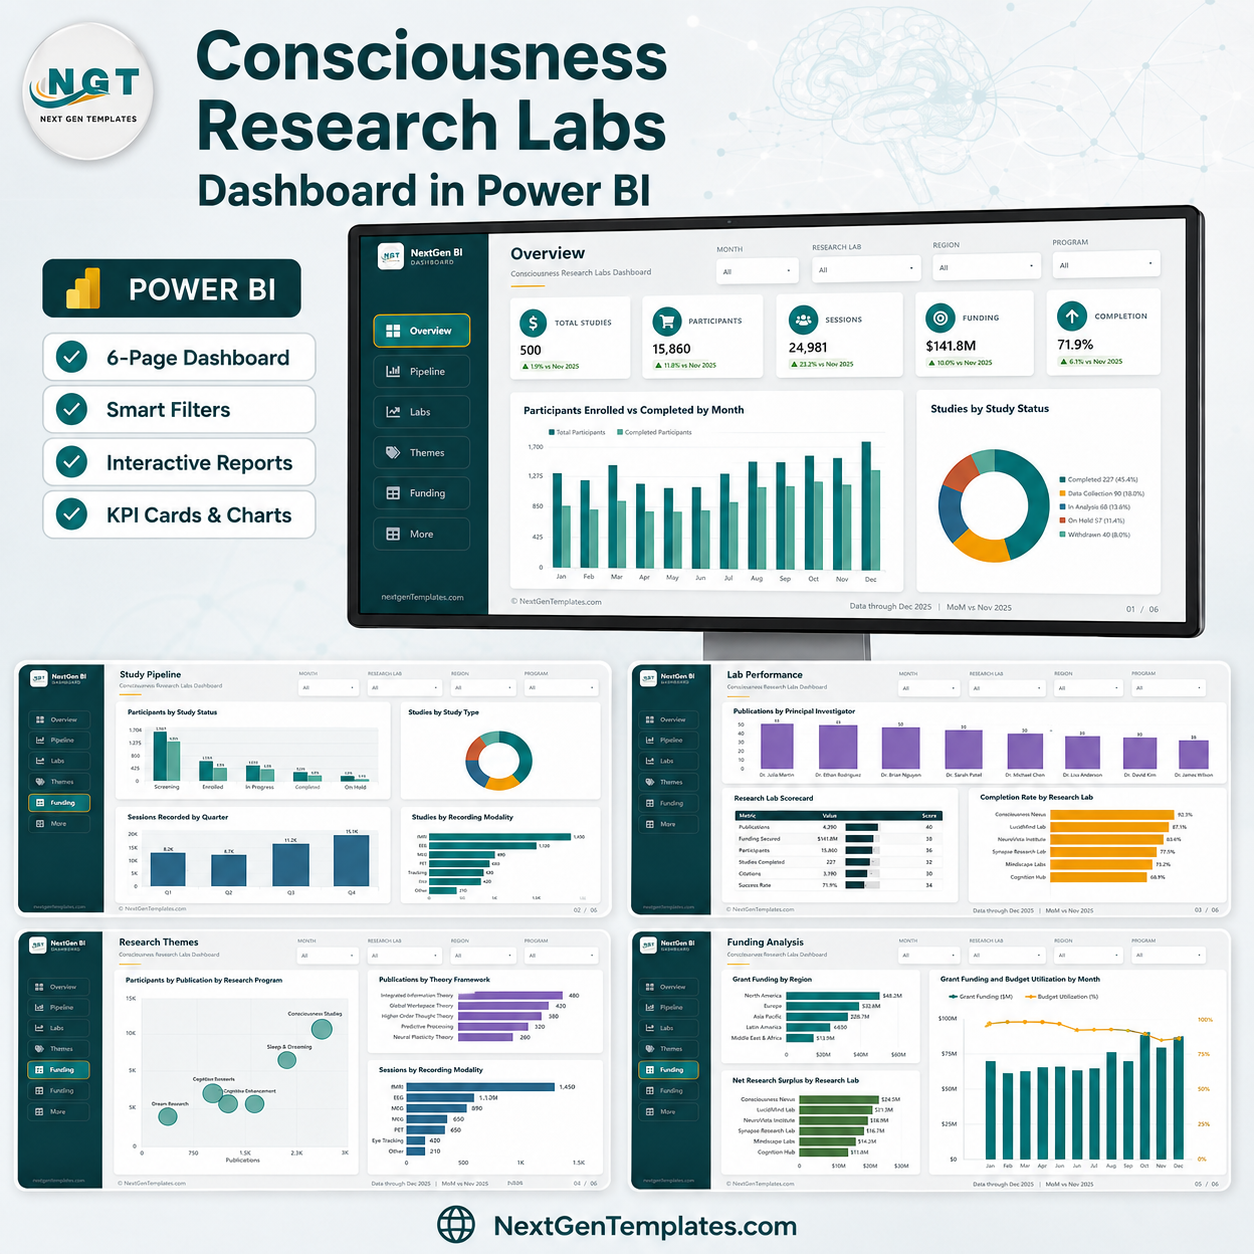

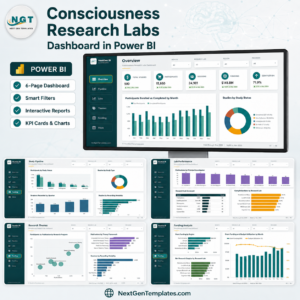
The Consciousness Research Labs Dashboard in Power BI turns 500 study records into nine report pages, five SVG KPI cards, a seven-lab scorecard and a study-level drillthrough – delivered as an editable .pbix you open in free Power BI Desktop. The demo portfolio ships with 500 studies, 15,860 enrolled participants, 24,981 recording sessions, $141.8M of grant funding and a 71.9% completion rate, so every visual is populated the moment the file opens. Built by PK, a Microsoft Certified Professional whose templates reach 300K+ subscribers across the NextGenTemplates YouTube channels. One-time payment, lifetime use, and a Power BI Dashboard User Manual PDF is included in the download.
Read this first. This is a reporting and visualisation template. It charts the study, session, publication and funding numbers that you type or import. It is not an electronic case report form, not a LIMS, not an eCRF and not a system of record for a regulated trial. It connects to no EEG, fMRI or MEG instrument, collects no participant data, and nothing in it is clinical, ethical or regulatory advice.
Which one is this? NextGenTemplates ships two different Power BI lines with similar names. This is the analytical dashboard – five wide analysis pages, cross-filtering visuals, four synced slicers on every page and a hidden Study Details drillthrough. It is not the Power BI KPI-scorecard line, which is a separate template built around a month picker, target-versus-actual traffic lights and a KPI Trend page. If you want to explore a research portfolio by lab, programme, modality, theory framework and principal investigator, this is the one.
Prefer Excel? The same dashboard ships as a workbook: Consciousness Research Labs Dashboard in Excel – same 500-study dataset, same five analysis pages, plain pivot tables and slicers instead of a semantic model.
Key Features of the Consciousness Research Labs Dashboard in Power BI
- Nine pages in one .pbix – Overview, Study Pipeline, Lab Performance, Research Themes and Funding Analysis, plus a Get More Dashboards page, a hidden Study Details drillthrough and two hover tooltip pages (Category Detail and Trend Detail, both 280×360).
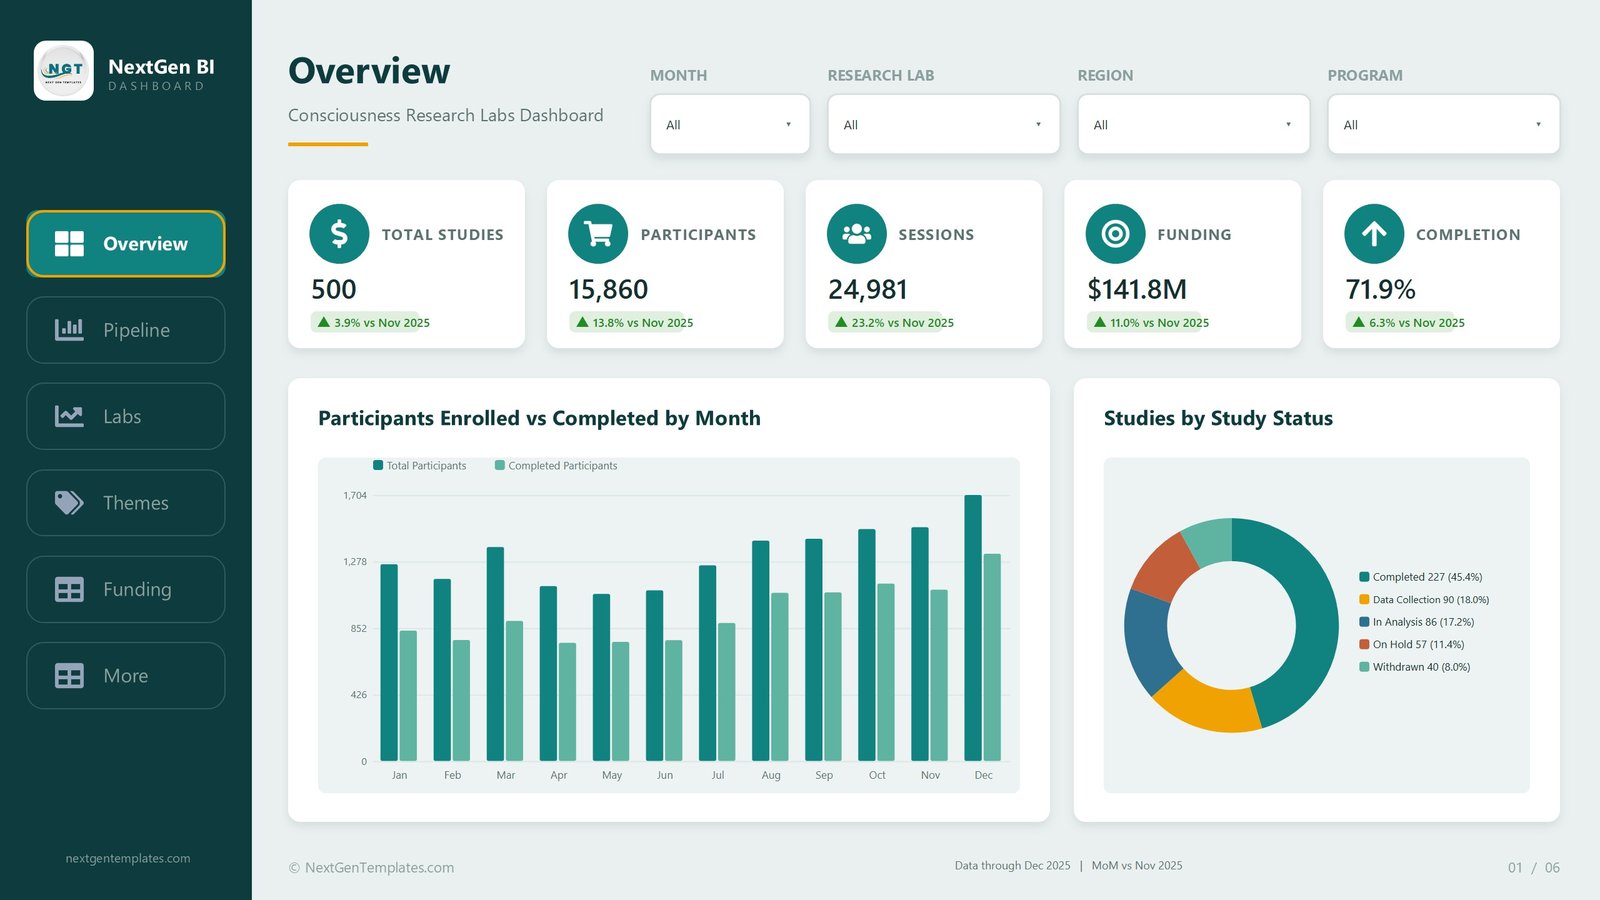
- Five SVG KPI cards on the Overview page – Total Studies, Participants, Sessions, Funding and Completion. Each one carries the value, a month-on-month delta against November 2025 and a 12-month sparkline drawn inside the card.
- 39 DAX measures grouped into display folders, including Total Studies, Total Participants, Completed Participants, Completion Rate %, Total Sessions, Total Publications, Total Grant Funding, Net Research Surplus, Budget Utilisation % and Avg. Data Quality.
- Four slicers synced across every page – Month, Research Lab, Region and Program. One selection re-scopes the whole report, including the drillthrough.
- A Study Details drillthrough bound on eight fields: Research Lab, Region, Research Program, Recording Modality, Theory Framework, Principal Investigator, Study Type and Study Status. Right-click any bar, slice, bubble or table row to land on the underlying study records.
- Two tooltip report pages that render on hover in place of the default value bubble – one for category breakdowns, one for trends.
- A seven-lab scorecard table with an in-cell session volume bar and an average data-quality score per lab.
- 500 demo study rows across 19 columns – Study ID, Session Date, Research Lab, Region, Research Program, Recording Modality, Theory Framework, Principal Investigator, Study Type, Study Status, Participants Enrolled, Participants Completed, Sessions Recorded, Recording Hours, Analysis Days, Grant Funding, Operating Cost, Publications Output and Data Quality Score – spanning 1 January to 31 December 2025, plus a generated Date table for month, quarter and year-month grouping.
- Custom NGT theme – a deep teal and amber palette applied through a theme file, with a left navigation rail, the logo on every page and a source footer.
- Fully editable – open it in free Power BI Desktop, point the query at your own Excel file, rename the labs, recolour the theme, add a page. Nothing is locked or password protected.
What’s Inside the Consciousness Research Labs Dashboard in Power BI
1. Overview
Five KPI cards head the page: Total Studies 500 (up 3.9% month on month), Participants 15,860 (up 13.8%), Sessions 24,981 (up 23.2%), Funding $141.8M (up 11.0%) and Completion 71.9% (up 6.3%). Below them, Participants Enrolled vs Completed by Month pairs two columns for each of the twelve months, climbing to a December peak of 1,704 enrolled against roughly 1,320 completed – the widening gap through the second half of the year is the recruitment story in one picture. To its right, Studies by Study Status is a donut that splits the portfolio into Completed 227 (45.4%), Data Collection 90 (18.0%), In Analysis 86 (17.2%), On Hold 57 (11.4%) and Withdrawn 40 (8.0%).
2. Study Pipeline
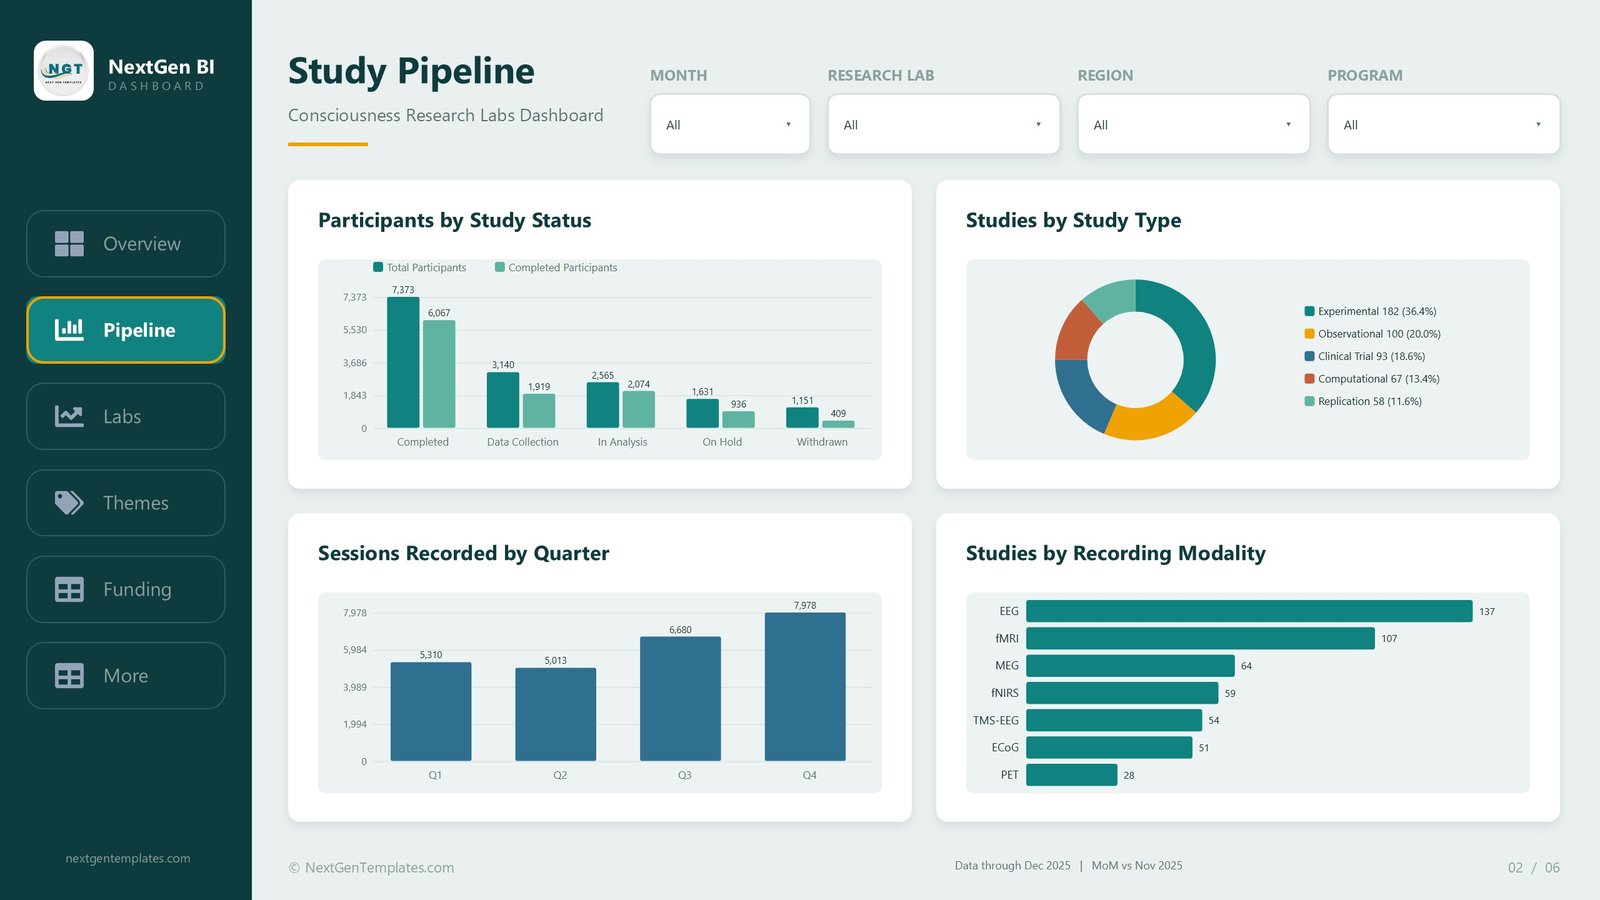
Where the portfolio actually stands. Participants by Study Status puts enrolled next to completed for each status – Completed 7,373 against 6,067, Data Collection 3,140 against 1,919, In Analysis 2,565 against 2,074, On Hold 1,631 against 936 and Withdrawn 1,151 against 409. Studies by Study Type is a donut reading Experimental 182 (36.4%), Observational 100 (20.0%), Clinical Trial 93 (18.6%), Computational 67 (13.4%) and Replication 58 (11.6%). Sessions Recorded by Quarter runs Q1 5,310, Q2 5,013, Q3 6,680 and Q4 7,978, and Studies by Recording Modality ranks EEG 137, fMRI 107, MEG 64, fNIRS 59, TMS-EEG 54, ECoG 51 and PET 28.
3. Lab Performance
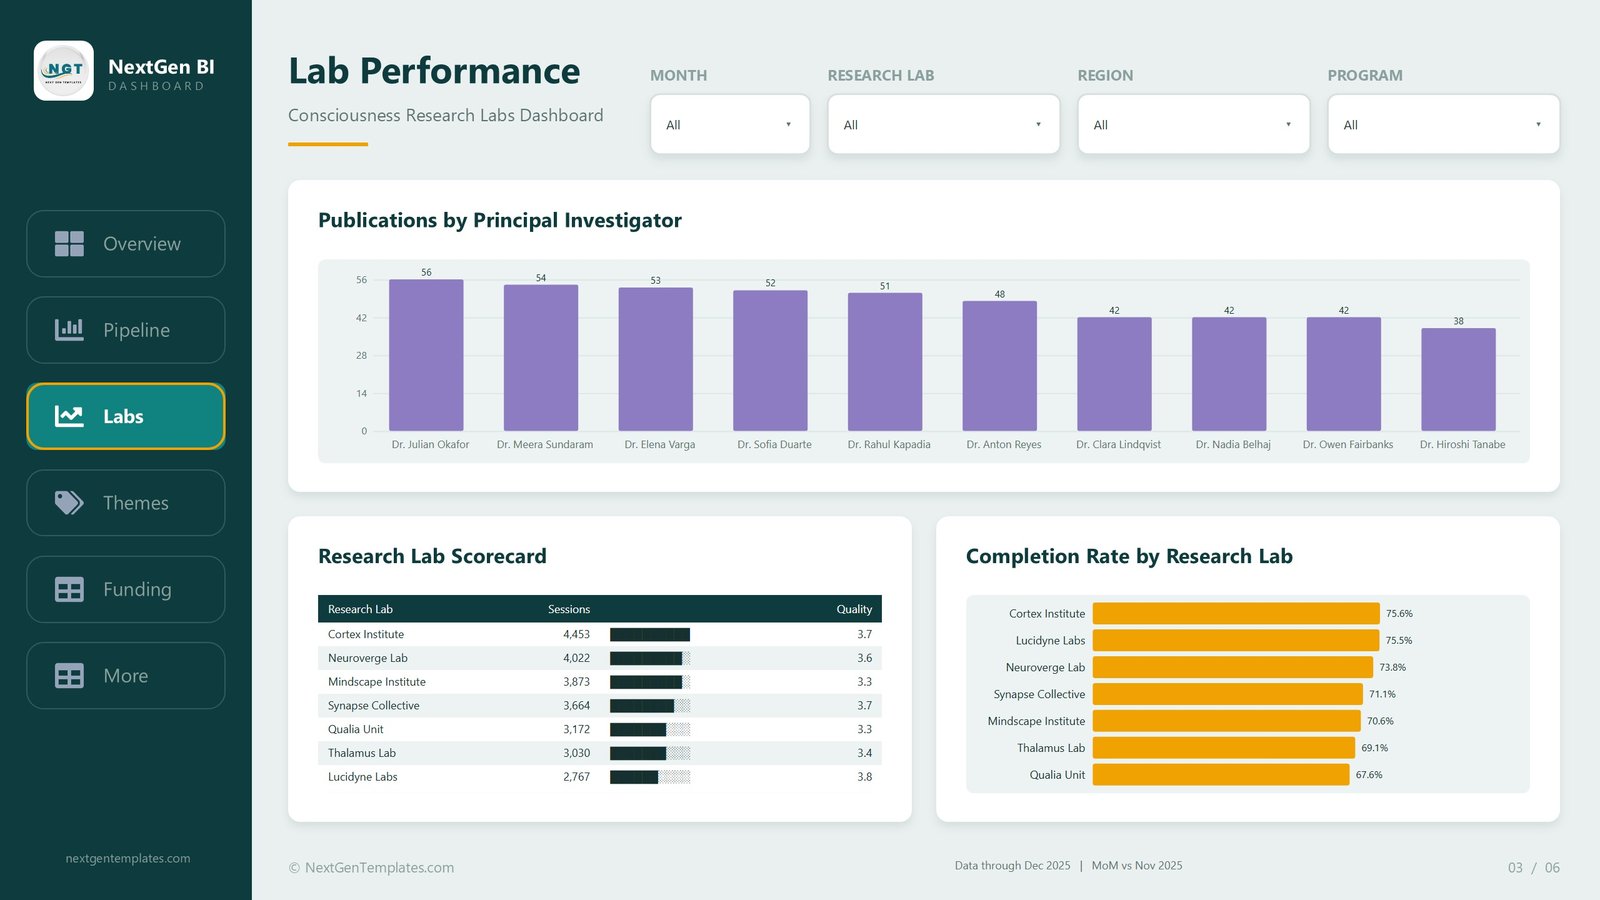
The league table. Publications by Principal Investigator ranks all ten demo PIs across the top of the page, from Dr. Julian Okafor on 56 down to Dr. Hiroshi Tanabe on 38. The Research Lab Scorecard lists each lab with its session count, a proportional in-cell volume bar and an average quality score: Cortex Institute 4,453 sessions at 3.7, Neuroverge Lab 4,022 at 3.6, Mindscape Institute 3,873 at 3.3, Synapse Collective 3,664 at 3.7, Qualia Unit 3,172 at 3.3, Thalamus Lab 3,030 at 3.4 and Lucidyne Labs 2,767 at 3.8 – the smallest lab scoring the highest on quality is exactly the sort of thing a volume-only report hides. Completion Rate by Research Lab closes the page: Cortex Institute 75.6%, Lucidyne Labs 75.5%, Neuroverge Lab 73.8%, Synapse Collective 71.1%, Mindscape Institute 70.6%, Thalamus Lab 69.1% and Qualia Unit 67.6%.
4. Research Themes
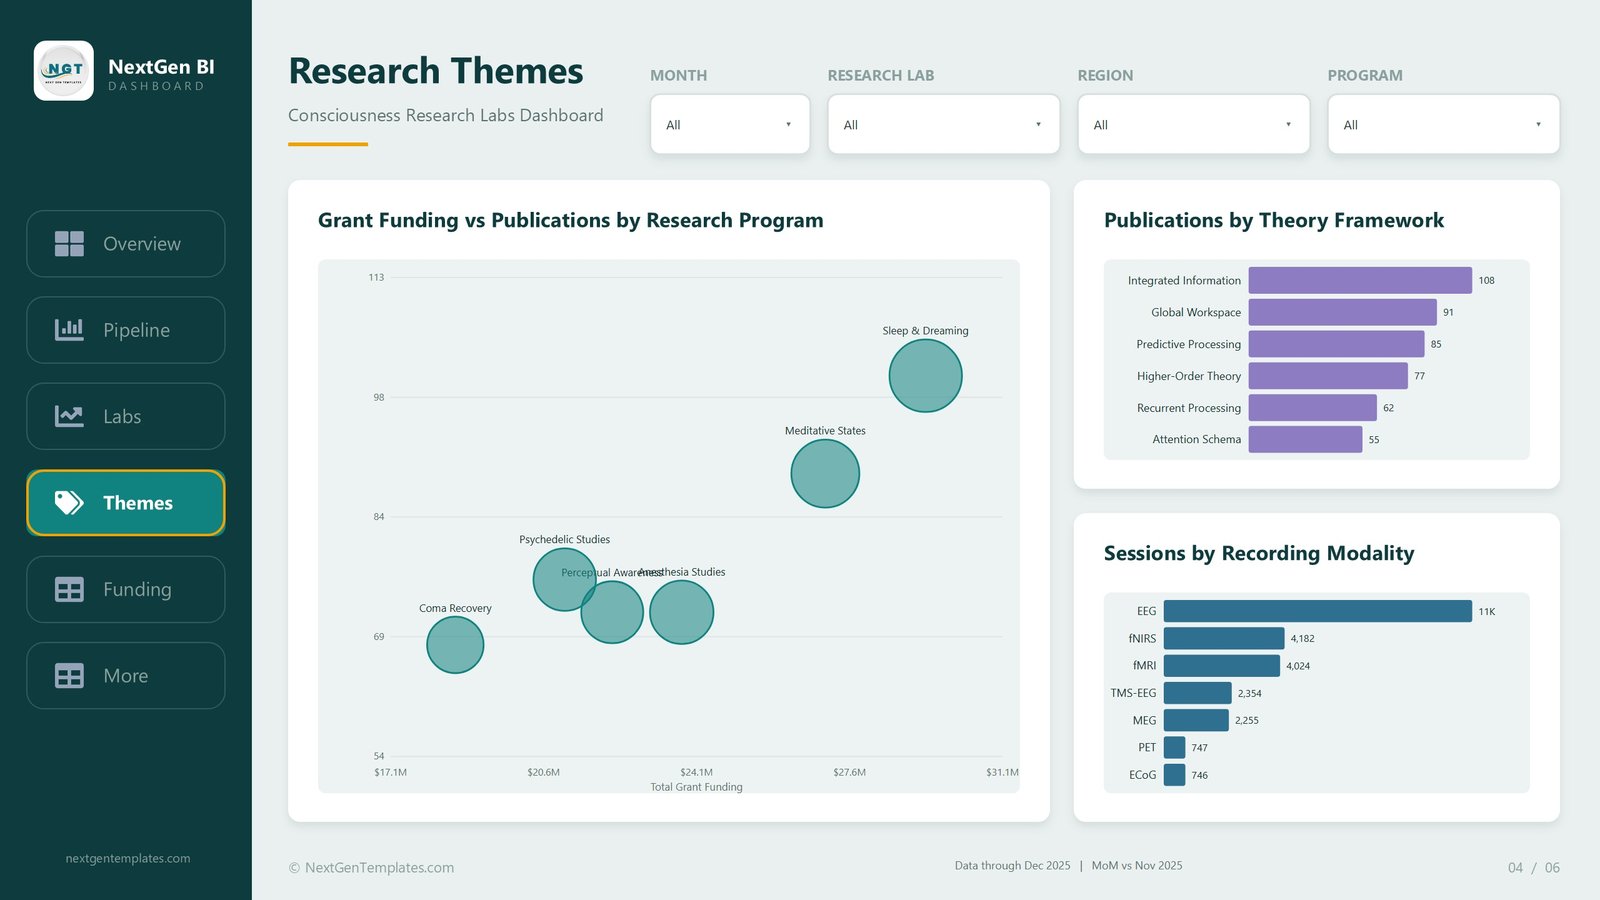
The science view. Grant Funding vs Publications by Research Program is a bubble chart plotting money against output: Sleep & Dreaming sits top right on the highest funding and the highest publication count, Meditative States follows, and Coma Recovery anchors the bottom left. Psychedelic Studies, Perceptual Awareness and Anesthesia Studies cluster in the middle, which is where the interesting cost-per-publication conversations start. Publications by Theory Framework ranks Integrated Information 108, Global Workspace 91, Predictive Processing 85, Higher-Order Theory 77, Recurrent Processing 62 and Attention Schema 55. Sessions by Recording Modality makes the EEG dominance obvious – 11K sessions against fNIRS 4,182, fMRI 4,024, TMS-EEG 2,354, MEG 2,255, PET 747 and ECoG 746.
5. Funding Analysis
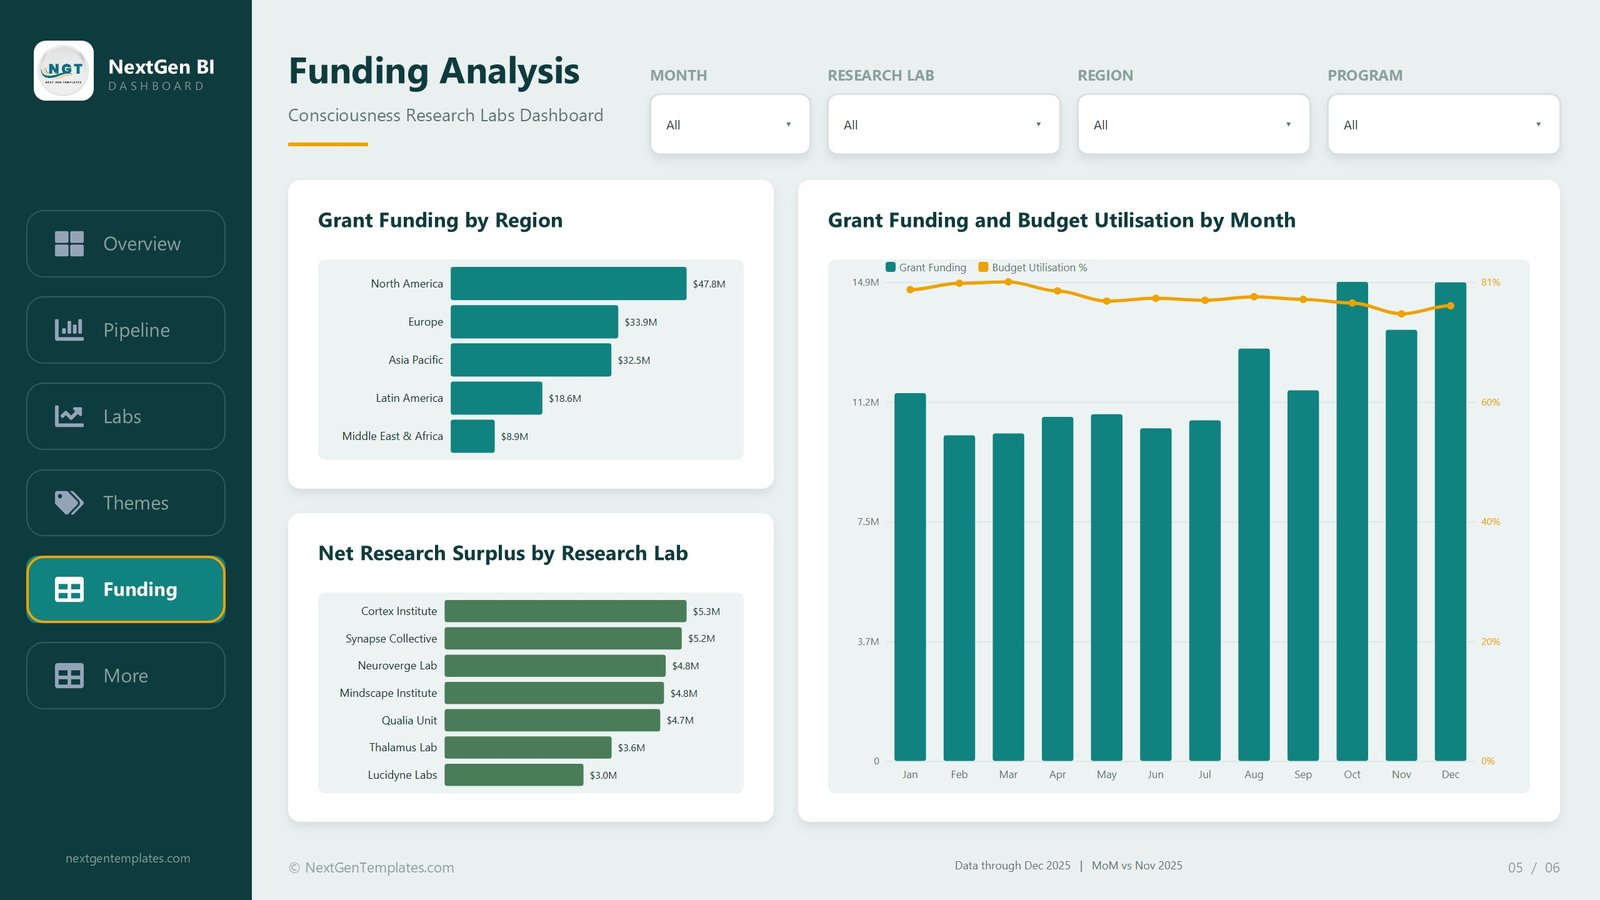
The money. Grant Funding by Region runs North America $47.8M, Europe $33.9M, Asia Pacific $32.5M, Latin America $18.6M and Middle East & Africa $8.9M. Net Research Surplus by Research Lab ranks Cortex Institute $5.3M, Synapse Collective $5.2M, Neuroverge Lab $4.8M, Mindscape Institute $4.8M, Qualia Unit $4.7M, Thalamus Lab $3.6M and Lucidyne Labs $3.0M. The page’s widest visual, Grant Funding and Budget Utilisation by Month, is a combo chart: monthly grant funding columns climb from roughly $11.2M in January to a $14.9M autumn peak, while the budget utilisation line sits in the high seventies all year, touching 81% early on and easing back by December. Funding rising while utilisation flattens is the shape a finance officer wants to see, and this is the page that proves it.
6. Get More Dashboards, and the three hidden pages
Page six is an NGT catalogue page listing other Power BI dashboards and services – delete it in seconds if you are handing the file to a funder or a client. Behind the visible pages sit a hidden Study Details drillthrough bound on eight fields and two 280×360 tooltip pages that render on hover instead of the default value bubble.
Consciousness Research Labs Dashboard in Power BI vs. Excel vs. Paid Research Platforms – Where This Fits
| This template (Power BI) | Excel build | Paid research platform | |
|---|---|---|---|
| Cost | $17.99 one time | $17.99 one time | $3,000 to $25,000 per year |
| Software needed | Power BI Desktop (free, Windows) | Excel 2016+ or Microsoft 365, Windows or Mac | Vendor cloud |
| Setup time | Under 15 minutes – repoint the source and refresh | Under 20 minutes | 6 to 12 weeks with onboarding |
| Drillthrough to underlying study records | Yes – on 8 fields | No | Yes |
| Hover tooltip pages | Yes – two | No | Varies |
| Cross-filtering between visuals | Yes, click any element | Via slicers only | Yes |
| Row capacity | Millions – a compressed columnar model | Tens of thousands comfortably | Vendor limits |
| Customisable fields | Fully – all 19 columns are yours to rename | Fully | Vendor change request |
| Publishing to colleagues | Power BI Service (licence rules apply) or share the .pbix | OneDrive or SharePoint | Seat-based |
| Year-1 cost at 5 users | $17.99 total for the template | $17.99 total | $15,000+ |
| Live instrument or LIMS feed | No – you supply the export | No | Sometimes |
| System of record for a regulated trial | No | No | Yes, if validated |
Who This Template Is For – and Who It’s Not For
A good fit if you are a lab manager, research director, grants or finance officer, study coordinator or programme administrator at a consciousness, neuroscience or cognitive-science centre that already keeps study records in a spreadsheet and wants a board-ready, cross-filtering view of them. It suits multi-site centres running several programmes and modalities at once, and consultants who present portfolio performance to a funding committee each quarter.
Not a good fit if you need a live feed from an EEG rig, a scanner scheduler or a LIMS – this report visualises the export you supply, it does not gather it. It is also the wrong tool if you need participant-level clinical data capture, an audited system of record for a regulated trial, or a single-page scorecard with targets and traffic lights. And it needs Power BI Desktop, which is Windows only; if your team is on Mac, buy the Excel edition instead.
How to Use the Consciousness Research Labs Dashboard in Power BI
- Unzip the download. You get the .pbix report, the Data.xlsx source and a Power BI Dashboard User Manual PDF.
- Install Power BI Desktop if you do not have it – it is a free download from Microsoft and runs on Windows.
- Open the .pbix. All nine pages render straight away on the 500 demo study rows.
- Open Data.xlsx, delete the demo rows and paste your own study records under the same 19 headers. Keep the column order and the date format.
- Back in Power BI Desktop, use Transform data > Data source settings to point the query at your file, then press Refresh. Every card, chart and scorecard recalculates.
- Rename the label columns to match your centre – swap in your own lab names, research programmes, recording modalities, theory frameworks and principal investigators.
- Filter with the four slicers on any page, right-click a bar, bubble or table row and choose Drill through > Study Details to see the records behind it, and hover a chart element to raise a tooltip page.
Real-World Use Cases
A university consciousness centre reporting to its board. The director filters the Month slicer to Q4, opens Lab Performance, and shows that Cortex Institute converts 75.6% of enrolled participants while Qualia Unit sits at 67.6%. Right-clicking the Qualia bar drills through to the individual studies behind that number, so the conversation is about eleven specific protocols rather than a percentage.
A multi-site grant renewal. The finance officer works entirely on Funding Analysis: $47.8M of North American grant income, a budget utilisation line that never drops below the mid seventies, and a net surplus per lab that ranges from $5.3M down to $3.0M. That is the evidence section of the renewal document, exported as a PDF.
Scanner-time planning. On Hold studies had climbed to 57. The coordinator sliced by Recording Modality and found the queue was fMRI-heavy – 4,024 sessions against EEG’s 11K – which pointed at scanner availability rather than recruitment as the bottleneck.
Frequently Asked Questions
Is this a clinical data capture system?
No. It is a reporting and visualisation template. It charts the study counts, enrolment, sessions, publications, grant income and operating cost that you supply in a spreadsheet. It captures no participant data, holds no consent records, connects to no instrument, and is not an eCRF, a LIMS or a validated system of record for a regulated trial.
Do I need a Power BI Pro licence?
Not to use the file. Power BI Desktop is free and opens, edits and refreshes the .pbix on your own machine. A licence only comes into it if you want to publish the report to the Power BI Service and share it with colleagues – check Microsoft’s current licensing for that.
Does it run on a Mac?
Power BI Desktop is a Windows application, so the .pbix needs a Windows machine or a virtual one. If your team is Mac-based, the Consciousness Research Labs Dashboard in Excel covers the same five analysis pages and opens natively on macOS.
Is this the same as the Power BI KPI scorecard templates?
No – two different products. This is the analytical dashboard: five wide analysis pages, cross-filtering visuals, four synced slicers and a drillthrough, built for exploring a portfolio. The KPI-scorecard line uses a month picker, target-versus-actual traffic lights and a dedicated KPI Trend page. Buy whichever matches how you report.
Are the labs, programmes and investigators real?
No. Cortex Institute, Neuroverge Lab, Mindscape Institute, Synapse Collective, Qualia Unit, Thalamus Lab and Lucidyne Labs are invented names, and every principal investigator in the demo data is fictional. They exist so the visuals have something to rank. Replace them with your own, or delete the PI column if you would rather not report at investigator level.
The theory frameworks are named. Is the template built around them?
No. Integrated Information, Global Workspace, Predictive Processing, Higher-Order Theory, Recurrent Processing and Attention Schema are text labels in a column of sample data, chosen so the chart looks realistic. They encode no theoretical commitment and map to no methodology. Rename them freely.
What happens if I have more or fewer than 500 studies?
It does not matter. Put as many rows as you have under the headers and refresh. Power BI’s compressed model handles far more than a workbook would, and every measure and visual scales to whatever is loaded.
Can I add a lab, region or research programme of my own?
Yes. Type the new value into the source file and refresh – it appears in the slicers, the charts, the scorecard and the drillthrough automatically. No DAX editing needed.
What exactly do I get in the download?
A zip containing the .pbix report, the Data.xlsx source file and a Power BI Dashboard User Manual PDF. Lifetime use, unlimited machines, no subscription.
About the Author
Built by PK – Microsoft Certified Professional with 15+ years of Excel, Google Sheets, and Power BI experience. Founder of NextGenTemplates, reaching 300K+ subscribers across YouTube channels. Every template is hand-built and tested before release.
Explore Related Templates
- Consciousness Research Labs Dashboard in Excel – the same dashboard as a workbook, if your team lives in Excel rather than Power BI Desktop.
- Quantum Computing Labs Dashboard in Power BI – the closest sibling, for a physics lab portfolio.
- Machine Learning Labs Dashboard in Power BI – experiment tracking, compute cost and model output.
- Brain Computer Interfaces Dashboard in Power BI – the neurotechnology neighbour to this report.
- Laboratory Instruments Dashboard in Power BI – instrument utilisation and maintenance, if scanner time is your constraint.
- Clinical Data Management Dashboard in Power BI – query ageing and data-cleaning throughput.
- Precision Medicine Dashboard in Power BI – translational research reporting.
- Neural Tech Startups Dashboard in Power BI – the commercial side of neurotechnology.
Browse more in the Power BI Dashboard category, or see every Power BI template.
Get the Consciousness Research Labs Dashboard in Power BI today – $17.99 instead of $29.99, instant download, lifetime use, User Manual PDF included. Read the full walkthrough on the Consciousness Research Labs Dashboard in Power BI blog post.
Last updated: 23 August 2026.
Reporting and visualisation template only. This file is not an electronic case report form, a laboratory information management system, or a validated system of record for any regulated study, and nothing in it constitutes clinical, ethical or regulatory advice. All laboratory names, investigator names and figures shown are demonstration data.












Reviews
There are no reviews yet.