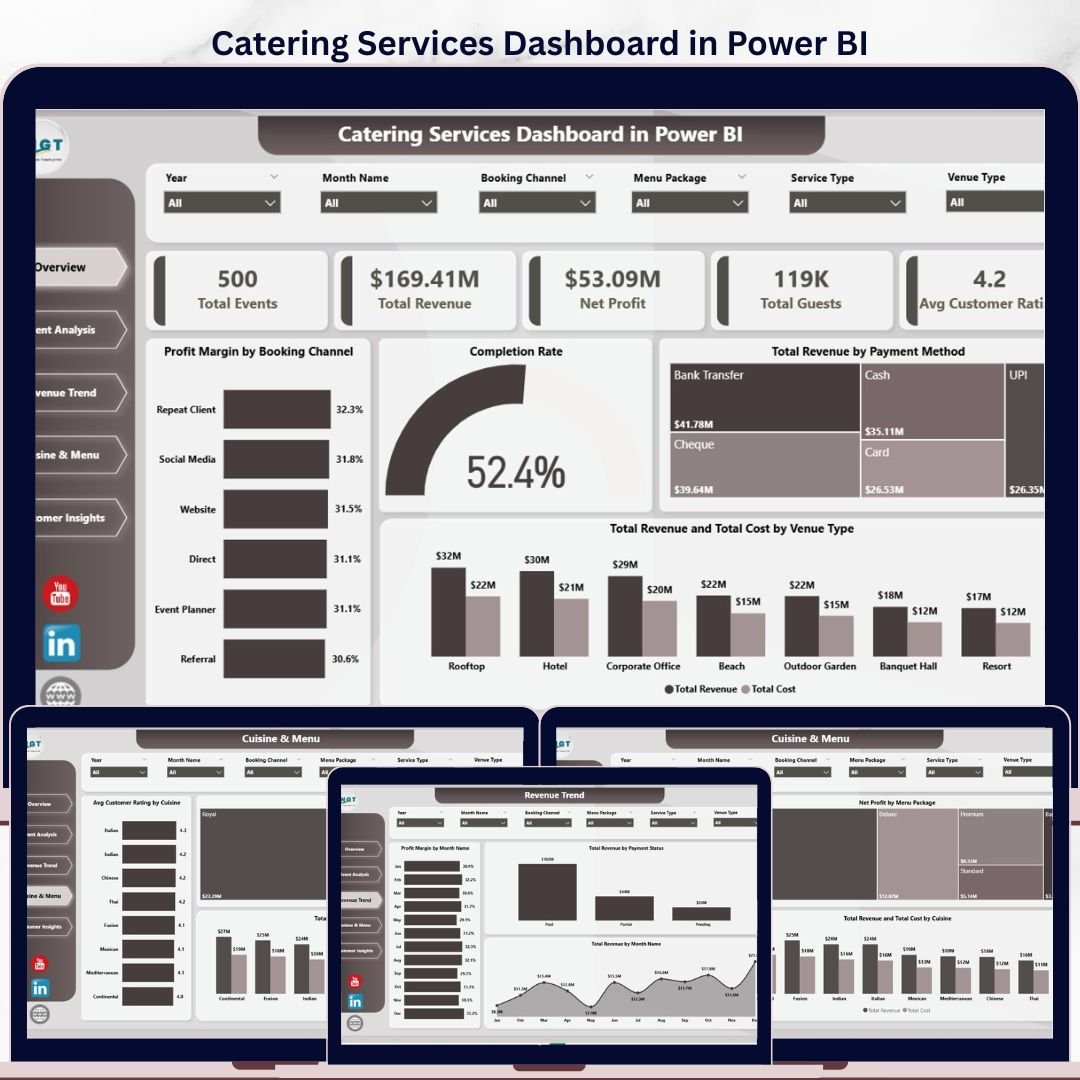


Catering Services Dashboard in Power BI
The Catering Services Dashboard in Power BI is a 5-page interactive analytics solution built for catering business owners, event managers, and hospitality professionals who need clear visibility into event performance, revenue trends, cuisine profitability, and customer satisfaction — all in one place. Powered by Microsoft Power BI Desktop, this template connects directly to your Excel data file, making it easy to refresh with real business data without any DAX or Power Query expertise.
Whether you manage corporate events, wedding receptions, or large-scale banquets, this dashboard delivers the KPIs and visual breakdowns you need to drive profit and streamline operations. Track booking channels, monitor venue-type costs, and identify which cuisines and menu packages generate the most profit.
Dashboard Pages Overview
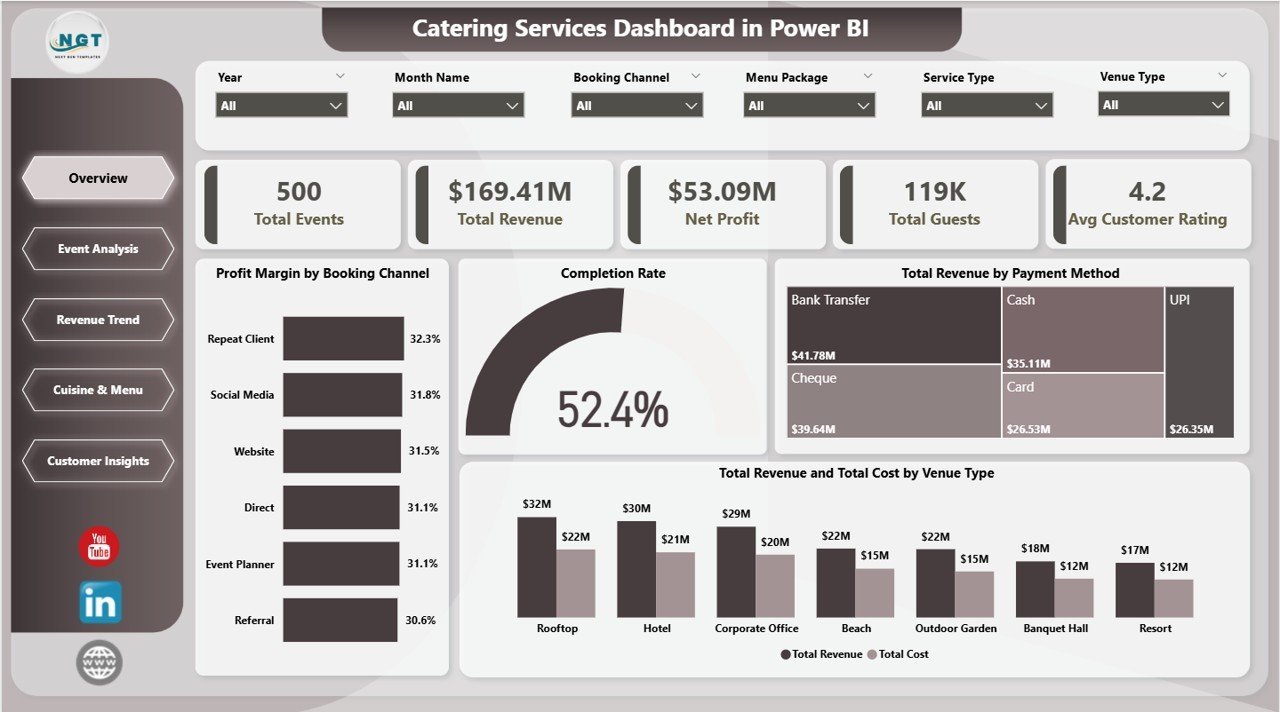
1. Overview Page
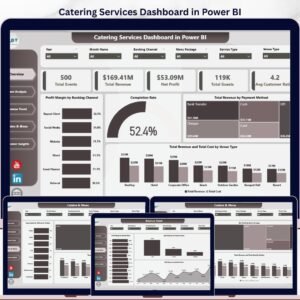
The Overview page provides a high-level snapshot of your entire catering operation. Five KPI cards at the top display Total Events, Total Revenue, Net Profit, Total Guests, and Avg Customer Rating — giving managers an instant performance pulse. Four dynamic charts break down Profit Margin by Booking Channel, Completion Rate, Total Revenue by Payment Method, and Total Revenue and Total Cost by Venue Type, supported by multiple slicers for rapid filtered views.
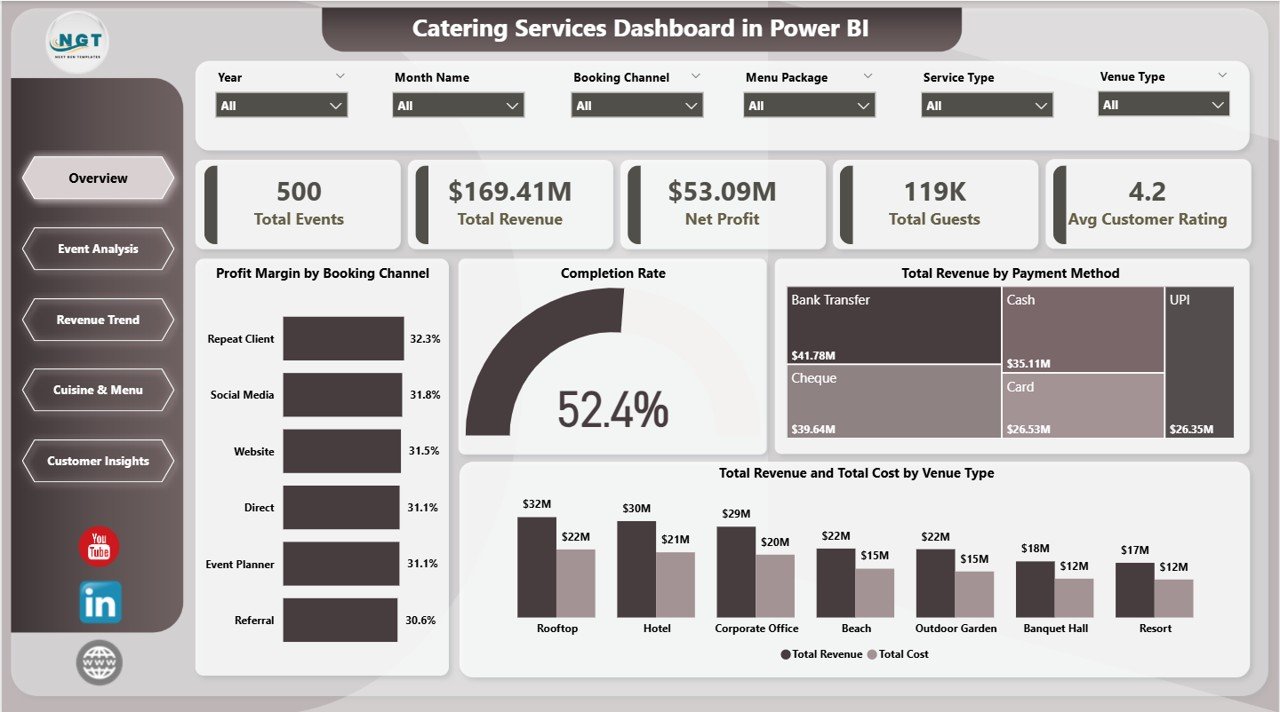 Catering Services Dashboard in Power BI – Overview Page
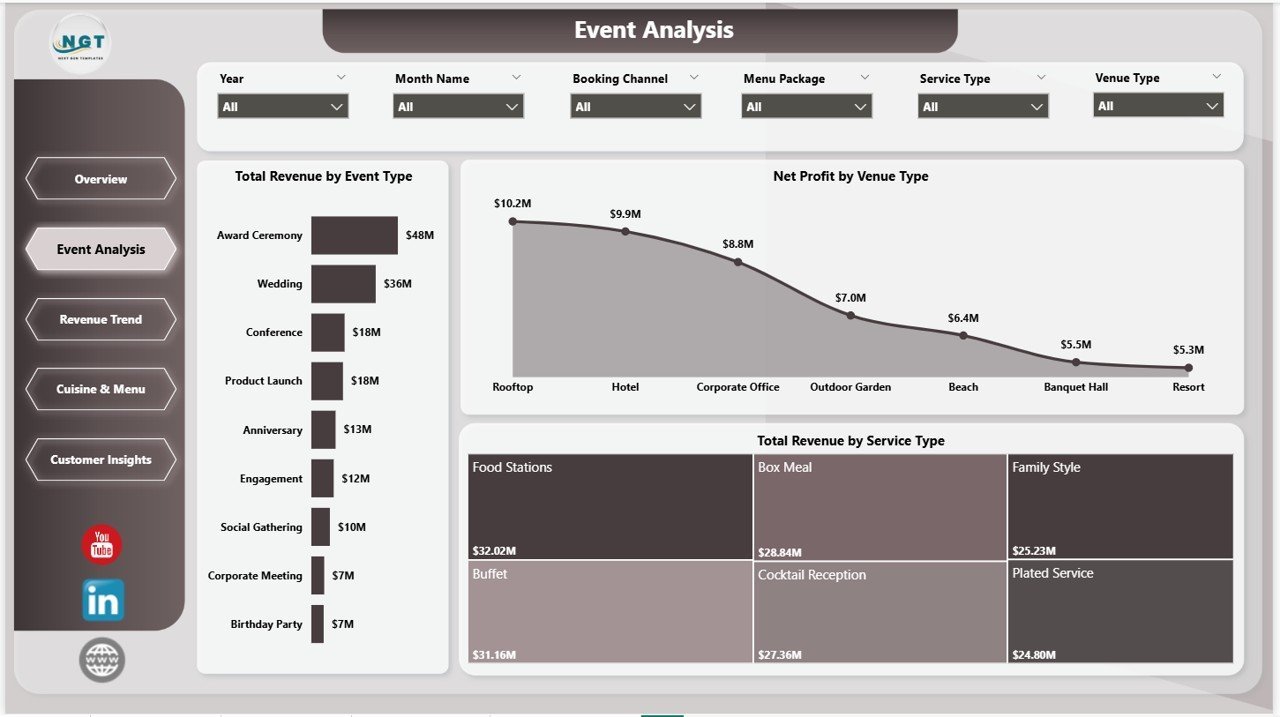
2. Event Analysis
The Event Analysis page deep-dives into performance by event type and venue, showing Total Revenue by Event Type, Net Profit by Venue Type, and Total Revenue by Service Type. This page helps catering managers identify which event categories generate the strongest margins and which service offerings drive the highest revenue mix.
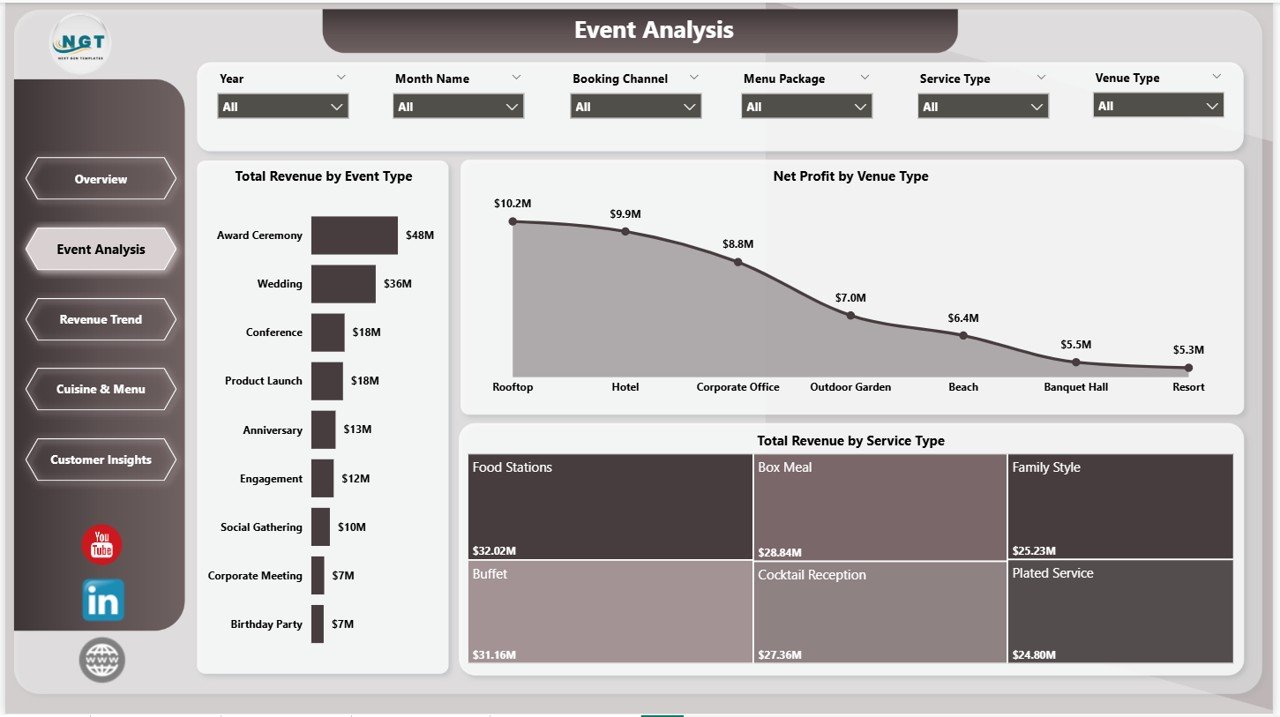 Catering Services Dashboard in Power BI – Event Analysis
3. Revenue Trend
The Revenue Trend page provides month-by-month financial performance analysis with charts for Profit Margin by Month Name, Total Revenue by Payment Status, and Total Revenue by Month Name. Use this page to spot seasonal revenue peaks, understand payment collection patterns, and forecast monthly profitability.
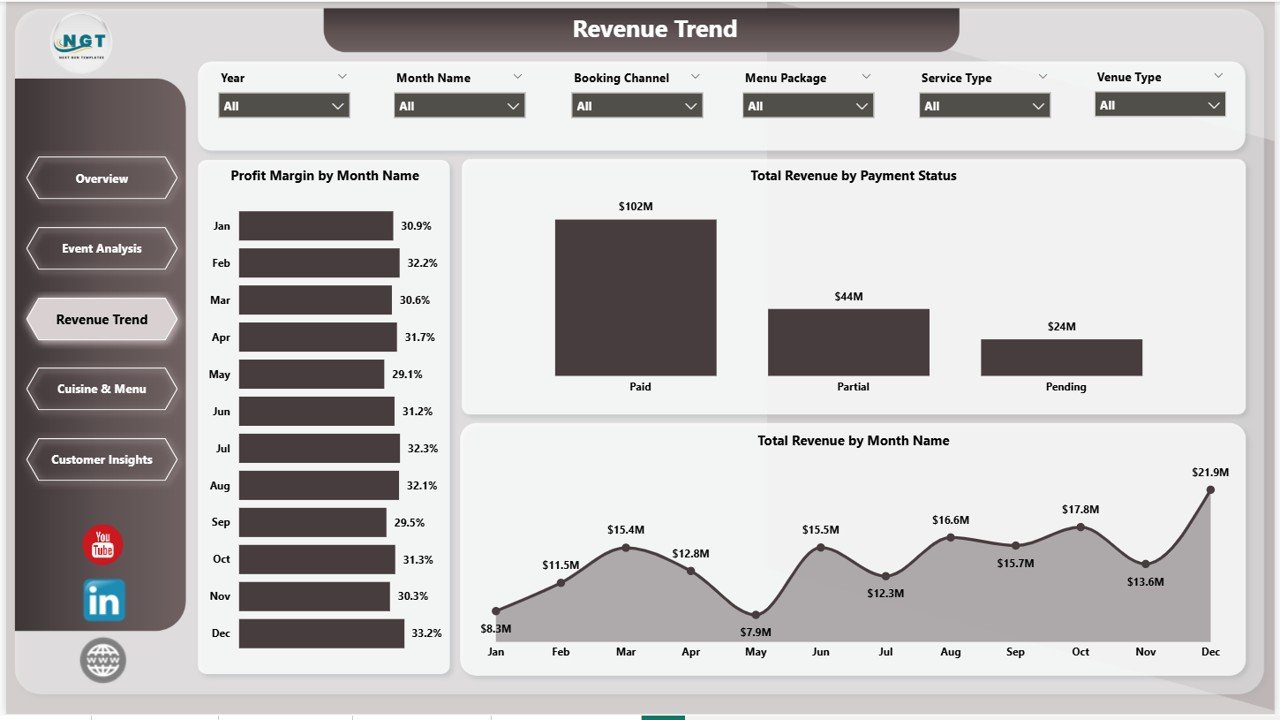 Catering Services Dashboard in Power BI – Revenue Trend
4. Cuisine & Menu
The Cuisine & Menu page analyzes profitability and satisfaction by food offering, presenting Avg Customer Rating by Cuisine, Net Profit by Menu Package, and Total Revenue and Total Cost by Cuisine. This view helps menu planners and chefs understand which cuisines earn top ratings and which packages deliver the best profit margins.
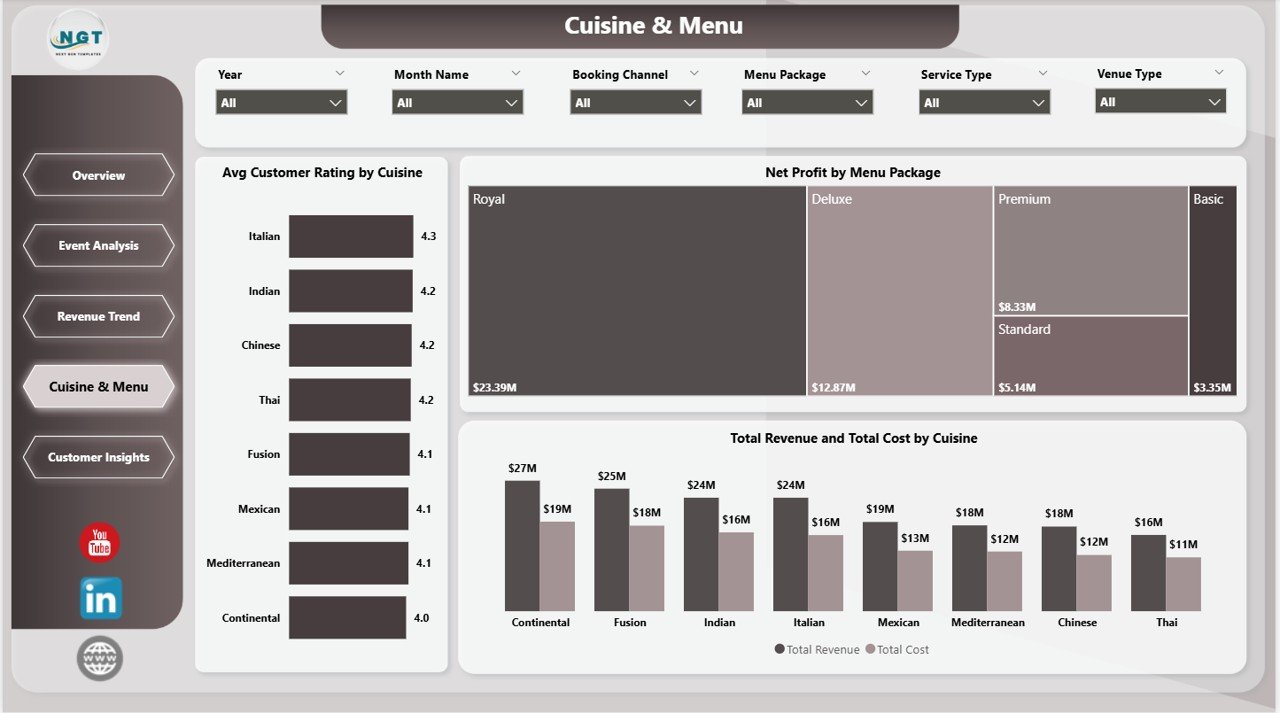 Catering Services Dashboard in Power BI – Cuisine & Menu
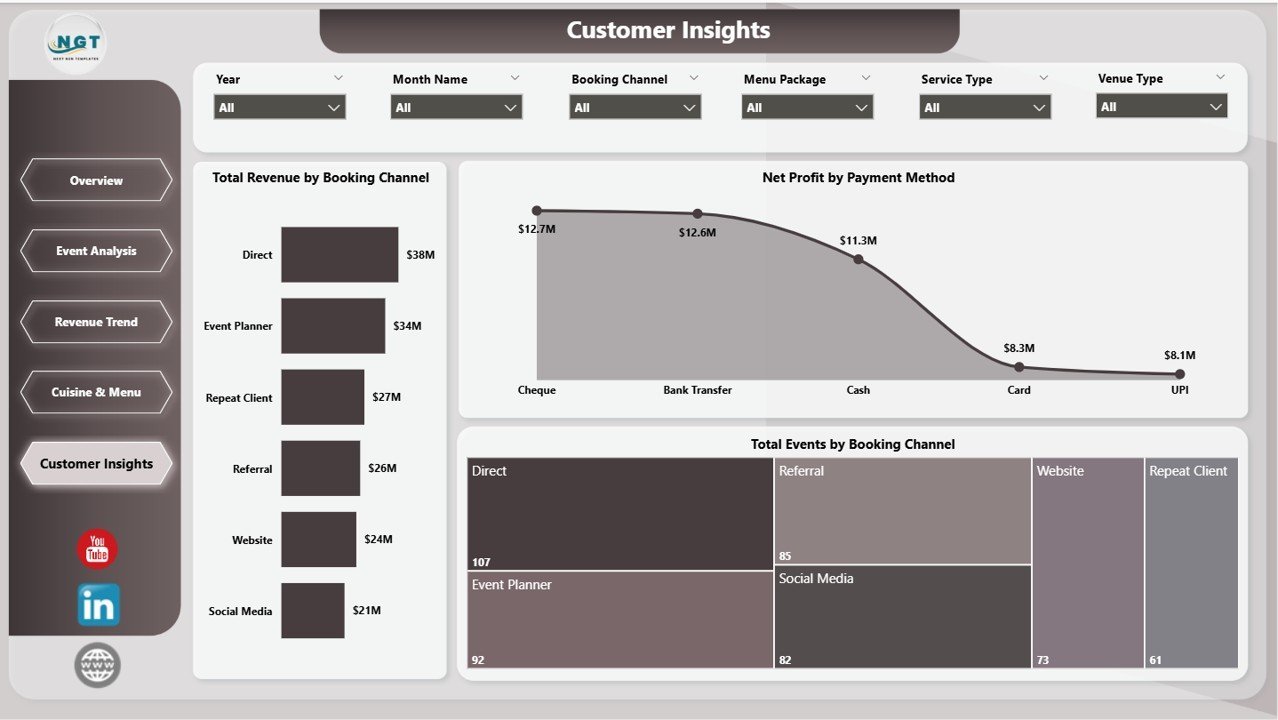
5. Customer Insights
The Customer Insights page focuses on acquisition and payment analytics, covering Total Revenue by Booking Channel, Net Profit by Payment Method, and Total Events by Booking Channel. Understand which booking channels bring the most profitable clients and which payment methods correlate with higher-value events.
 Catering Services Dashboard in Power BI – Customer Insights
Key Features
- ✅ 5 interactive Power BI pages — Overview, Event Analysis, Revenue Trend, Cuisine & Menu, Customer Insights
- ✅ 5 KPI cards — Total Events, Total Revenue, Net Profit, Total Guests, Avg Customer Rating
- ✅ Dynamic slicers for instant filtered views by date, venue type, event type, booking channel, and more
- ✅ Booking channel analysis — compare profit margin and event volume by channel
- ✅ Cuisine & menu profitability — identify top-rated cuisines and highest-margin packages
- ✅ Month-by-month revenue trend — spot seasonal patterns and cash flow dips
- ✅ Venue type cost analysis — understand revenue vs cost by venue
- ✅ Payment method & status breakdown — track collection efficiency
- ✅ Excel data input file included — plug in your real data, refresh, and go
- ✅ Compatible with Power BI Desktop (free from Microsoft)
Who Is This Dashboard For?
- Catering business owners tracking event profitability and revenue trends
- Event managers monitoring completion rates and guest volumes
- Hospitality operations teams analyzing venue costs and booking channels
- Restaurant and food service managers expanding into catering services
- Financial analysts in the F&B sector building performance reports
What’s Included in the Download?
- 📁 Catering-Services-Dashboard-in-Power-BI.pbix — fully designed Power BI file
- 📊 Data.xlsx — structured Excel data input file with sample catering records
- 📄 Instructions PDF — step-by-step setup and customization guide
How to Use
- Download and extract the ZIP file
- Open Data.xlsx and replace the sample data with your catering records
- Open the .pbix file in Power BI Desktop
- Click Refresh in the Home ribbon to load your updated data
- Use the slicers to filter by date, venue, event type, or booking channel
- Export reports as PDF or share via Power BI Service
Comparison: Catering Services Dashboard in Power BI vs Excel
| Feature | Power BI Version | Excel Version |
|---|---|---|
| Interactive slicers | ✅ Advanced | ✅ Basic |
| Cross-page drill-through | ✅ Yes | ❌ No |
| Cloud sharing (Power BI Service) | ✅ Yes | ❌ No |
| No additional software beyond Excel | ❌ Power BI Desktop required | ✅ Yes |
| Cuisine & menu profitability page | ✅ Yes | ✅ Yes |
| Customer insights page | ✅ Yes | ✅ Yes |
Frequently Asked Questions
What software do I need to open this dashboard?
You need Microsoft Power BI Desktop, which is free to download from Microsoft’s official website. No Power BI Pro subscription is required to use the template locally.
Can I use my own catering data with this dashboard?
Yes. The included Data.xlsx file is structured to match the dashboard’s data model. Simply replace the sample records with your real catering event data, save the file, then click Refresh in Power BI Desktop.
Does this work on Mac?
Power BI Desktop is currently a Windows-only application. Mac users can use Power BI Service via a browser or run Power BI Desktop through Parallels or a virtual machine.
Can I customize the dashboard colors and branding?
Yes. You can modify colors, fonts, and logo through Power BI Desktop’s Format pane. The theme can be fully customized to match your brand guidelines.
Is there a Google Sheets or Excel version available?
Yes! We also offer a Catering Services Dashboard in Excel if you prefer working without Power BI Desktop.
🎓 Watch the full tutorial on our YouTube channel: @PK-AnExcelExpert
Watch the step-by-step video tutorial:
YouTube


Reviews
There are no reviews yet.