

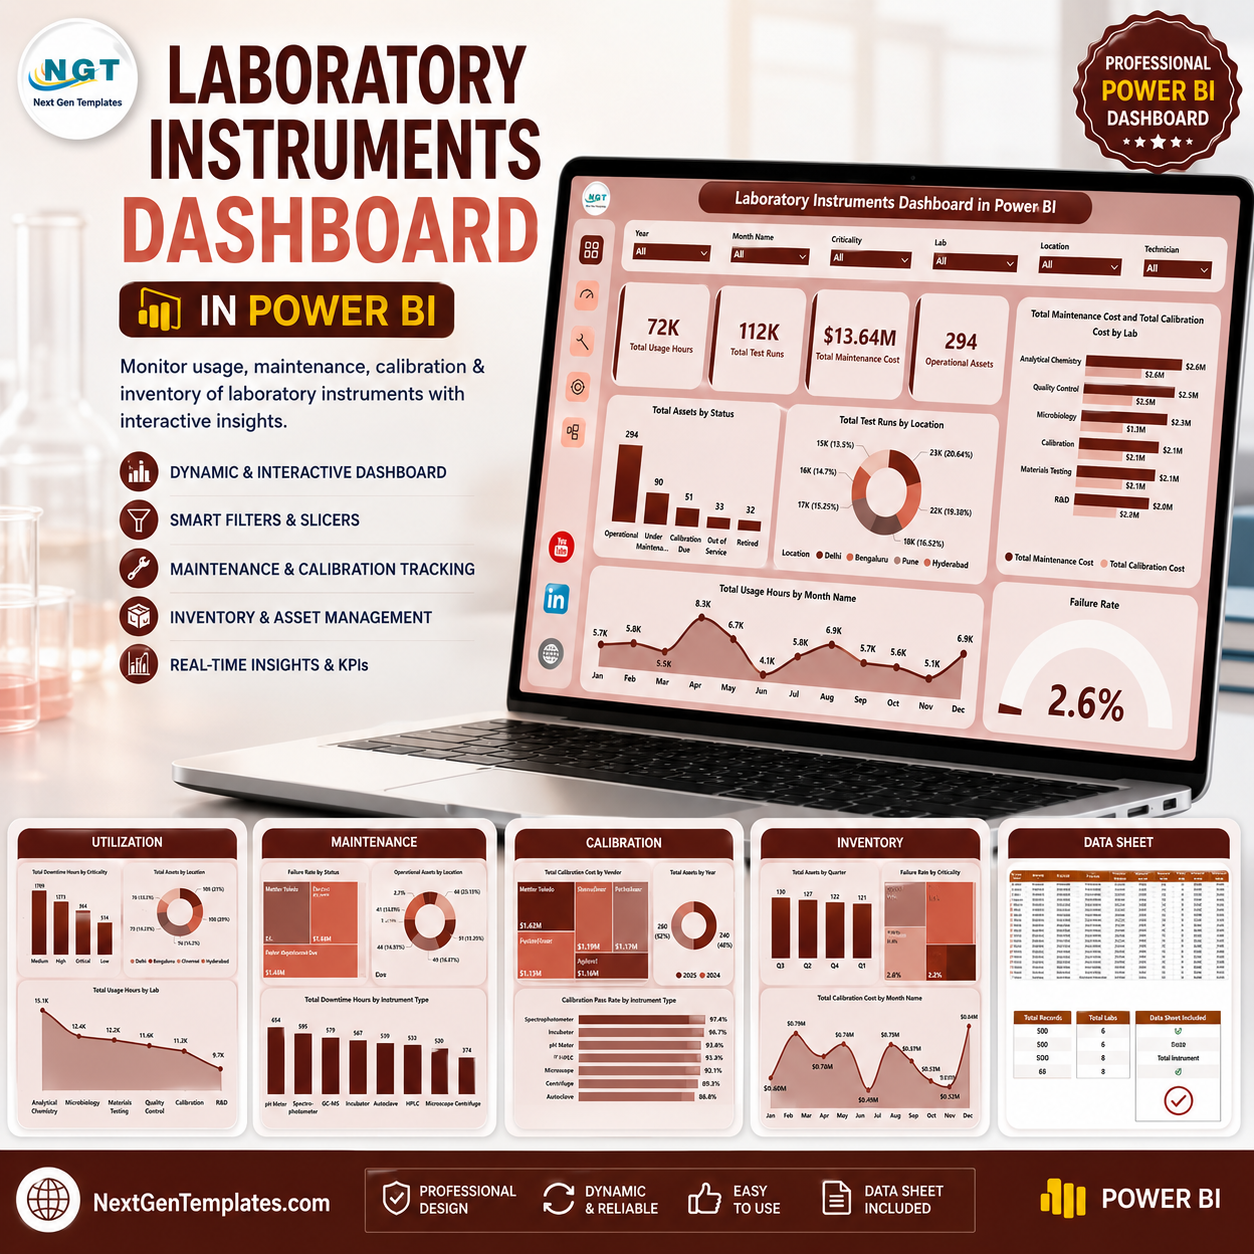

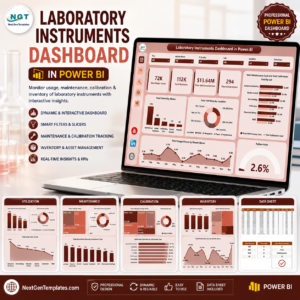
Laboratory Instruments Dashboard in Power BI helps lab managers, quality teams, calibration coordinators, and operations analysts review instrument usage, test volume, maintenance cost, calibration cost, failure rate, assets, locations, vendors, and labs in one PBIX report. The template includes 5 Power BI pages, 4 headline KPI cards, multiple slicers, and 17 focused visuals. Built by PK, a Microsoft Certified Professional with 15+ years of Excel and Power BI experience and 300K+ YouTube subscribers, this dashboard gives laboratories a one-time downloadable reporting file that can be reviewed, customized, and connected to your own structured data.
Laboratory Instruments Dashboard in Power BI
Key Features of Laboratory Instruments Dashboard in Power BI
- 5 Power BI pages: Overview, Utilization, Calibration, Maintenance, and Inventory.
- Executive KPI cards: Total Usage Hours, Total Test Runs, Total Maintenance Cost, and Operational Assets.
- Interactive slicers: Filter the report quickly by laboratory, location, vendor, status, criticality, month, and instrument dimensions.
- Utilization analysis: Compare usage hours, downtime hours, asset counts, lab activity, and location-level test runs.
- Calibration visibility: Review pass rate, calibration cost, year-wise assets, vendor activity, and operational assets by lab.
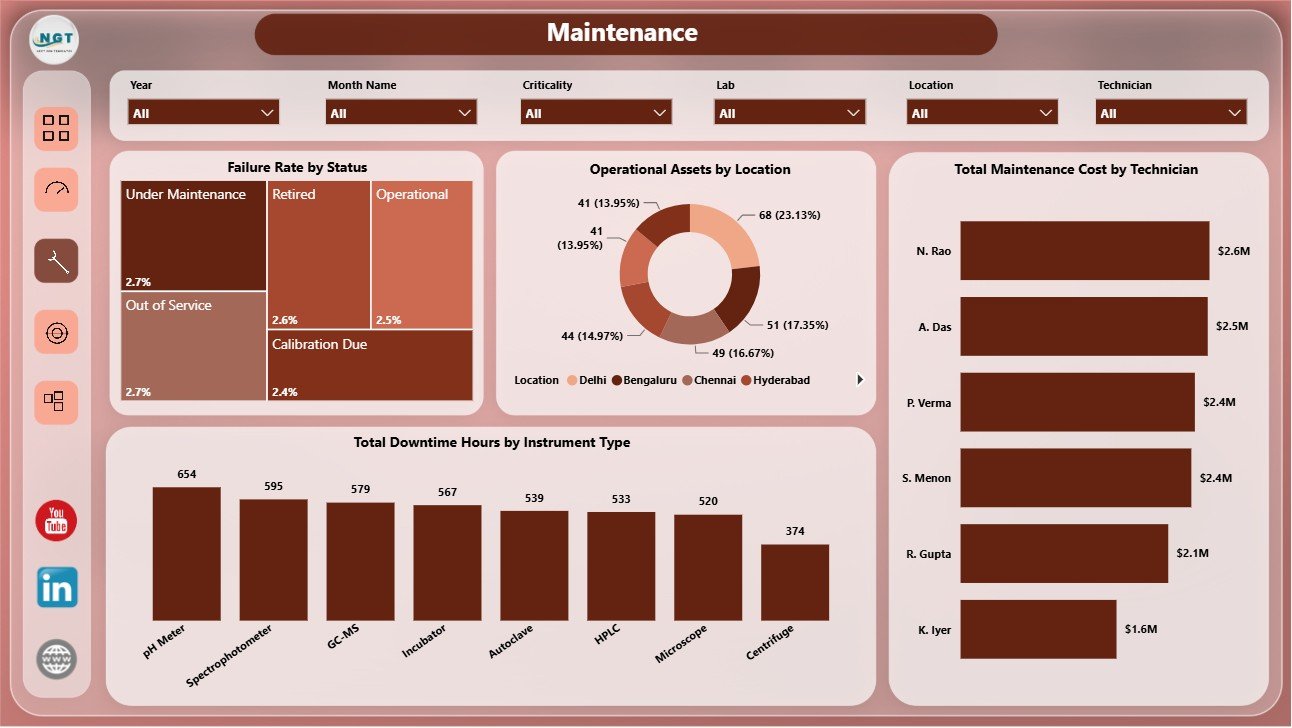
- Maintenance tracking: Monitor failure rate, technician maintenance cost, downtime by instrument type, and operating status.
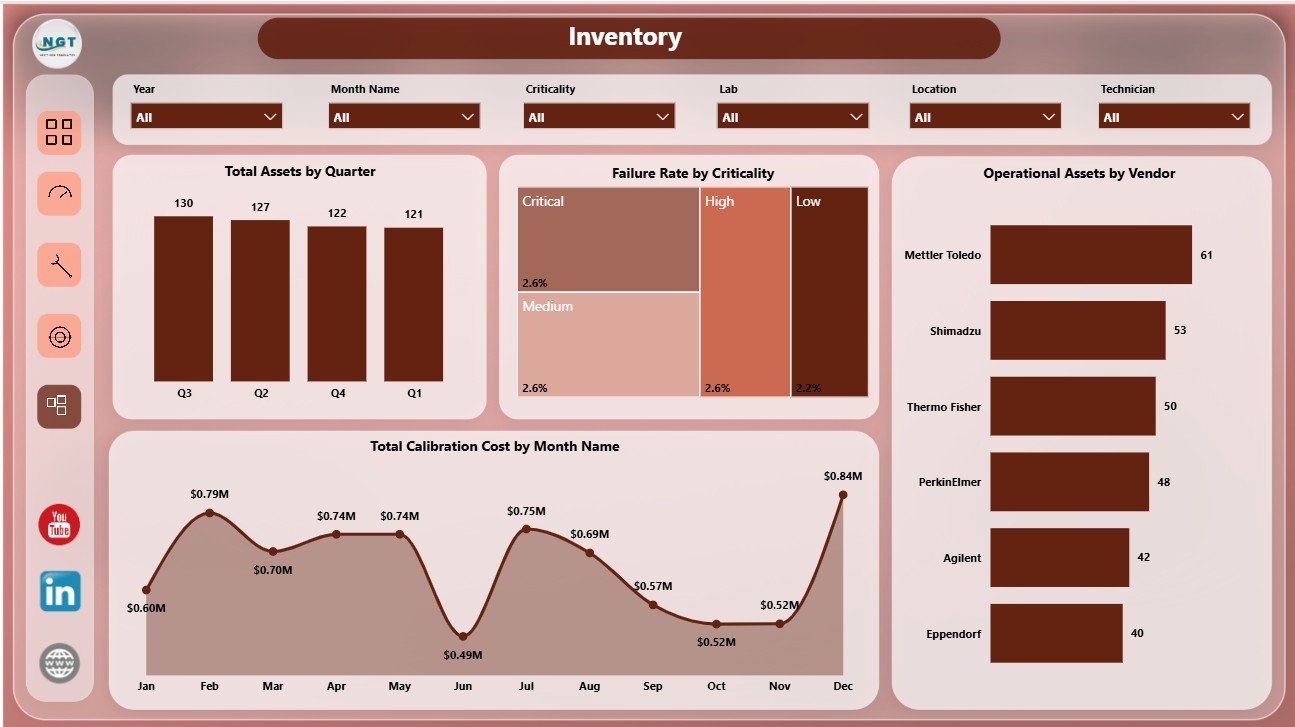
- Inventory reporting: Analyze assets by quarter, vendor, criticality, failure rate, and monthly calibration cost.
- Editable PBIX file: Customize visuals, measures, fields, colors, slicers, and data connections in Power BI Desktop.
What’s Inside the Laboratory Instruments Dashboard in Power BI
1. Overview Page
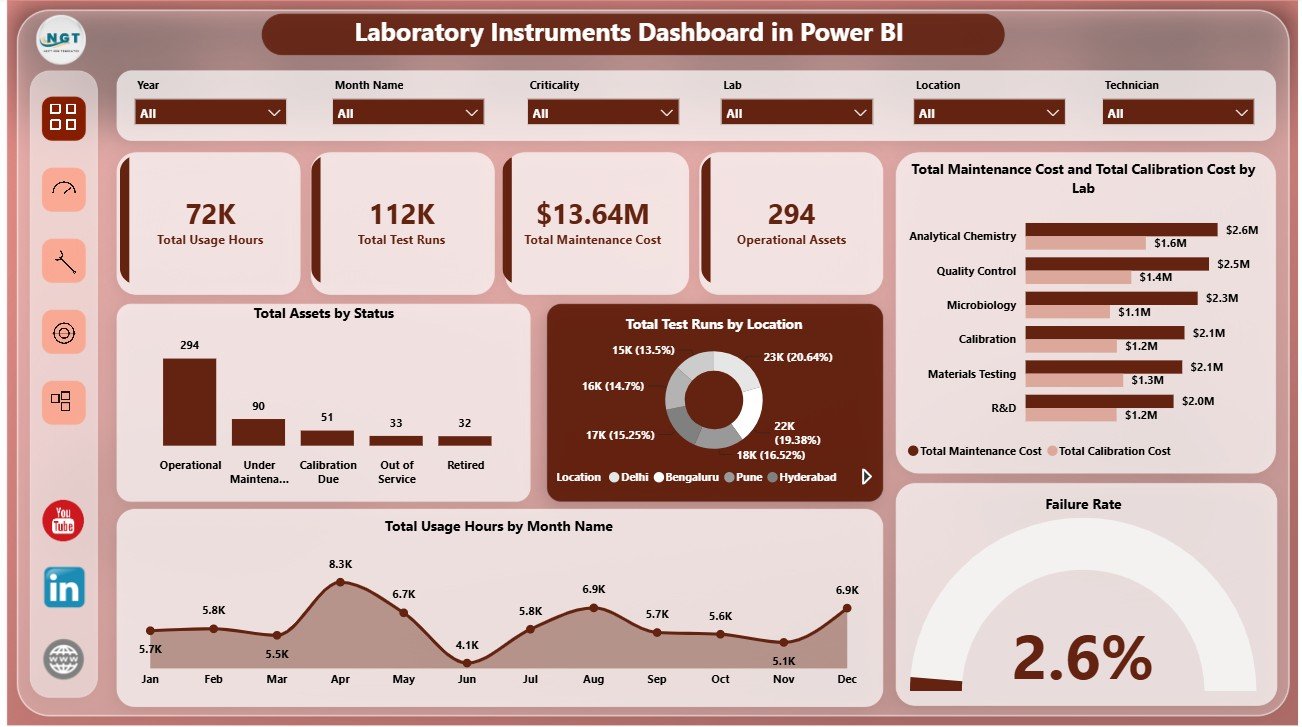
The Overview Page gives leaders a fast summary of laboratory instrument performance. The top cards show Total Usage Hours, Total Test Runs, Total Maintenance Cost, and Operational Assets, helping teams review demand, productivity, cost, and active equipment at a glance.
Total Assets by Status: This chart shows how instruments are distributed across operating, maintenance, inactive, or other status groups. It helps teams identify whether too many assets are unavailable or require follow-up.
Total Test Runs by Location: This visual compares testing volume across locations. It helps operations teams understand where activity is concentrated and where extra capacity may be needed.
Total Maintenance Cost and Total Calibration Cost by Lab: This chart compares two major cost lines by laboratory. It helps managers detect labs where service, calibration, or equipment practices may need review.
Total Usage Hours by Month Name: This trend shows monthly instrument utilization. It helps teams spot busy periods, seasonal demand, and lower-activity months.
Failure Rate: This visual highlights equipment reliability performance. It helps quality and maintenance teams identify whether failures are staying within acceptable limits.
2. Utilization
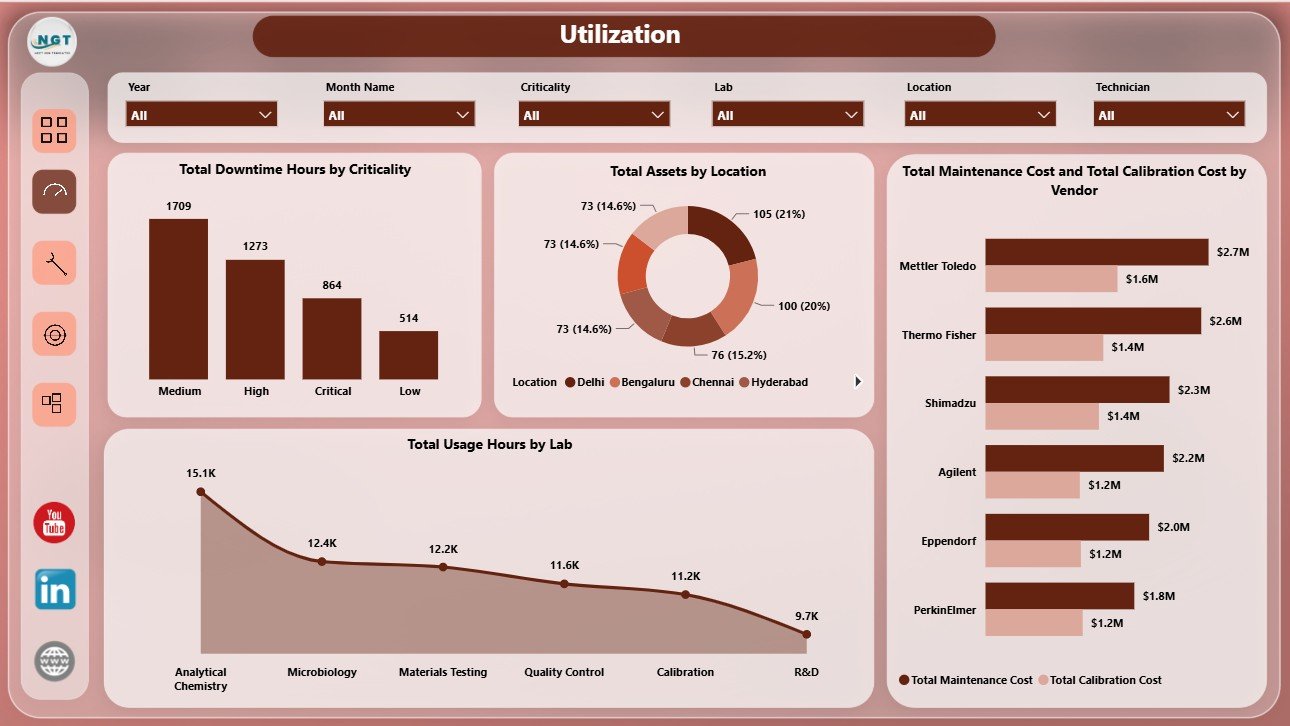
The Utilization page focuses on how instruments are used across labs, locations, vendors, and criticality groups. Total Downtime Hours by Criticality helps teams prioritize high-impact assets, while Total Assets by Location shows where the equipment base is concentrated.
Total Maintenance Cost and Total Calibration Cost by Vendor compares vendor-level service spending, which is useful for supplier review and budgeting. Total Usage Hours by Lab shows which labs have the highest workload and may need scheduling or capacity changes.
Utilization
3. Calibration
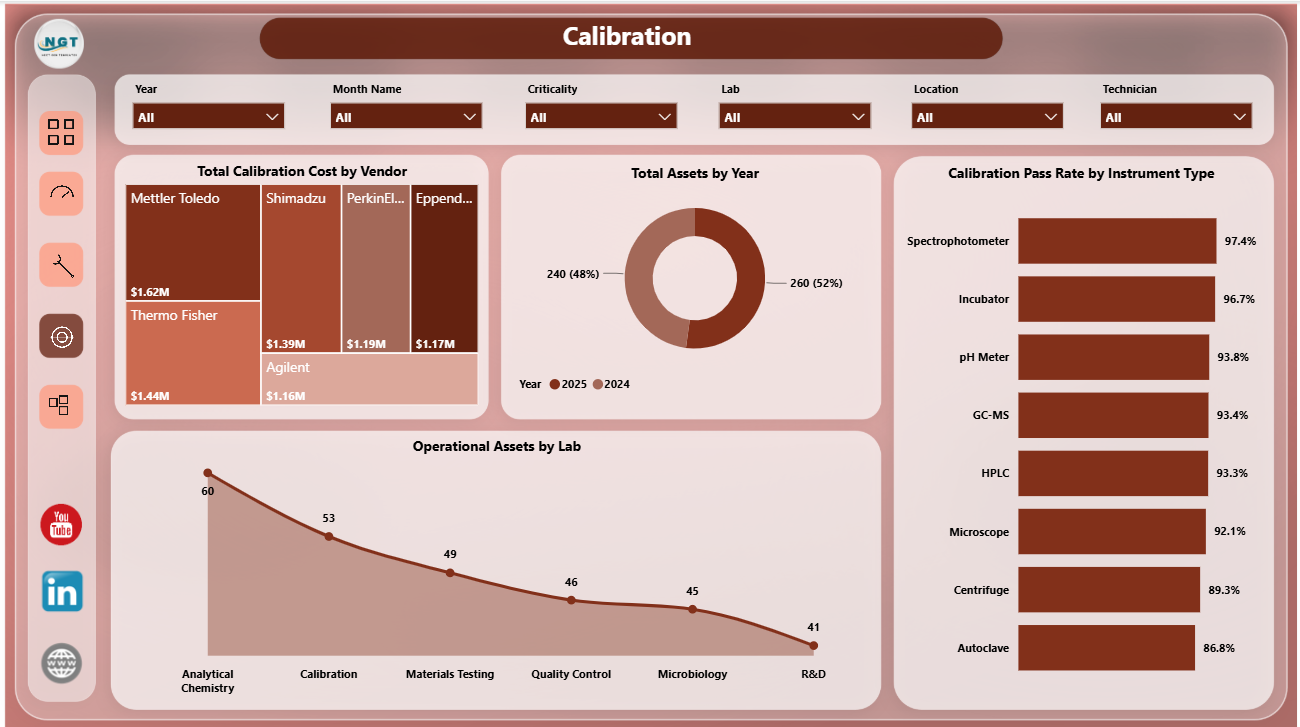
The Calibration page supports quality, compliance, and vendor review. Total Calibration Cost by Vendor shows which vendors drive the highest calibration spend. Total Assets by Year helps teams understand asset age or acquisition patterns over time.
Calibration Pass Rate by Instrument Type compares calibration outcomes across equipment groups, helping teams find categories with weaker pass performance. Operational Assets by Lab shows which labs currently have usable equipment available for daily work.
Calibration
4. Maintenance
The Maintenance page helps teams review reliability, workload, and repair cost. Failure Rate by Status connects asset condition with operating status, while Operational Assets by Location shows where available equipment is located.
Total Maintenance Cost by Technician supports workload and cost review by maintenance owner. Total Downtime Hours by Instrument Type identifies equipment groups that create the most downtime and may need preventive maintenance.
Maintenance
5. Inventory
The Inventory page gives a practical view of asset distribution and calibration cost movement. Total Assets by Quarter tracks asset count over time, while Failure Rate by Criticality helps teams understand reliability risk by importance level.
Operational Assets by Vendor compares vendor-related asset availability. Total Calibration Cost by Month Name shows monthly calibration spending so teams can plan budgets and investigate unusual cost spikes.
Inventory
Laboratory Instruments Dashboard in Power BI vs. Tableau vs. Paid Healthcare SaaS – Where This Fits
| Feature | This Power BI dashboard | Tableau or Qlik alternative | Paid healthcare SaaS |
|---|---|---|---|
| Cost | $17.99 one-time template | License plus dashboard build time | Monthly or annual subscription |
| Platform | Power BI Desktop and Power BI Service | Tableau or Qlik environment | Vendor cloud platform |
| Setup time | Open PBIX, replace data, refresh | Build model and visuals manually | Implementation and onboarding |
| Real-time team collaboration | Available after publishing to Power BI Service | Available by platform plan | Usually included by plan |
| Customizable fields | Edit model, visuals, measures, pages, and slicers | Editable with platform skills | Depends on vendor permissions |
| Laboratory instrument analytics | Usage, test runs, assets, maintenance, calibration, failure rate, downtime, vendors, and labs included | Must be designed manually | Depends on module |
| Year-1 cost at 5 users | $17.99 plus any Microsoft licensing | License cost plus analyst time | Often hundreds or thousands |
Who This Template Is For – and Who It’s Not For
This template is for laboratory managers, quality teams, calibration coordinators, diagnostic centers, pharmaceutical labs, research laboratories, healthcare analysts, maintenance leads, and operations teams that already collect instrument data and want a Power BI reporting layer. It is not a laboratory information management system, CMMS, live IoT monitoring platform, regulatory filing system, or medical decision tool.
How to Use the Laboratory Instruments Dashboard in Power BI
- Download and unzip the product file.
- Open the PBIX file in Power BI Desktop.
- Review the Overview, Utilization, Calibration, Maintenance, and Inventory pages.
- Replace or connect the sample source with your own structured laboratory instrument data.
- Refresh the report and validate KPI cards, slicers, and visual totals.
- Customize measures, visuals, labels, colors, pages, and data connections as needed.
Real-World Use Cases
Dr. Meera, laboratory director: reviews usage hours, test runs, operational assets, and maintenance cost before monthly performance meetings.
Arjun, maintenance lead: uses the Maintenance page to compare downtime by instrument type, failure rate by status, and technician maintenance cost.
Sofia, quality analyst: uses the Calibration page to monitor pass rate, vendor calibration cost, and operational assets by lab.
Frequently Asked Questions
Do I need Power BI Desktop?
Yes. Use Power BI Desktop to open, refresh, and customize the PBIX file. Power BI Service is optional for online sharing.
Can I connect my own laboratory data?
Yes. Replace or connect the sample source with your own structured laboratory instrument records, then refresh the report.
What pages are included?
The dashboard includes Overview, Utilization, Calibration, Maintenance, and Inventory pages.
Can I customize the visuals?
Yes. You can edit charts, slicers, measures, labels, relationships, colors, and page layouts in Power BI Desktop.
Is this a live monitoring system?
No. It is a reporting dashboard template, not a live sensor system, LIMS, CMMS, or automated alerting tool.
Can I publish it to Power BI Service?
Yes, after validating your data model and licensing, you can publish and share it through Power BI Service permissions.
About the Author
Built by PK – Microsoft Certified Professional with 15+ years of Excel, Google Sheets, and Power BI experience. Founder of NextGenTemplates, reaching 300K+ subscribers across YouTube channels. Every template is hand-built and tested before release.
Explore Related Templates
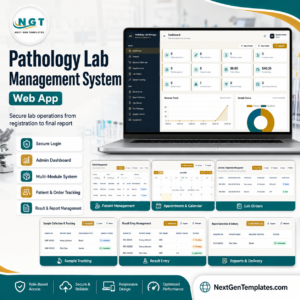
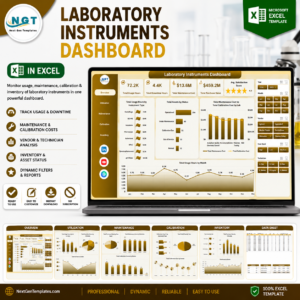
You may also like Laboratory Instruments Dashboard in Excel, Laboratory Instruments KPI Dashboard in Power BI, and Pathology Lab Management System Web App. Browse more Power BI templates and Power BI dashboard templates.
Download the Laboratory Instruments Dashboard in Power BI today and turn usage, calibration, maintenance, failure, and inventory data into an interactive Power BI report.
Watch the step-by-step video tutorial:
Compatibility and Requirements
- Works in Power BI Desktop, which is free. You open, refresh and edit the PBIX file there. Microsoft explains how to get it in Get Power BI Desktop.
- Power BI Service is optional and only needed if you want to publish and share the report online.





























Reviews
There are no reviews yet.