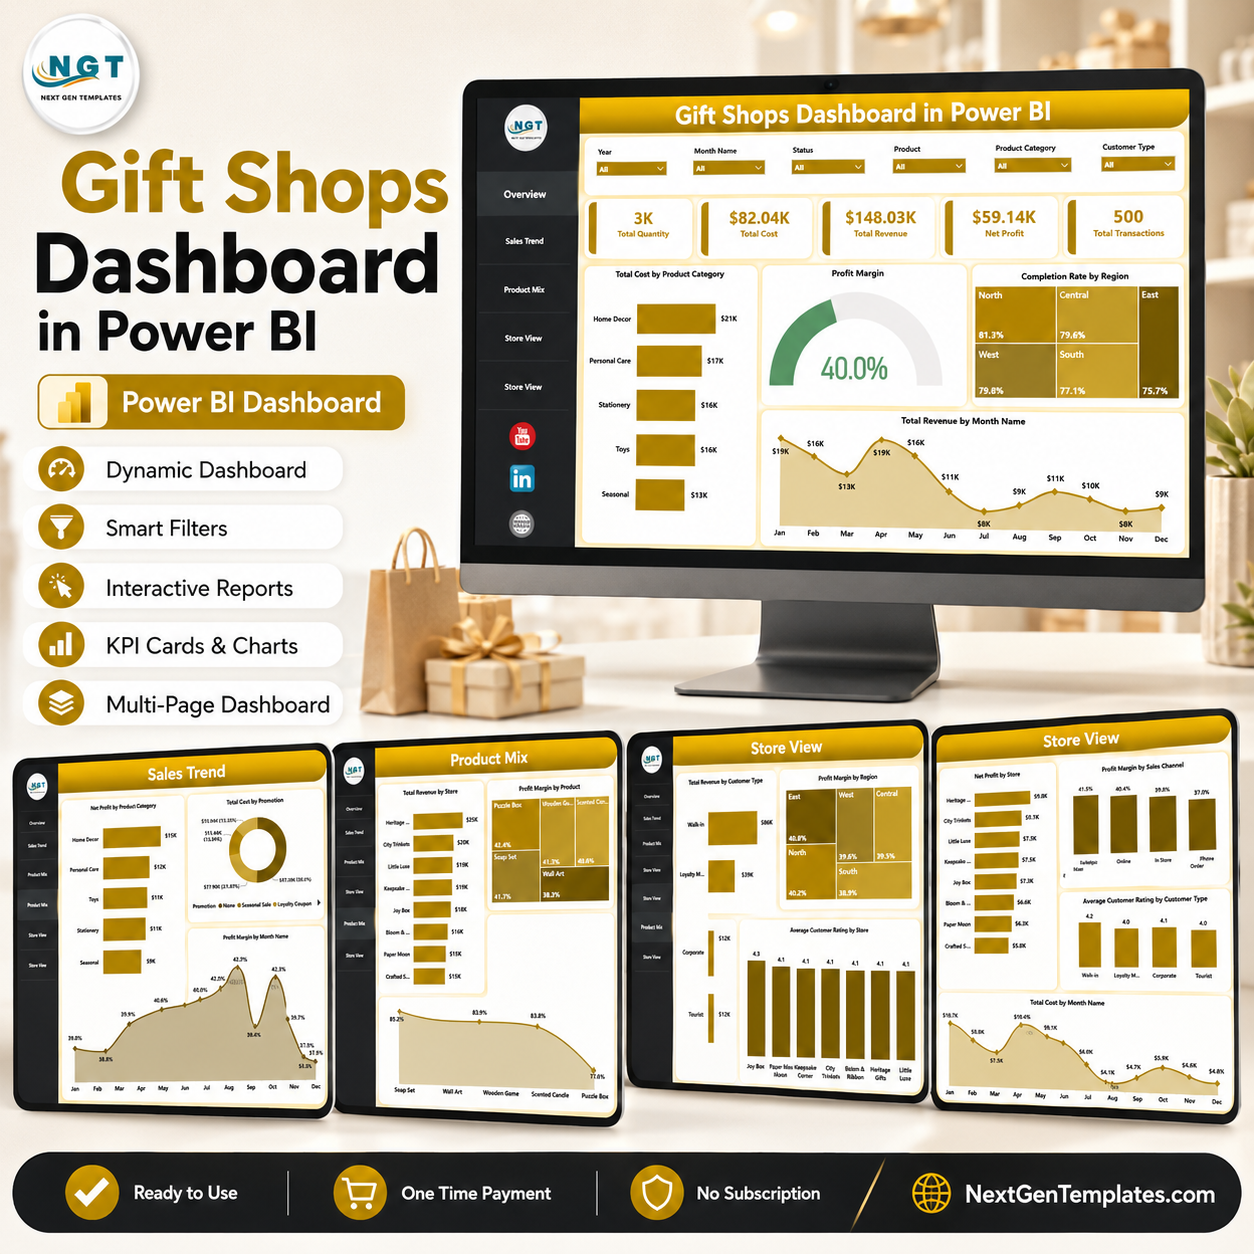
Gift Shops Dashboard in Power BI helps gift shop owners, retail managers, finance teams, and analysts track sales, cost, revenue, net profit, transactions, product mix, store performance, and customer behavior in one ready-to-use Power BI report. Gift shops often see demand shift around holidays, tourism seasons, promotions, and local events, so a static spreadsheet can miss the story behind margin and store performance. This template gives you 5 interactive report pages, high-level KPI cards, slicers, and visual analysis without building a Power BI model from scratch.
Open the .pbix file in Power BI Desktop, connect or replace the sample data with your own records, refresh the report, and use the slicers to explore trends by category, store, region, sales channel, customer type, month, and product. It is a one-time purchase, so you can analyze your gift shop performance without a recurring retail analytics subscription.
Key Features of Gift Shops Dashboard in Power BI
- 5-page Power BI report for Overview, Sales Trend, Product Mix, Store View, and customer/store performance analysis.
- Executive KPI cards for Total Quantity, Total Cost, Total Revenue, Net Profit, and Total Transactions.
- Interactive slicers to filter the dashboard quickly and review focused performance views.
- Cost and revenue analysis by product category, sales channel, promotion, store, city, region, customer type, and month.
- Profitability visuals for net profit, profit margin, and overall business performance.
- Customer experience tracking with average customer rating by store and customer type.
- Power BI Desktop workflow with editable visuals, fields, filters, and report pages.
What’s Inside the Gift Shops Dashboard in Power BI
1. Overview Page
The Overview page gives a high-level view of gift shop performance using KPI cards for Total Quantity, Total Cost, Total Revenue, Net Profit, and Total Transactions. These cards help managers check sales volume, total spend, revenue generation, profit, and transaction activity before moving into detailed analysis.
Total Cost by Product Category shows which gift categories carry the highest cost base, helping teams watch purchasing and sourcing pressure. Profit Margin by Overall Performance highlights whether revenue is converting into healthy profit. Completion Rate by Region compares fulfillment or transaction completion across regions. Total Revenue by Month Name makes seasonal sales patterns easier to identify.
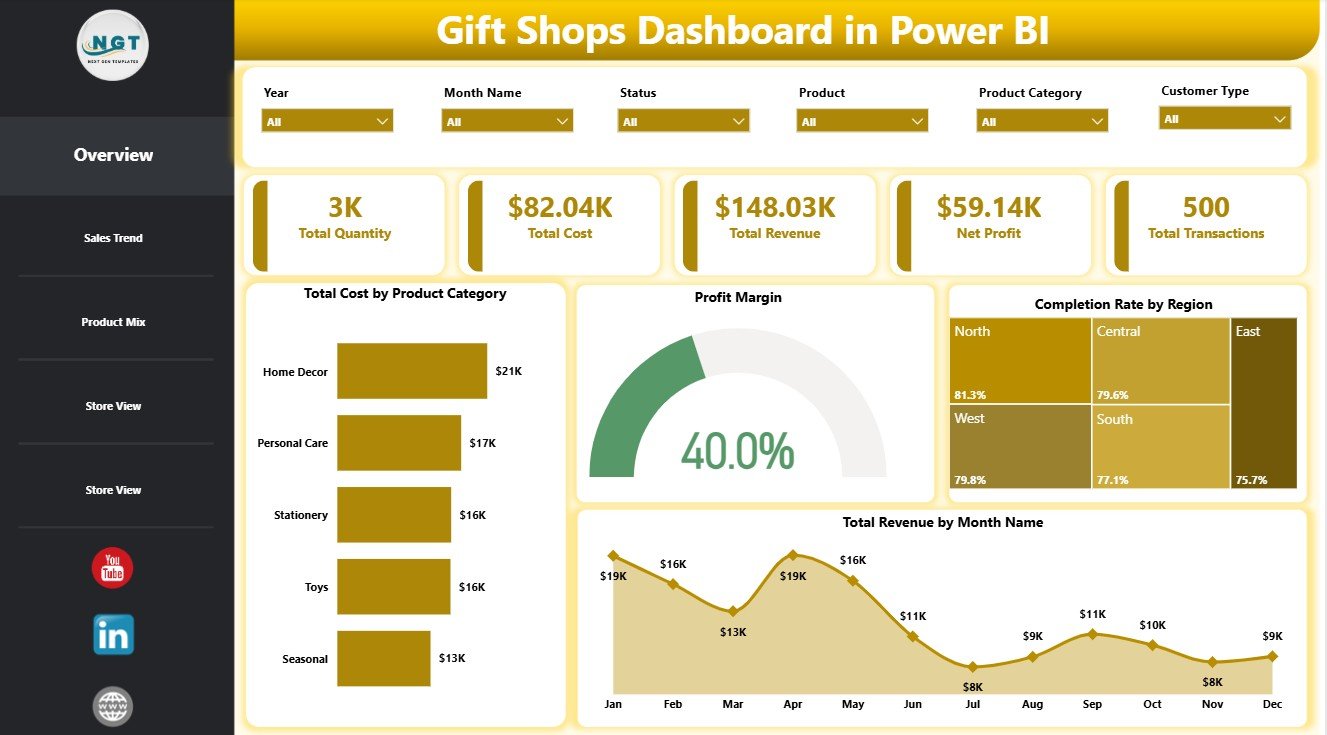
Gift Shops Dashboard in Power BI
2. Sales Trend Page
The Sales Trend page is built for revenue, cost, channel, and margin analysis over time. Net Profit by Product Category shows which categories contribute most to bottom-line results. Total Cost by Promotion helps you evaluate whether promotions are driving value or adding unnecessary cost.
Total Revenue by Sales Channel compares revenue from channels such as in-store, online, marketplace, or other selling routes. Profit Margin by Month Name helps you see whether monthly revenue growth is also producing stronger profitability.
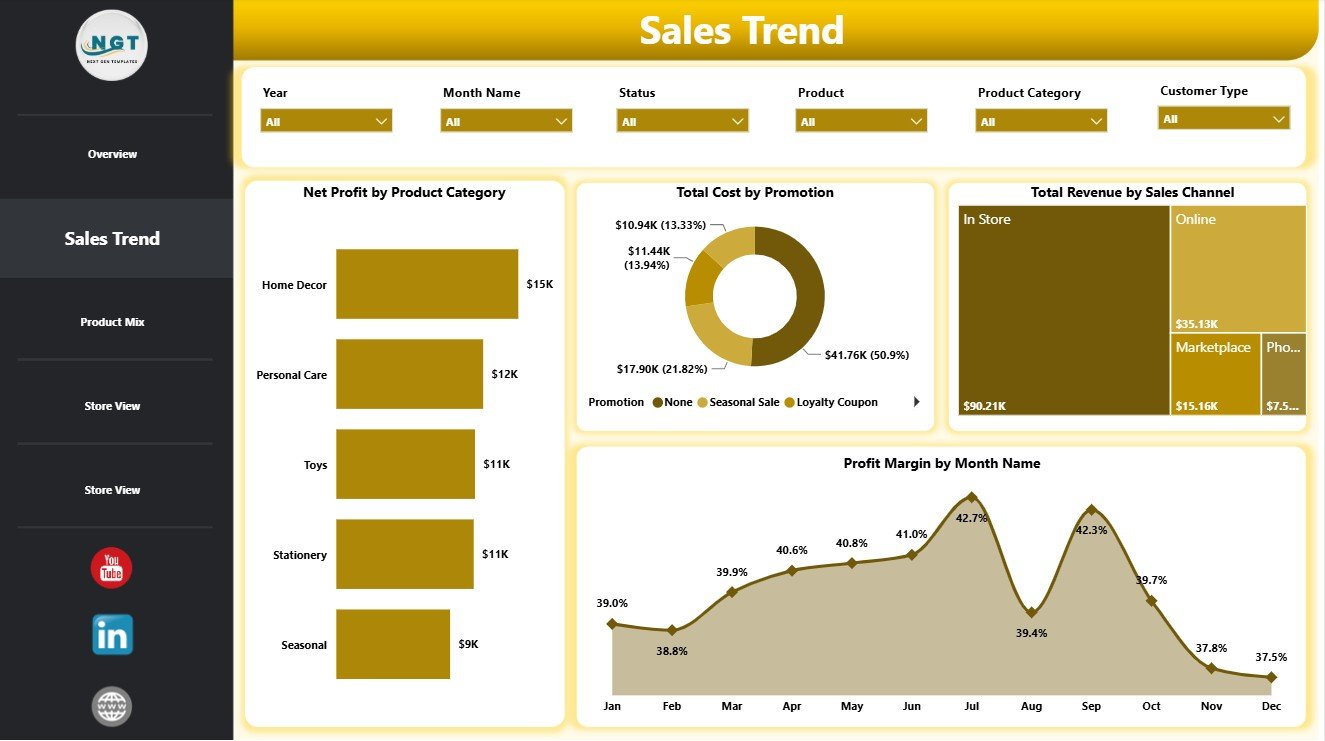
Sales Trend
3. Product Mix Page
The Product Mix page focuses on stores, products, net profit, and completion rate. Total Revenue by Store compares sales contribution by location so managers can identify high-performing branches. Profit Margin by Product shows which individual products are most efficient at turning sales into profit.
Net Profit by Product highlights the products contributing the most absolute profit. Completion Rate by Product helps spot products that may have fulfillment, availability, cancellation, or delivery issues.
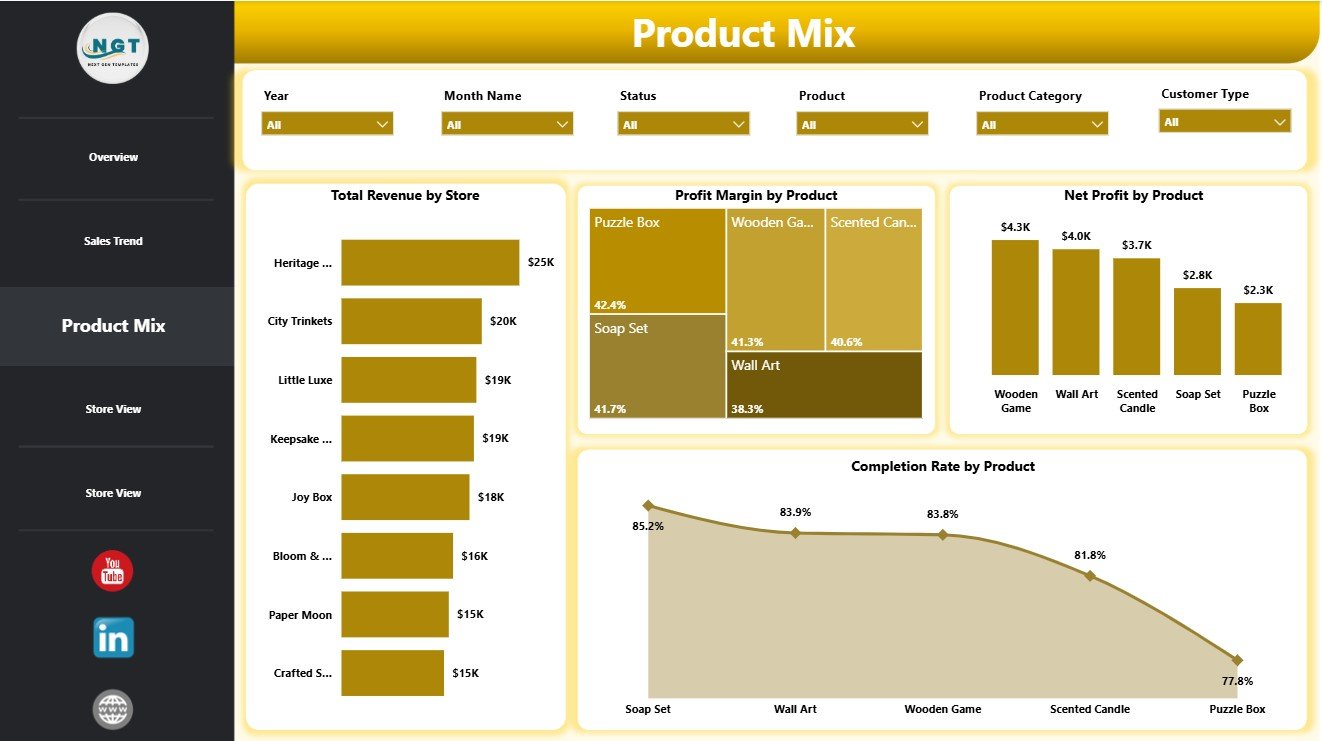
Product Mix
4. Store View Page
The Store View page helps compare customer type, region, city, and store-level satisfaction. Total Revenue by Customer Type shows which customer segments create the most revenue. Profit Margin by Region helps compare profitability across territories.
Total Revenue by City identifies cities with the strongest sales contribution. Average Customer Rating by Store helps managers compare customer experience across shop locations and investigate stores that need support.
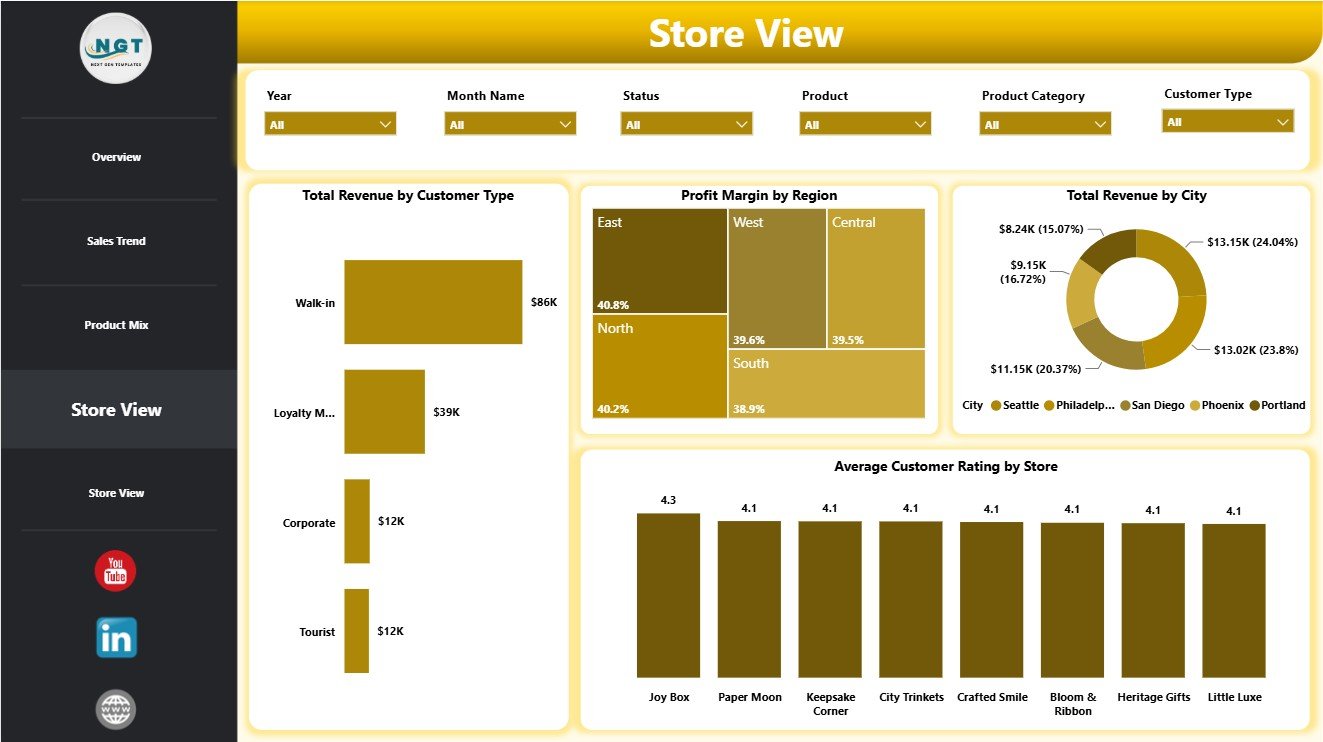
Store View
5. Store Performance Page
The final page continues the store and customer performance view. Net Profit by Store ranks locations by profit contribution, not just revenue. Profit Margin by Sales Channel helps you compare channel efficiency.
Average Customer Rating by Customer Type reveals satisfaction differences by customer segment. Total Cost by Month Name shows how monthly cost changes over time and helps teams compare expense movement against revenue and profit trends.
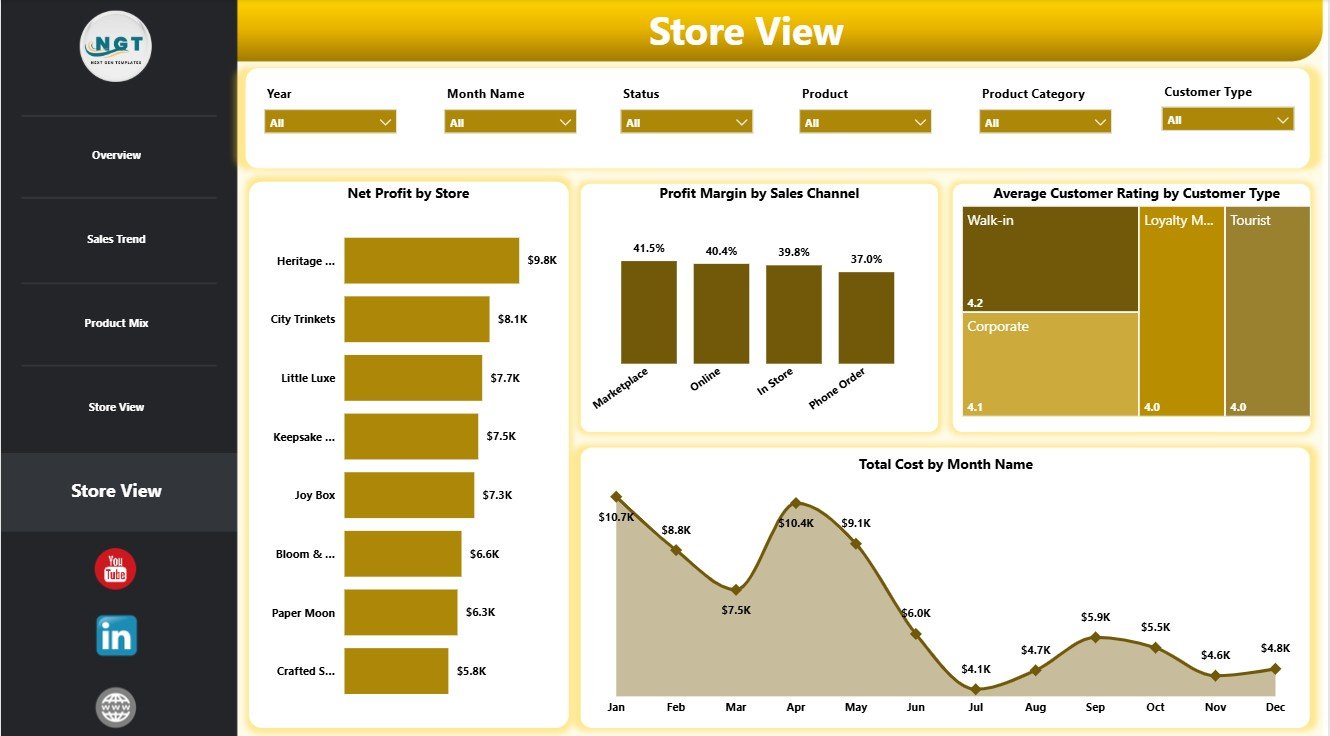
Store Performance
Gift Shops Dashboard in Power BI vs. Tableau vs. Paid Retail SaaS – Where This Fits
| Feature | Gift Shops Dashboard in Power BI | Tableau alternative | Paid retail SaaS |
|---|---|---|---|
| Cost | $17.99 one-time | Requires separate dashboard build and licensing | Monthly or annual subscription |
| Platform | Power BI Desktop | Tableau Desktop or Tableau Cloud | Vendor cloud platform |
| Setup time | Fast when your data matches the template fields | Usually requires report design work | May require onboarding and configuration |
| Real-time team collaboration | Available through Power BI Service if published separately | Available through Tableau Cloud | Usually included by plan |
| Mobile access | Available after publishing to Power BI Service | Available after publishing | Usually included |
| Customizable fields | High in Power BI Desktop | High with Tableau skills | Depends on vendor settings |
| Share with link | Possible through Power BI Service | Possible through Tableau Cloud | Usually included |
| Year-1 cost at 5 users | $17.99 plus any Microsoft licensing you choose | Often much higher | Often hundreds or thousands of dollars |
| Gift shop product analysis | Pre-built pages and visuals | Must be built or customized | Depends on retail system |
Who This Template Is For – and Who It’s Not For
This template is for independent gift shops, souvenir stores, museum shops, boutique retailers, retail analysts, finance teams, and store managers who want a Power BI dashboard for revenue, cost, product, and store analysis.
It is not the best fit if you need live POS sync, barcode inventory automation, employee scheduling, accounting-system writeback, or a complete retail operations system. For those needs, a dedicated retail SaaS or custom Power BI implementation may be better.
How to Use the Gift Shops Dashboard in Power BI
- Download and unzip the product file.
- Open the .pbix file in Power BI Desktop.
- Review the sample data structure and replace it with your own source data.
- Refresh the report so all pages update.
- Use slicers to filter by store, product, category, region, month, sales channel, promotion, or customer type.
- Review the Overview page first, then move into Sales Trend, Product Mix, and Store View pages for deeper analysis.
Real-World Use Cases
Maya, a gift shop owner, uses monthly revenue and cost visuals to prepare for seasonal buying periods and holiday promotions.
Daniel, a regional retail manager, compares revenue, profit margin, and customer rating by store to identify which locations need support.
Sophia, a retail analyst, studies product margin, product-level net profit, and completion rate to improve product mix decisions.
Frequently Asked Questions
What does the Gift Shops Dashboard in Power BI track?
It tracks quantity, cost, revenue, net profit, transactions, profit margin, completion rate, product category, promotion, sales channel, store, region, city, customer type, product, month, and customer rating.
Do I need Power BI Desktop?
Yes. Open the .pbix file in Power BI Desktop, which is available from Microsoft.
Can I customize the report?
Yes. You can edit visuals, filters, pages, fields, colors, calculations, and report layout in Power BI Desktop.
Can I use it for multiple stores?
Yes. The Store View and store performance pages are designed for location-level comparison.
Is this a subscription?
No. The template is a one-time purchase. Any separate Microsoft licensing depends on how you choose to publish or share the report.
About the Author
Built by PK – Microsoft Certified Professional with 15+ years of Excel, Google Sheets, and Power BI experience. Founder of NextGenTemplates, reaching 300K+ subscribers across YouTube channels. Every template is hand-built and tested before release.
Explore Related Templates
You may also like the Gift Shops Dashboard in Excel or the Power BI Dashboard Templates category.
Download the Gift Shops Dashboard in Power BI today and start reviewing gift shop sales, costs, products, stores, and customers in a clean Power BI report.
Last updated: June 2026


Reviews
There are no reviews yet.