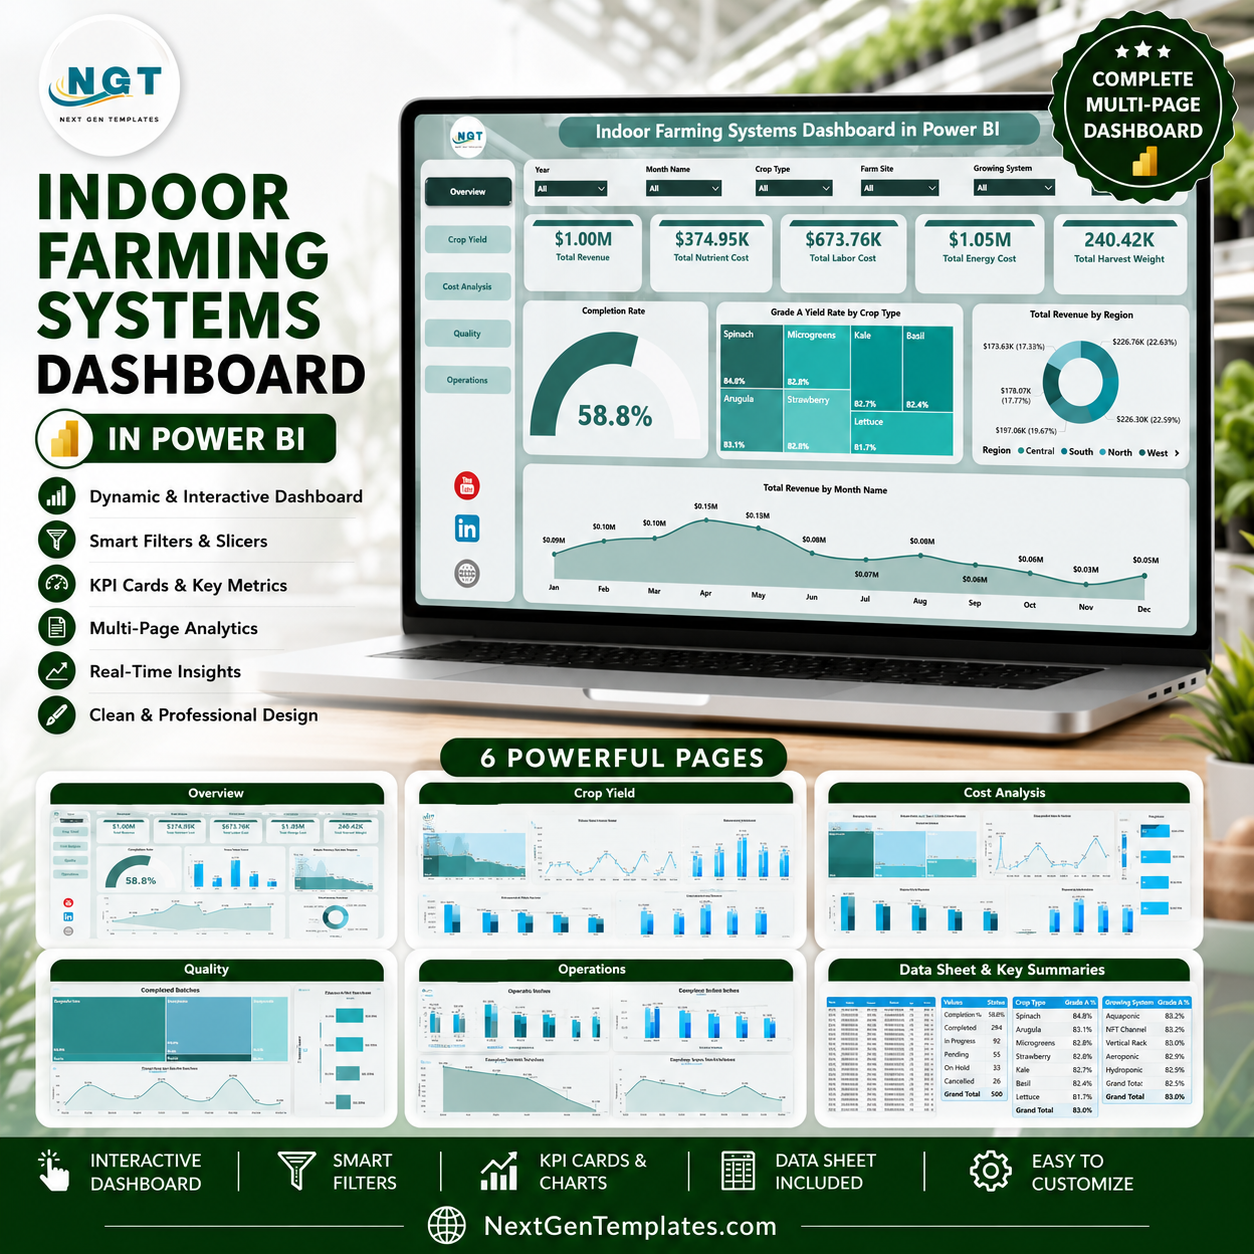
Indoor Farming Systems Dashboard in Power BI helps indoor farm owners, controlled-environment agriculture teams, crop managers, operations leads, and agribusiness analysts monitor revenue, nutrient cost, labor cost, energy cost, harvest weight, completion rate, Grade A yield, regions, crop types, growing systems, zones, technicians, and months in one editable PBIX report. Many indoor farms manage 100+ batch records across sites and production zones, but reporting becomes slow when quality, cost, and operations sit in separate spreadsheets. For $17.99 one-time, this Power BI dashboard gives you 5 analysis pages, KPI cards, slicers, and ready visuals. Open it in Power BI Desktop, replace the sample data, and customize it for your own farm reporting.
Key Features of Indoor Farming Systems Dashboard in Power BI
- 5 Power BI pages for Overview, Crop Yield, Cost Analysis, Quality, and Operations.
- Executive KPI cards for Total Revenue, Total Nutrient Cost, Total Labor Cost, Total Energy Cost, and Total Harvest Weight.
- Crop yield analysis by growing system, crop type, month, zone, and production cost areas.
- Cost analysis for revenue, nutrient cost, labor cost, energy cost, farm site, region, and growing system.
- Quality review for completed batches, Grade A yield rate, region, month, and zone-level cost signals.
- Operations reporting for harvest weight, technician completion rate, and energy cost by quarter.
- Interactive slicers to filter the report quickly during farm reviews and management meetings.
- Editable PBIX file built for Power BI Desktop customization and optional Power BI Service sharing.
What’s Inside the Indoor Farming Systems Dashboard in Power BI
1. Overview Page
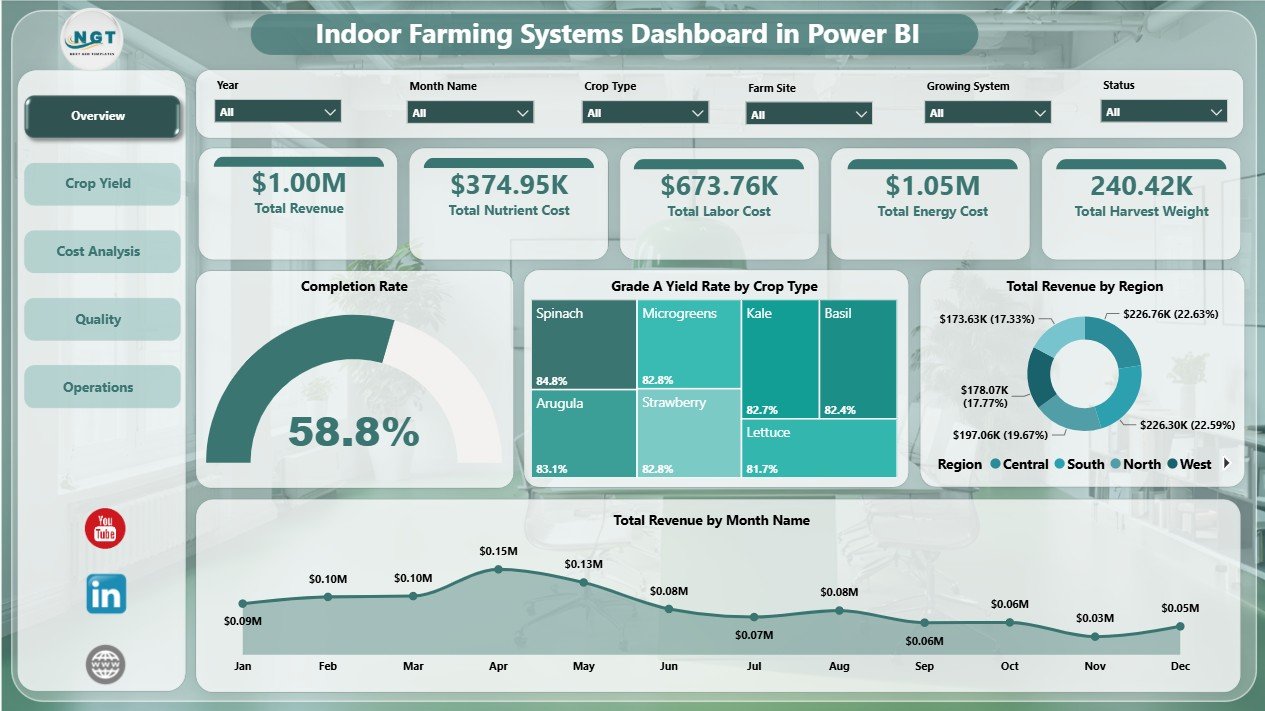
The Overview page is the executive summary of the indoor farming report. KPI cards show Total Revenue, Total Nutrient Cost, Total Labor Cost, Total Energy Cost, and Total Harvest Weight so users can quickly review financial pressure, input cost, labor spend, energy spend, and production output.
Completion Rate by Status: This chart shows the completion rate across operating statuses. It helps managers see which batch stages are progressing well and which statuses may need follow-up.
Grade A Yield Rate by Crop Type: This visual compares premium yield performance by crop type. It helps crop managers identify crops that consistently deliver higher quality output.
Total Revenue by Region: This chart compares revenue contribution across regions. It helps leadership identify stronger markets or production regions for commercial review.
Total Revenue by Month Name: This chart shows month-wise revenue movement. It helps users spot seasonal patterns, high-performing months, and periods that need investigation.
2. Crop Yield
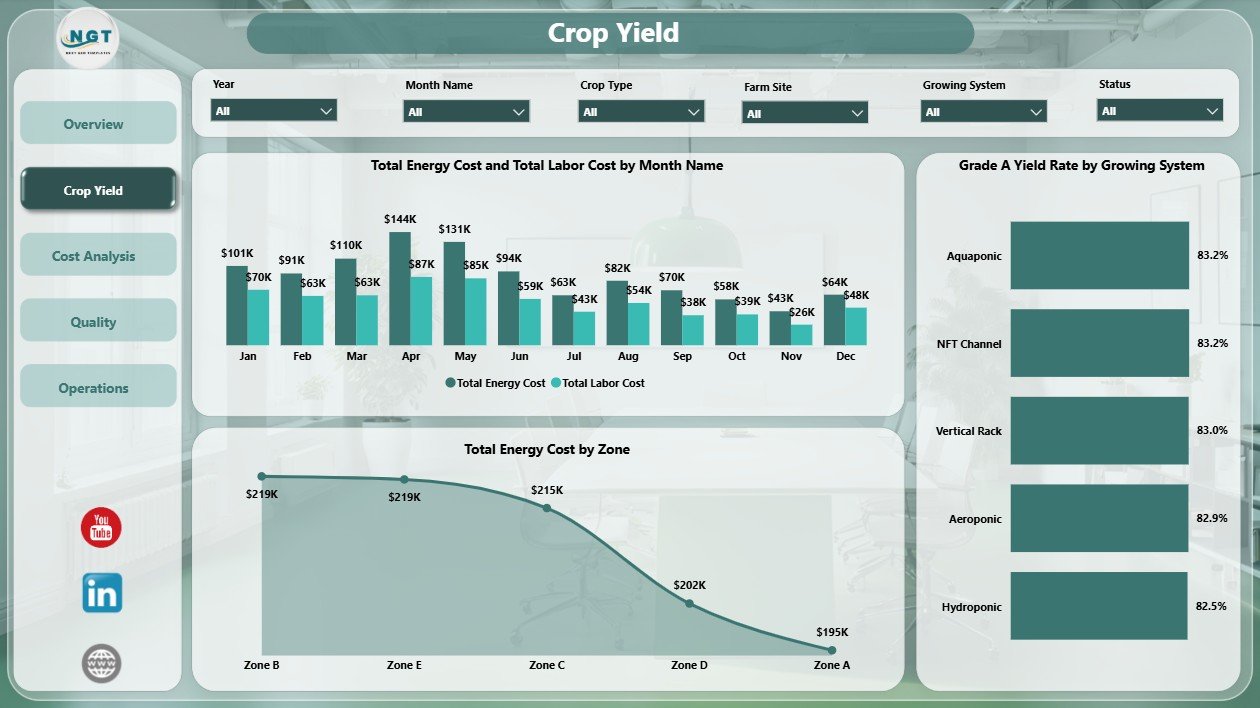
The Crop Yield page focuses on production quality and operating effort. Total Energy Cost and Total Labor Cost by Month Name compares two major cost lines across time, helping users detect months where energy or labor is rising. Grade A Yield Rate by Growing System compares output quality across cultivation methods, while Total Energy Cost by Zone highlights zones with higher energy demand.
3. Cost Analysis
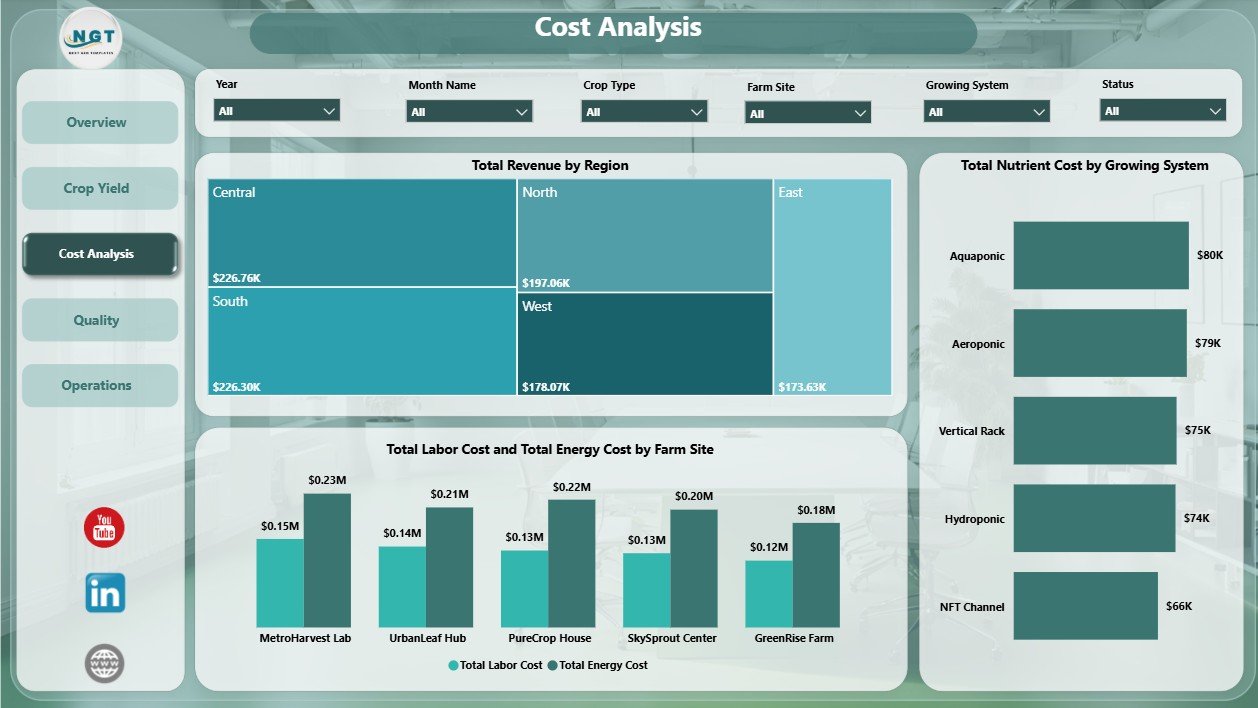
The Cost Analysis page gives finance and operations teams a cost-focused view of indoor farming performance. Total Revenue by Region identifies where revenue is strongest. Total Nutrient Cost by Growing System helps compare input cost by cultivation method. Total Labor Cost and Total Energy Cost by Farm Site shows site-level operating cost pressure for better budgeting and review.
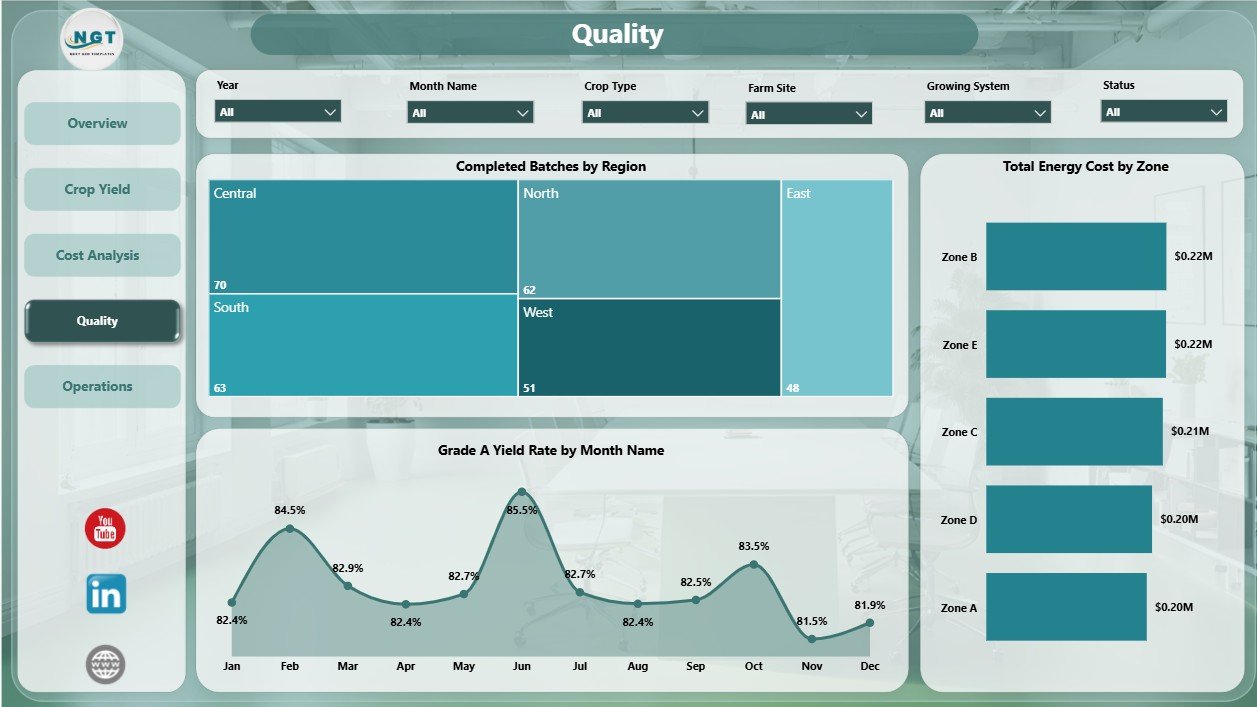
4. Quality
The Quality page connects batch progress with yield quality and zone performance. Completed Batches by Region shows where production completion is strongest. Grade A Yield Rate by Month Name tracks premium output over time. Total Energy Cost by Zone helps users compare zone-level energy load during quality reviews.
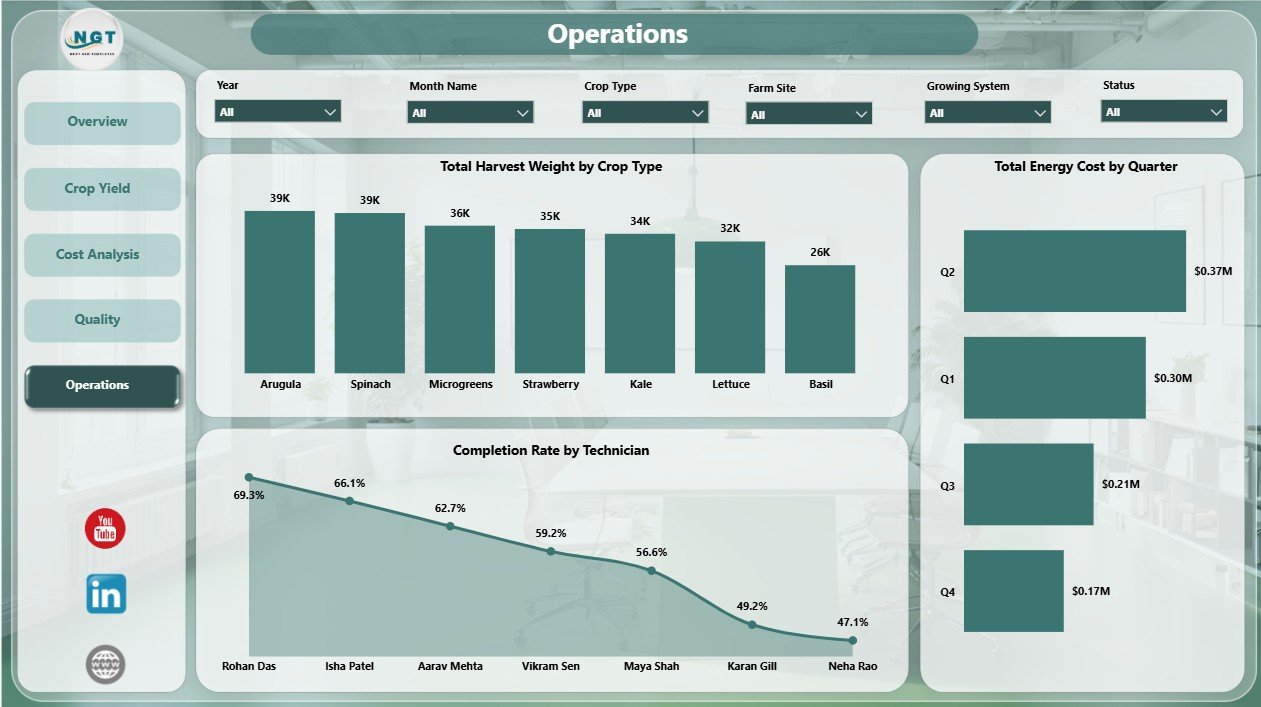
5. Operations
The Operations page supports weekly execution reviews. Total Harvest Weight by Crop Type compares production output across crops. Completion Rate by Technician helps managers review technician-level throughput. Total Energy Cost by Quarter shows quarterly energy cost trends for planning and cost control.
Indoor Farming Systems Dashboard in Power BI vs. Tableau vs. Paid Farm SaaS – Where This Fits
| Feature | This Power BI Dashboard | Tableau or Qlik Alternative | Paid Farm SaaS |
|---|---|---|---|
| Cost | $17.99 one-time template | License cost plus dashboard build time | Monthly or annual subscription |
| Platform | Power BI Desktop and Power BI Service | Tableau or Qlik environment | Vendor cloud platform |
| Setup time | Open PBIX, connect or replace data, refresh | Build model and visuals manually | Onboarding and configuration |
| Real-time team collaboration | Available after publishing to Power BI Service | Available by plan | Usually included by plan |
| Mobile access | Power BI mobile app after publishing | Vendor mobile app | Usually included |
| Customizable fields | Edit model, visuals, measures, pages, and slicers | Editable with platform skills | Depends on vendor permissions |
| Share with link | Available through Power BI permissions | Available through platform permissions | Usually login controlled |
| Year-1 cost at 5 users | Template cost plus any Microsoft licensing | License cost plus analyst time | Often hundreds or thousands |
| Indoor farming metrics | Revenue, nutrient cost, labor, energy, harvest, completion, Grade A yield, zones, and technicians | Must be designed manually | Depends on product module |
Who This Template Is For – and Who It’s Not For
This template is for indoor farm owners, vertical farm teams, greenhouse operators, controlled-environment agriculture analysts, crop managers, quality leads, operations managers, and consultants who need Power BI reporting for crop production, input cost, labor, energy, revenue, quality, and technician performance. It is not a live climate-control system, IoT automation platform, ERP system, payroll tool, procurement workflow, or compliance database.
How to Use the Indoor Farming Systems Dashboard in Power BI
- Download and unzip the product file.
- Open the PBIX file in Power BI Desktop.
- Review the sample model, pages, cards, charts, and slicers.
- Replace or connect the data source with your indoor farming records.
- Refresh the report and check each page.
- Use slicers to filter by region, crop type, growing system, zone, technician, status, month, or available fields.
- Publish to Power BI Service if your team needs browser access, sharing, or scheduled refresh.
Real-World Use Cases
Priya, indoor farm owner: reviews Total Revenue, Total Nutrient Cost, Total Labor Cost, Total Energy Cost, and Total Harvest Weight before weekly leadership meetings.
Marco, operations manager: compares completion rate by status, technician, and quarter to identify where batch execution needs follow-up.
Elena, agribusiness consultant: uses crop yield, cost analysis, and quality pages to prepare client reports on Grade A yield, energy cost, nutrient cost, regions, and farm sites.
Frequently Asked Questions
What does this Power BI dashboard track?
It tracks revenue, nutrient cost, labor cost, energy cost, harvest weight, completion rate, Grade A yield rate, crop type, region, month, growing system, zone, farm site, technician, quarter, and status.
Do I need Power BI Desktop?
Yes. Open the PBIX file in Power BI Desktop, which is free from Microsoft. Power BI Service is optional for online sharing.
Can I customize the dashboard?
Yes. You can edit visuals, measures, pages, slicers, labels, colors, and source connections in Power BI Desktop.
Can I use my own indoor farm data?
Yes. Replace the sample data or connect your own structured source, then refresh the report.
Is this a farm management system?
No. It is a reporting dashboard for prepared data, not a full operations, automation, payroll, procurement, or compliance system.
Is this a subscription?
No. It is a one-time downloadable Power BI template purchase.
About the Author
Built by PK – Microsoft Certified Professional with 15+ years of Excel, Google Sheets, and Power BI experience. Founder of NextGenTemplates, reaching 300K+ subscribers across YouTube channels. Every template is hand-built and tested before release.
Explore Related Templates
Pair this dashboard with Indoor Farming Systems Dashboard in Excel, Agriculture and Farm Dashboard in Power BI, Greenhouse Farming Dashboard in Power BI, and Vertical Farming Dashboard in Power BI. Browse more Power BI Dashboard templates and Power BI templates.
Download the Indoor Farming Systems Dashboard in Power BI and start reviewing indoor farming revenue, nutrient cost, labor, energy, harvest, quality, completion, and operations in one editable report.
Last updated: June 22, 2026.


Reviews
There are no reviews yet.