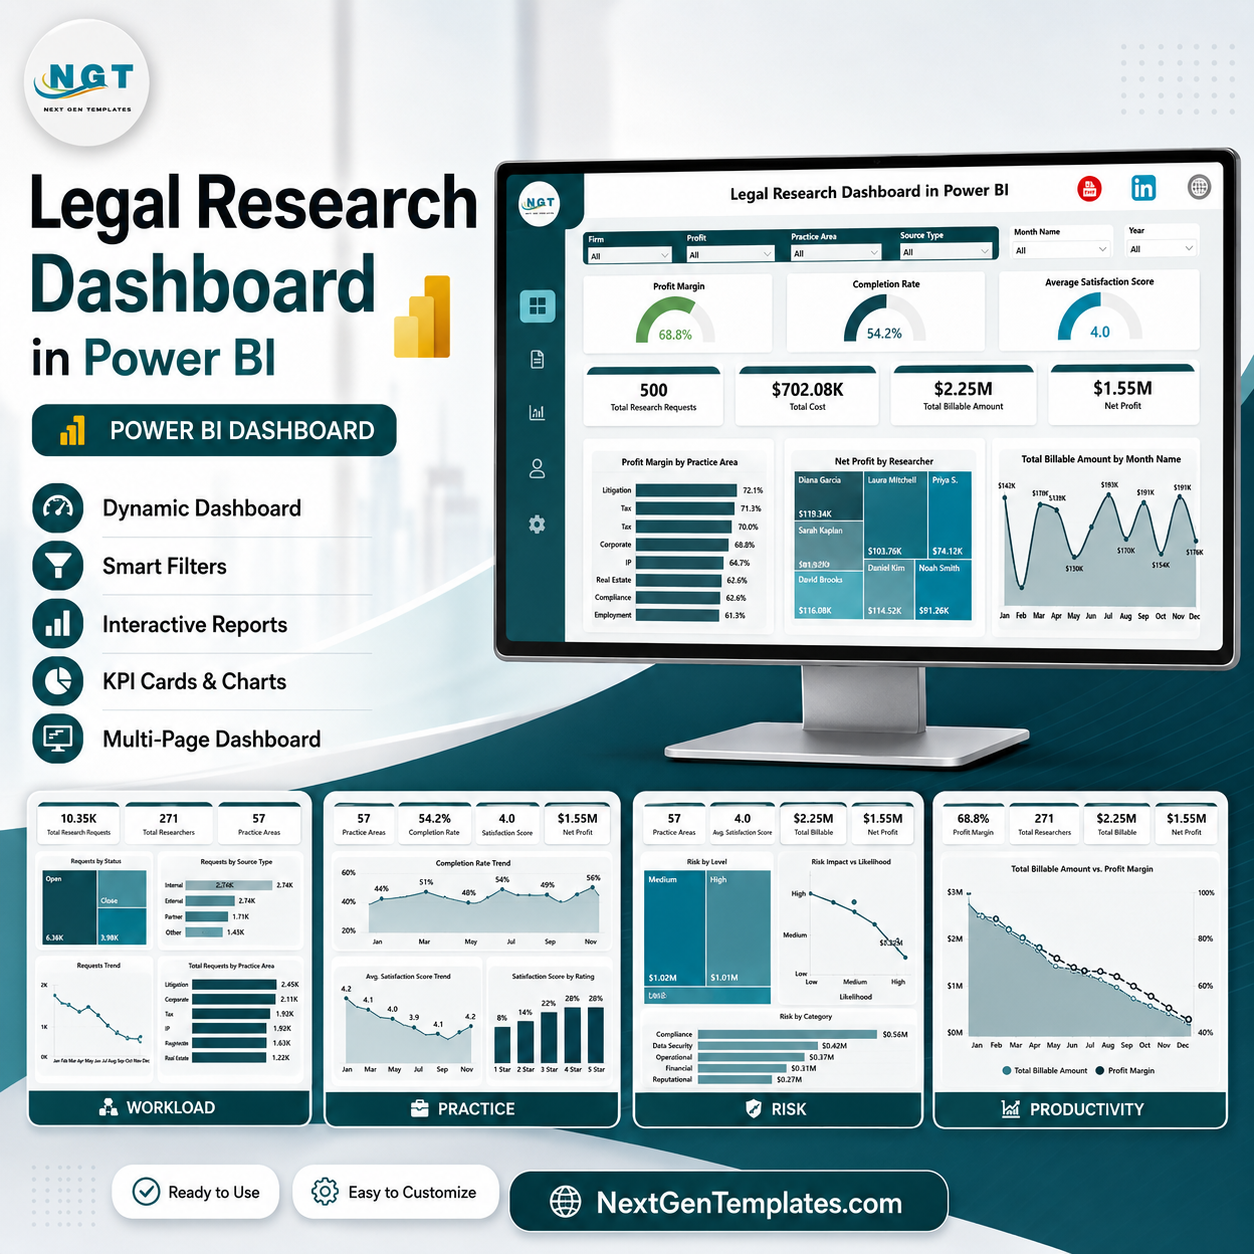
Legal Research Dashboard in Power BI gives law firms, legal research teams, in-house counsel, compliance groups, and legal operations managers a ready PBIX report with 5 Power BI pages, 7 executive KPI cards, 14 analysis visuals, and multiple slicers. Built for research requests, billable amount, cost, profit margin, completion rate, satisfaction, researcher workload, practice area, client type, priority, source type, risk level, and productivity, it helps teams move from scattered research records to a clear reporting layer. Built by PK, trusted by 300K+ learners across YouTube channels, this one-time download helps you analyze legal research performance without building the report from scratch.
Key Features of Legal Research Dashboard in Power BI
- 5 Power BI report pages: Overview Page, Workload, Practice, Risk, and Productivity.
- 7 high-level cards: Profit Margin, Completion Rate, Average Satisfaction Score, Total Research Requests, Total Cost, Total Billable Amount, and Net Profit.
- Profitability analytics: Review profit margin by practice area, net profit by researcher, billable amount by month, and financial performance by priority.
- Workload tracking: Analyze research hours by year, total cost by researcher, requests by priority, and margin by source type.
- Practice area review: Compare billable amount by practice area and client type, plus profit margin by firm.
- Risk and completion views: Monitor request volume by risk level and completed requests by practice area.
- Interactive slicers: Filter the dashboard quickly by available fields and review the focused story without rebuilding visuals.
- Editable PBIX report: Open in Power BI Desktop, inspect visuals, connect your data, and customize the report for your legal team.
What’s Inside the Legal Research Dashboard in Power BI
1 – Overview Page
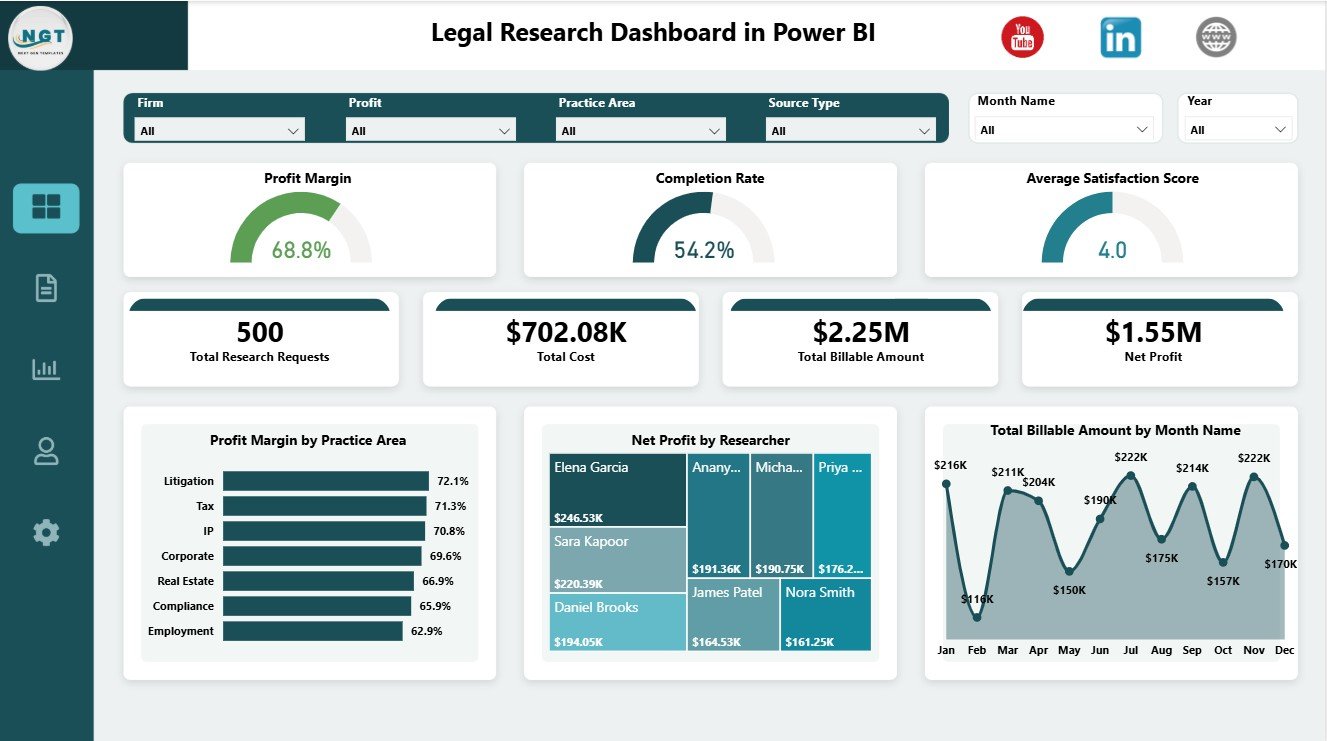
The Overview Page gives leadership a fast summary of legal research economics and service performance. The cards show Profit Margin, Completion Rate, Average Satisfaction Score, Total Research Requests, Total Cost, Total Billable Amount, and Net Profit, while slicers help users filter the dashboard quickly.
Profit Margin by Practice Area: This chart compares profitability across legal practice areas. It helps partners and operations managers see where research work is producing stronger margin after cost.
Net Profit by Researcher: This visual compares profit contribution by researcher. It helps managers review productivity, workload balance, and where support or training may improve output.
Total Billable Amount by Month Name: This monthly trend shows how billable research value changes across the year. It helps teams identify stronger billing months, slower periods, and seasonal demand.
Legal Research Dashboard in Power BI
2 – Workload
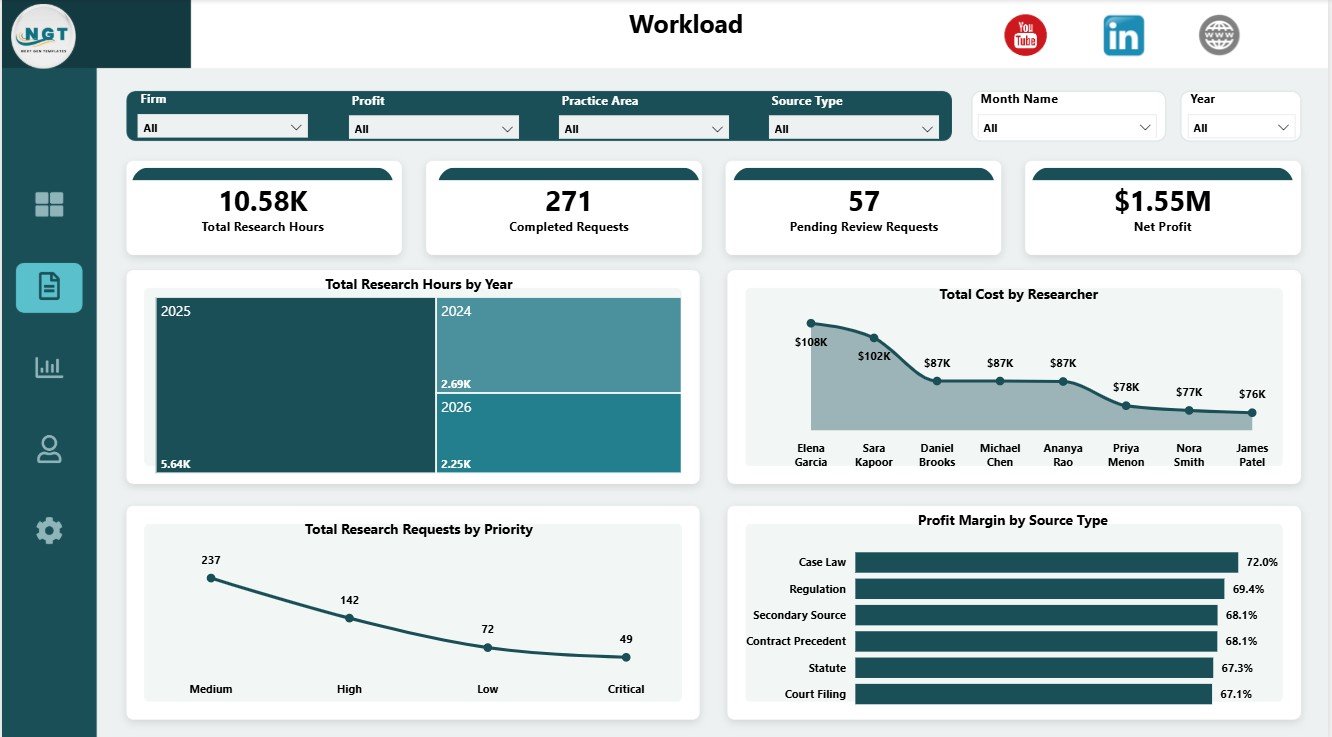
The Workload page helps research managers understand effort, cost pressure, priority mix, and source profitability. It is useful for weekly workload planning and for explaining why certain research queues need more attention.
Total Research Hours by Year: This chart shows how research effort changes year by year. It helps teams understand whether legal research demand is expanding, stable, or declining.
Total Cost by Researcher: This visual compares cost by researcher. It helps managers review resource spend and check whether cost aligns with workload and billable contribution.
Total Research Requests by Priority: This chart breaks requests by priority level. It helps teams see urgent workload pressure and plan staffing around high-priority research demands.
Profit Margin by Source Type: This chart compares margin across source categories. It helps legal teams understand which research sources or authority types create stronger financial outcomes.
Workload
3 – Practice
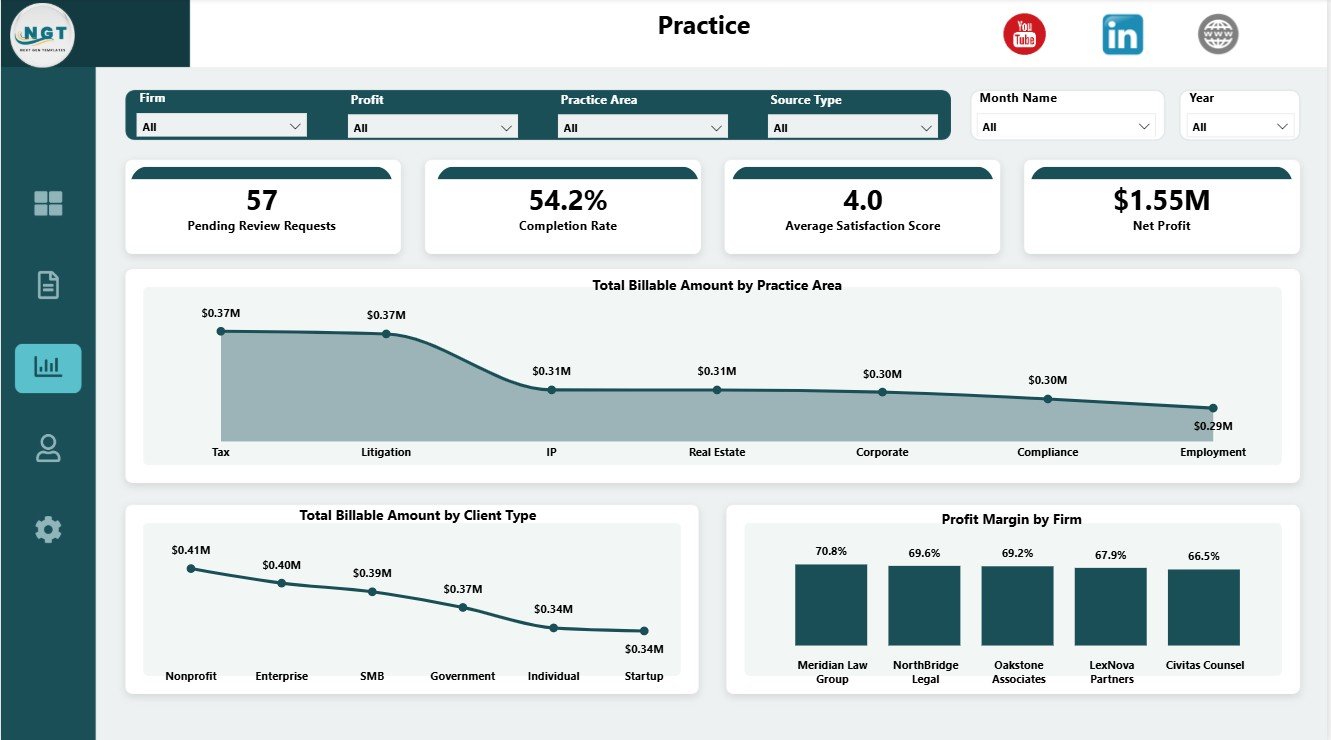
The Practice page focuses on how billable value and margin move across the legal practice structure. It helps partners, practice heads, and legal operations analysts review where research value is being created.
Total Billable Amount by Practice Area: This chart compares billable research value by practice area. It helps identify the legal domains contributing the most revenue.
Total Billable Amount by Client Type: This visual shows billable amount by client type. It helps teams understand whether corporate, individual, internal, or other client groups drive research billing.
Profit Margin by Firm: This chart compares margin by firm. It supports firm-level profitability review and helps identify where pricing, cost control, or scope management may need attention.
Practice
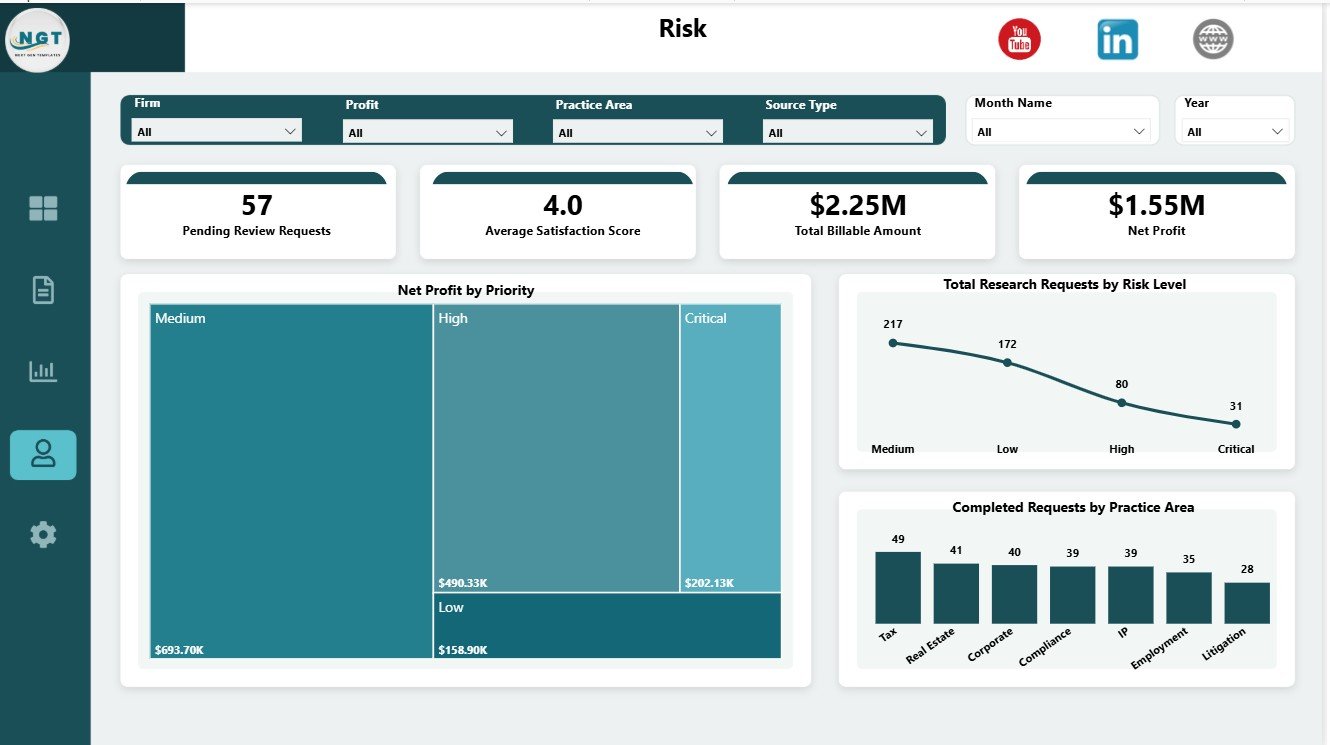
4 – Risk
The Risk page connects priority, risk level, completion, and practice area performance. It is useful when leadership needs to understand whether high-risk research is being completed efficiently.
Net Profit by Priority: This chart compares financial outcome by priority level. It helps teams understand whether urgent or high-priority research is also producing healthy profit.
Total Research Requests by Risk Level: This visual shows request volume by risk level. It helps managers identify where exposure is concentrated and where closer monitoring may be needed.
Completed Requests by Practice Area: This chart compares completed work by practice area. It helps teams see which legal domains are closing research requests efficiently.
Risk
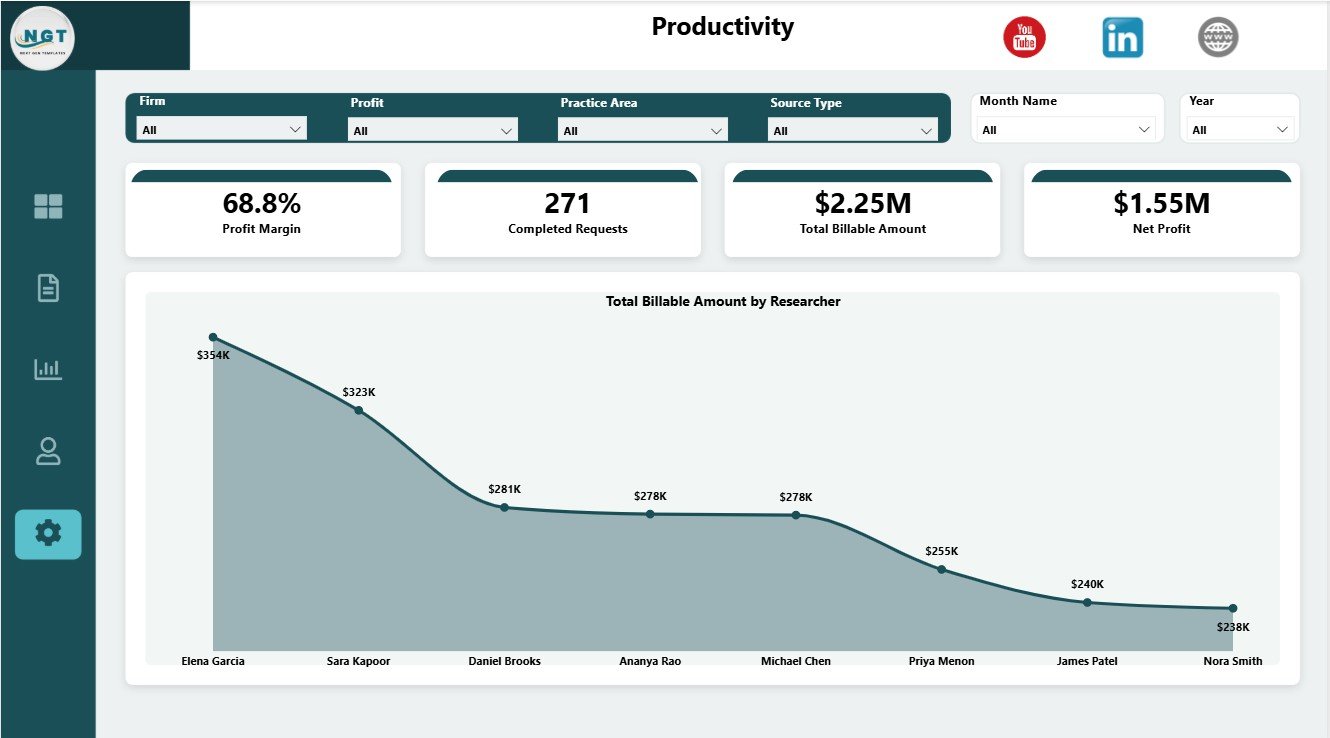
5 – Productivity
The Productivity page gives a focused researcher-level billing view. It is useful for simple contribution review, performance conversations, and identifying researchers who drive the highest billable value.
Total Billable Amount by Researcher: This chart compares billable amount by researcher. It helps managers review individual contribution and connect billing performance with workload planning.
Productivity
Legal Research Dashboard in Power BI vs. Tableau vs. Paid Legal SaaS – Where This Fits
| Feature | This Power BI dashboard | Tableau or Qlik alternative | Paid legal SaaS |
|---|---|---|---|
| Cost | $17.99 one-time download | License plus dashboard build time | Monthly or annual subscription |
| Platform | Power BI Desktop / Power BI Service | Tableau, Qlik, or another BI platform | Vendor-hosted legal platform |
| Setup time | Open PBIX and replace or connect data | Build or adapt report pages | Implementation and onboarding |
| Real-time team collaboration | Possible through Power BI Service | Possible with cloud plans | Usually included |
| Mobile access | Power BI mobile after publishing | Plan dependent | Usually included |
| Customizable fields | Editable model, pages, visuals, and slicers | Editable with BI skills | Limited by vendor permissions |
| Share with link | Available after publishing to Power BI Service | Available with cloud publishing | Login controlled |
| Year-1 cost at 5 users | $17.99 plus any Microsoft licensing | License dependent | Often hundreds or thousands |
| Legal research analytics | Requests, cost, billable amount, margin, risk, practice, and productivity included | Must be built or purchased | Depends on module and reporting plan |
Who This Template Is For – and Who It’s Not For
This template is for law firms, legal research teams, legal operations managers, compliance research teams, practice heads, in-house legal departments, and consultants who already track research records and need a Power BI reporting layer.
It is not a legal research database, AI research engine, document repository, docketing system, secure client portal, timekeeping app, billing system, or CRM. It works best when your team has structured research data and wants a clear dashboard for analysis and presentation.
How to Use the Legal Research Dashboard in Power BI
- Download and unzip the product file.
- Open the PBIX file in Power BI Desktop.
- Review the sample pages, cards, slicers, visuals, and measures.
- Replace the sample dataset or connect your own legal research data source.
- Refresh the report and validate totals for requests, cost, billable amount, margin, and profit.
- Use slicers to review practice area, researcher, firm, client type, priority, source type, risk level, month, or year.
- Publish to Power BI Service only after checking visuals, filters, and access permissions.
Real-World Use Cases
Anika, legal research manager: reviews research requests by priority and total cost by researcher before assigning next-week workload.
Marcus, law firm partner: compares billable amount, net profit, and profit margin by practice area before a monthly leadership meeting.
Priya, legal operations analyst: filters by risk level, source type, and practice area to explain where research effort and financial return are concentrated.
Frequently Asked Questions
What does this Power BI dashboard track?
It tracks profit margin, completion rate, satisfaction, research requests, total cost, billable amount, net profit, workload, practice area, risk, and productivity.
Do I need Power BI Desktop?
Yes. The downloadable file is designed to open in Microsoft Power BI Desktop.
Can I connect my own data?
Yes. You can replace the sample data or connect the PBIX file to your own structured legal research data source.
Can I customize the visuals?
Yes. You can edit pages, visuals, slicers, measures, fields, colors, and labels inside Power BI Desktop.
Is this a full legal research system?
No. It is a reporting dashboard template, not a legal database, AI research tool, or case management system.
Can I publish it to Power BI Service?
Yes, if your Microsoft account, Power BI license, and organizational permissions allow publishing and sharing.
About the Author
Built by PK – Microsoft Certified Professional with 15+ years of Excel, Google Sheets, and Power BI experience. Founder of NextGenTemplates, reaching 300K+ subscribers across YouTube channels. Every template is hand-built and tested before release.
Explore Related Templates
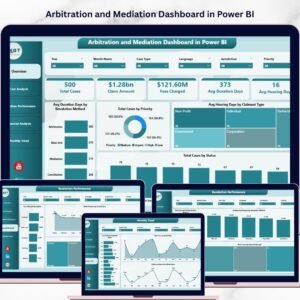
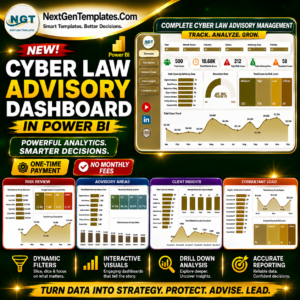
You may also like the Legal Research Dashboard in Excel, Legal Research KPI Dashboard in Power BI, Intellectual Property Law Firms Dashboard in Power BI, and Legal Dashboard in Power BI. Browse more Power BI Dashboard templates.
Download the Legal Research Dashboard in Power BI, open it in Power BI Desktop, replace the sample data, and start reviewing legal research requests, profitability, risk, workload, and productivity from one interactive report.
Watch the step-by-step video tutorial:


Reviews
There are no reviews yet.