

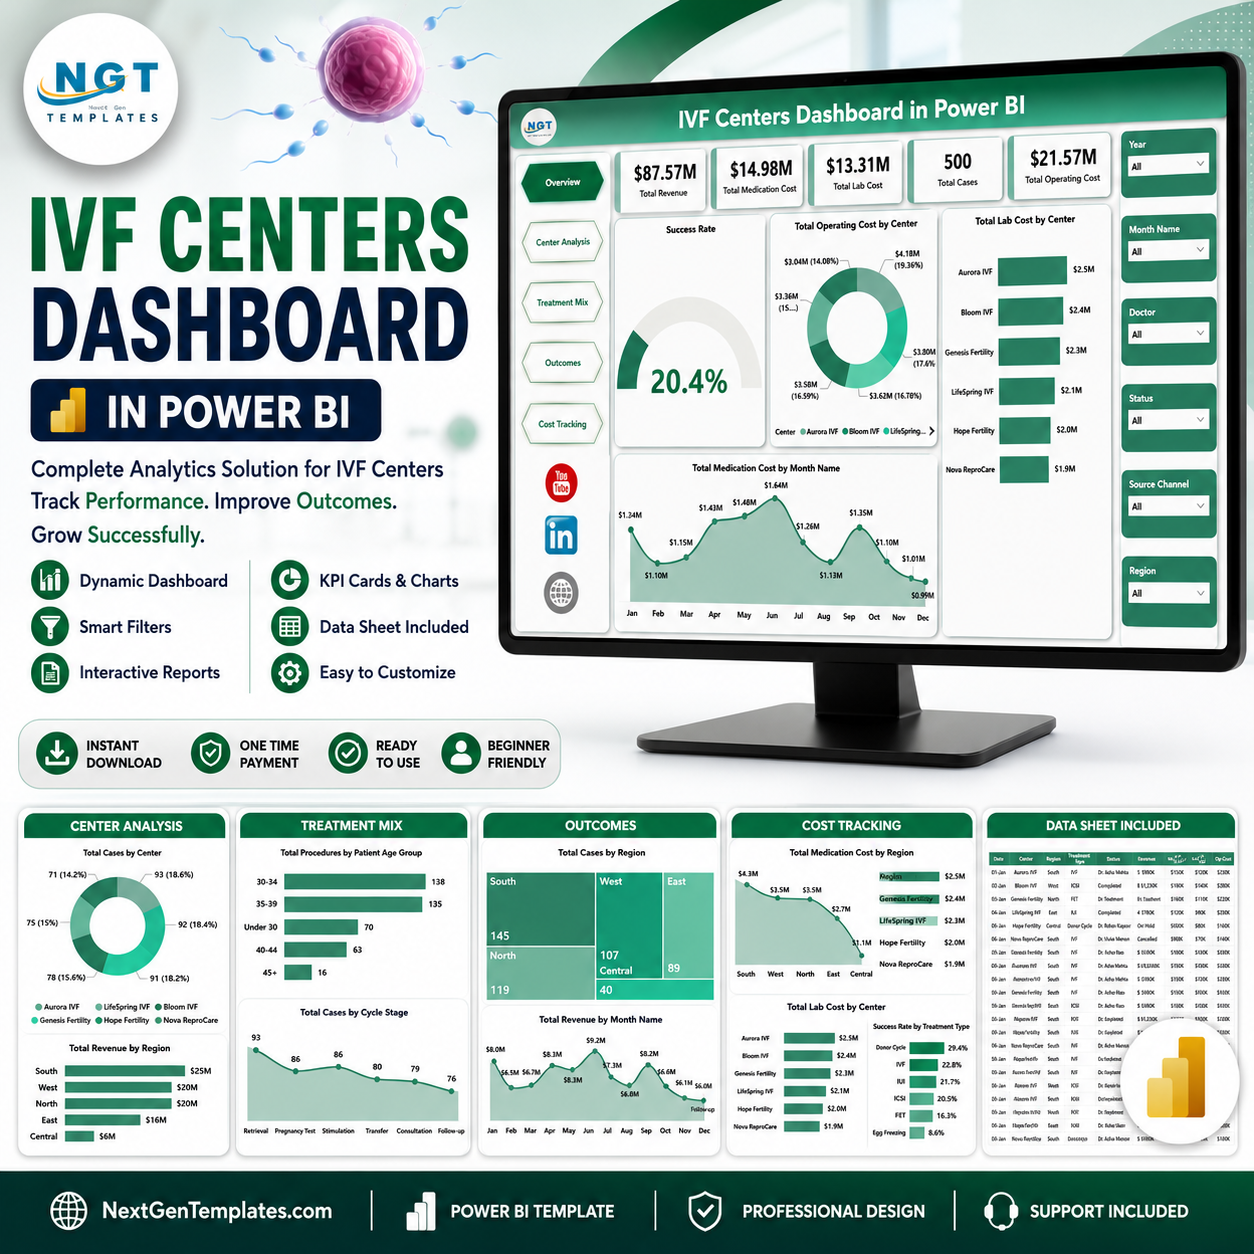

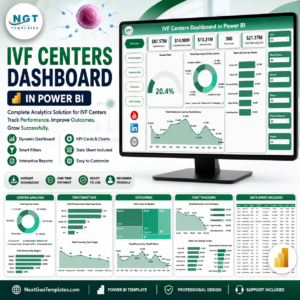
IVF Centers Dashboard in Power BI helps fertility centers turn treatment, revenue, operating cost, medication cost, lab cost, success rate, doctor, center, region, cycle stage, and patient age group data into a clear reporting system. IVF and ART reporting depends on accurate cycle, outcome, and clinic performance data; the CDC notes that U.S. fertility clinics report ART cycles and outcomes annually through ART success rate reporting. This ready PBIX dashboard gives your team 5 Power BI pages, 5 headline KPI cards, multiple slicers, and focused analysis visuals so you can replace sample data, refresh the model, and review center performance faster.
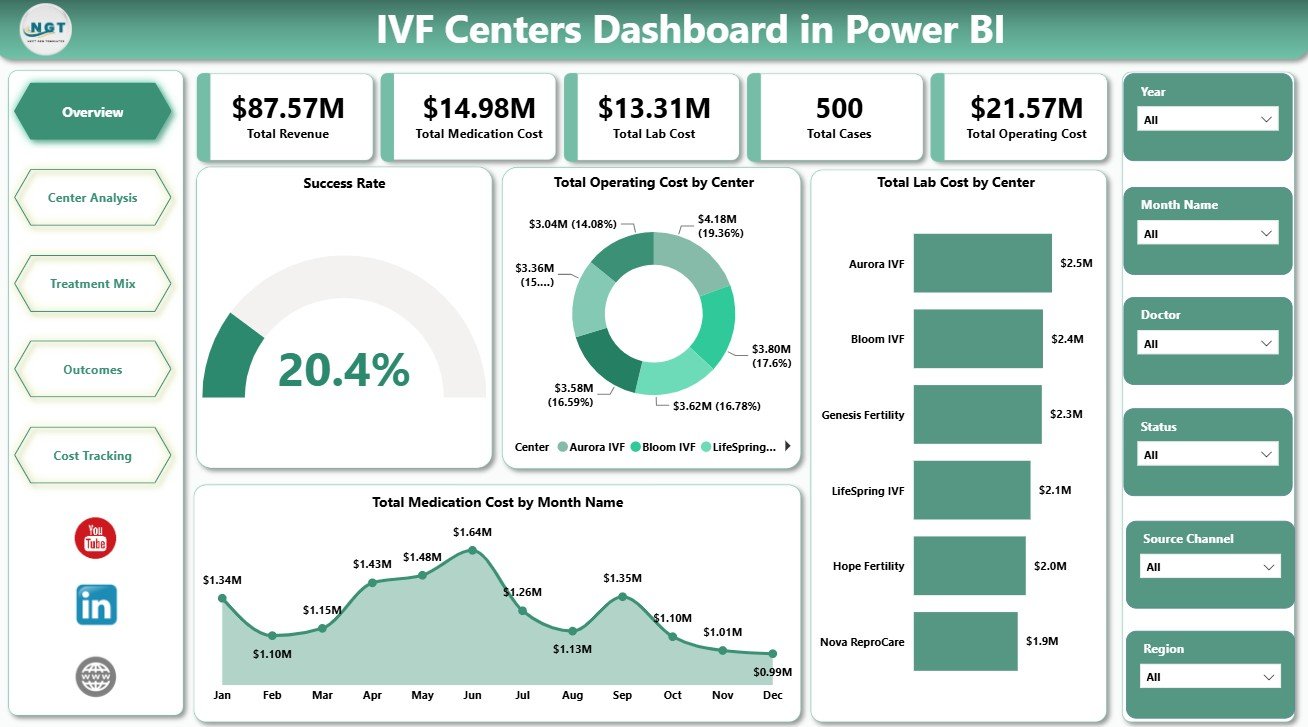
IVF Centers Dashboard in Power BI
Key Features of IVF Centers Dashboard in Power BI
- 5 report pages: Overview, Center Analysis, Treatment Mix, Outcomes, and Cost Tracking.
- Executive KPI cards: Total Revenue, Total Medication Cost, Total Lab Cost, Total Cases, and Total Operating Cost.
- Interactive slicers: Apply quick filters across center, region, month, doctor, treatment type, age group, and cycle stage fields.
- Financial visibility: Track revenue, medication cost, lab cost, and operating cost across centers, doctors, regions, and months.
- Treatment performance: Review success rate by treatment type and overall performance so outcome patterns are easier to spot.
- Editable PBIX file: Customize report pages, visuals, measures, model fields, labels, and data connections in Power BI Desktop.
What’s Inside the IVF Centers Dashboard in Power BI
1. Overview Page
The Overview Page gives a leadership-level view of IVF center operations. The top cards show Total Revenue, Total Medication Cost, Total Lab Cost, Total Cases, and Total Operating Cost so managers can quickly understand volume, cost, and financial activity.
Success Rate by Overall Performance: This chart shows how performance categories contribute to overall IVF success rate. It helps managers identify whether outcomes are clustering around strong, average, or weaker performance bands.
Total Operating Cost by Center: This visual compares operating cost across IVF centers. It helps finance and operations teams find high-cost centers that may need deeper review.
Total Lab Cost by Center: This chart highlights lab cost by center. It supports lab budget monitoring and helps compare cost patterns between locations.
Total Medication Cost by Month Name: This monthly trend shows how medication cost changes over time. It helps teams spot seasonal movement, unusual spikes, and planning needs.
2. Center Analysis
The Center Analysis page compares performance by center, doctor, and region. It is useful for operations leaders who need to understand where cases, procedures, and revenue are concentrated.
Total Cases by Center: This chart compares case volume across centers. It helps identify high-volume locations and centers that may need growth or capacity support.
Total Procedures by Doctor: This visual shows procedure count by doctor. It supports workload analysis, staffing review, and provider-level reporting.
Total Revenue by Region: This chart compares revenue across regions. It helps leadership understand geographic revenue contribution and regional performance.
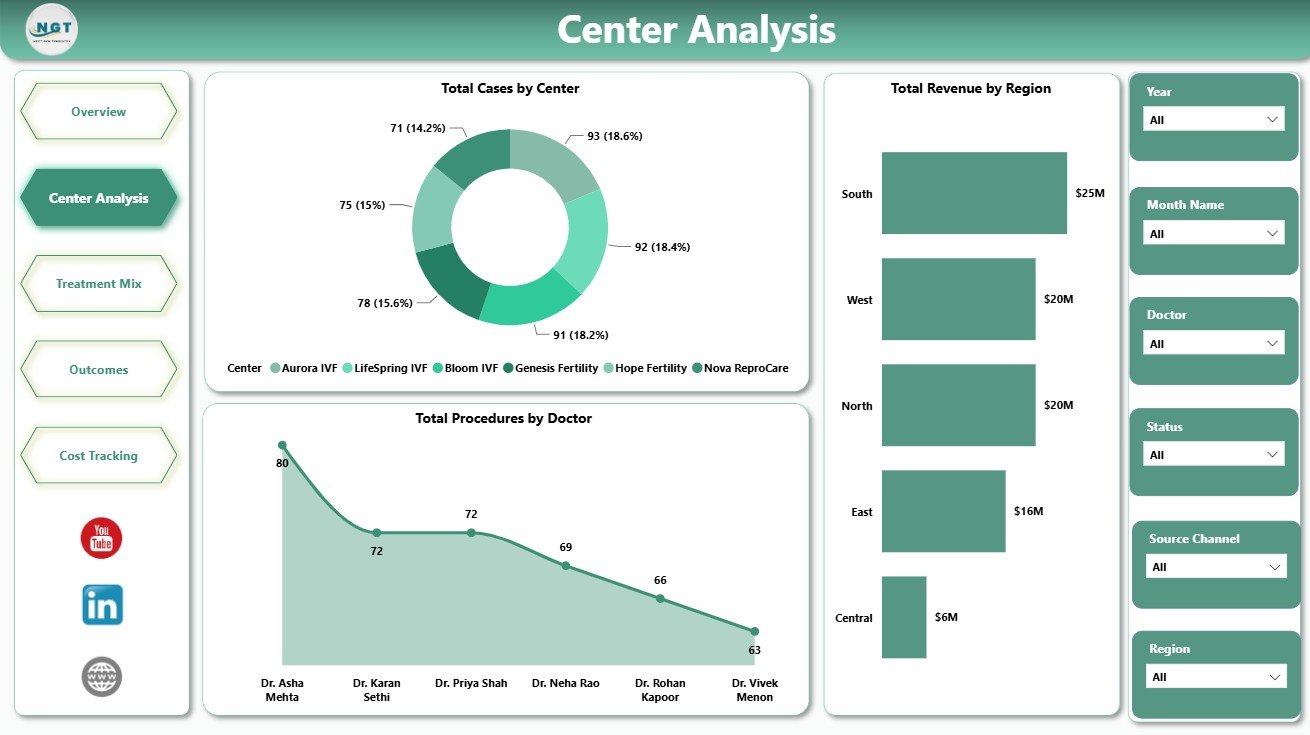
Center Analysis
3. Treatment Mix
The Treatment Mix page explains the distribution of procedures, cycle stages, and operating cost by treatment type. It helps teams see which patient groups and treatment paths drive activity.
Total Procedures by Patient Age Group: This chart compares procedure volume across patient age bands. It helps clinics understand demand patterns by age group.
Total Cases by Cycle Stage: This visual groups cases by cycle stage. It helps teams monitor where patients are concentrated in the IVF treatment journey.
Total Operating Cost by Treatment Type: This chart compares operating cost across treatment types. It helps identify treatments with higher delivery cost and review cost efficiency.
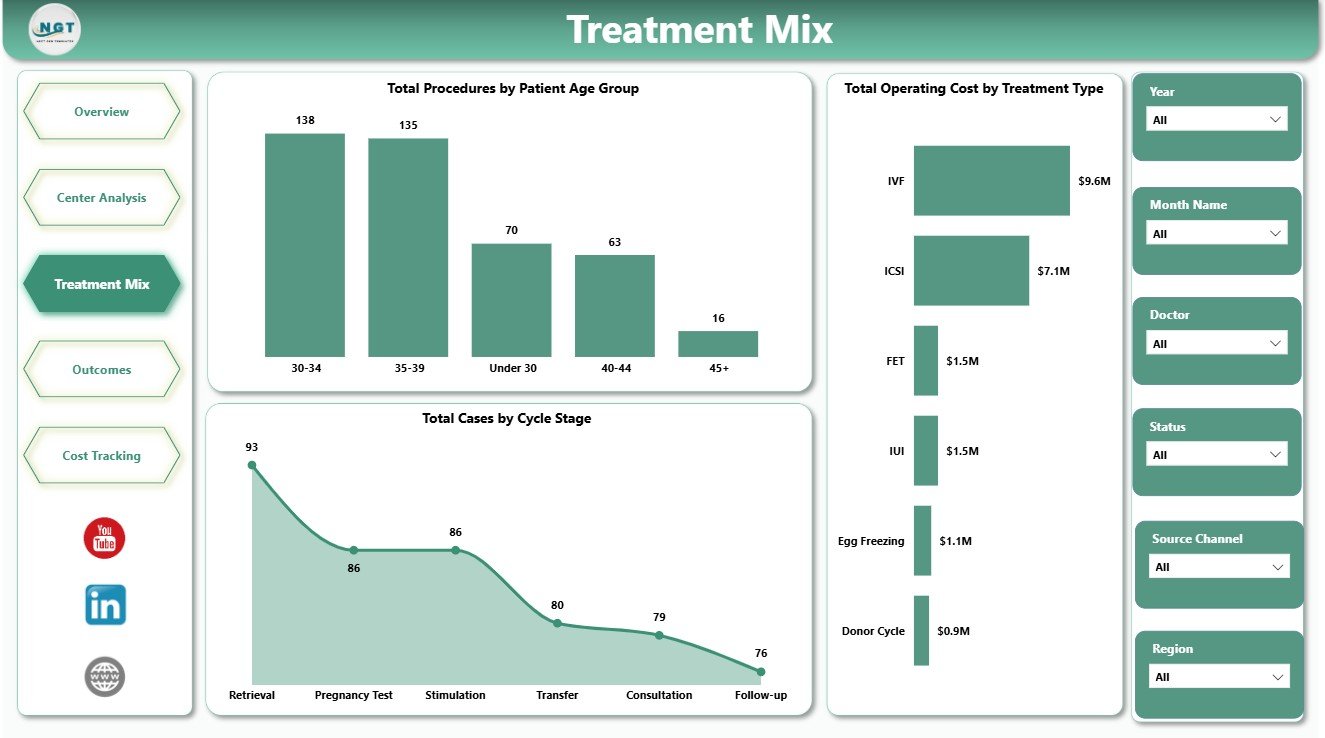
Treatment Mix
4. Outcomes
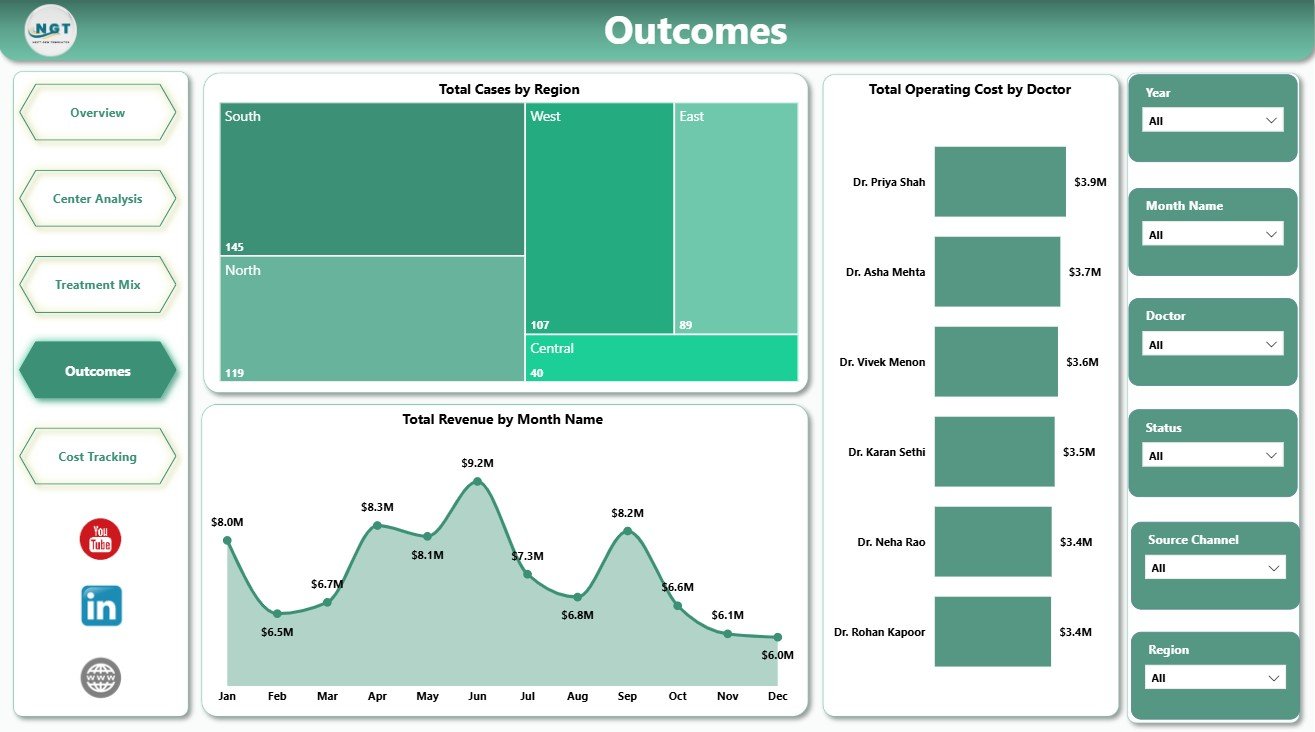
The Outcomes page connects case distribution, revenue movement, and doctor-level operating cost. It gives decision-makers a practical view of where outcomes and operating activity are happening.
Total Cases by Region: This chart compares case volume by region. It helps managers see geographic demand and regional treatment activity.
Total Revenue by Month Name: This visual tracks monthly revenue movement. It helps finance teams identify trend shifts and compare month-to-month results.
Total Operating Cost by Doctor: This chart compares operating cost by doctor. It helps review cost patterns by provider without turning the dashboard into a clinical judgment tool.
Outcomes
5. Cost Tracking
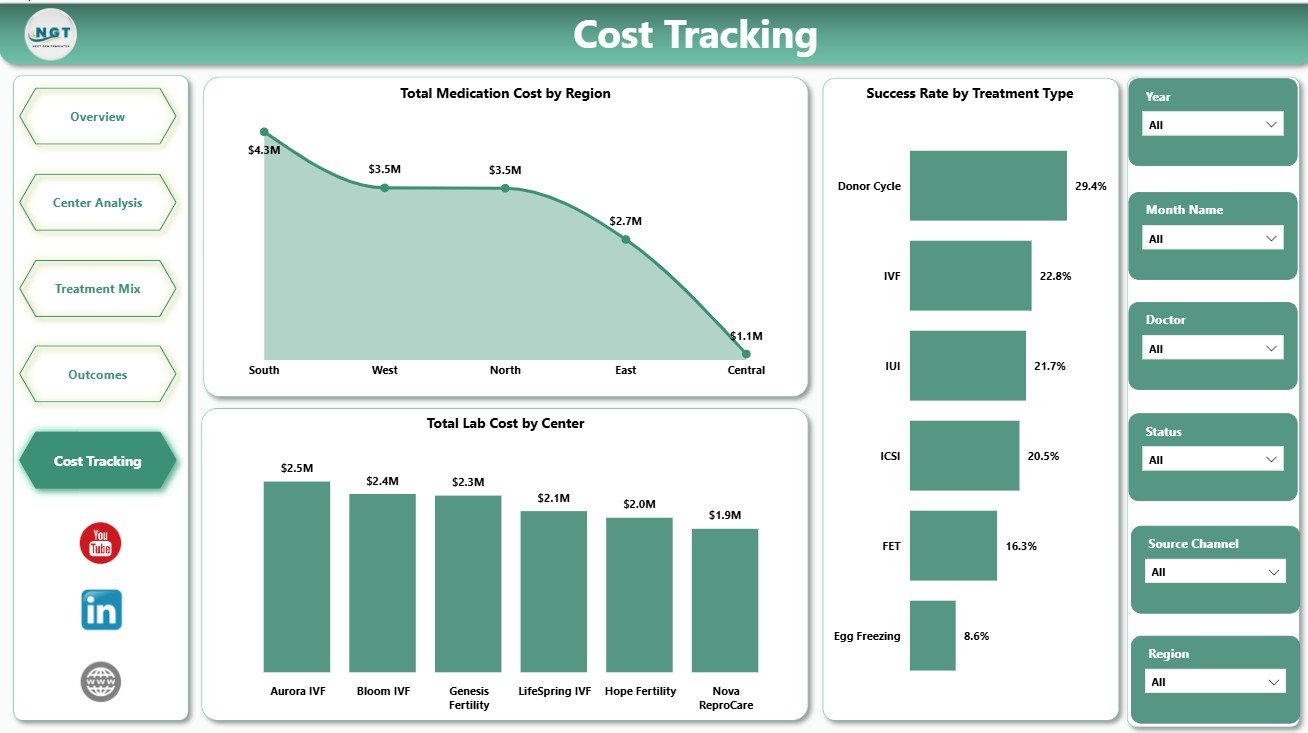
The Cost Tracking page focuses on medication cost, lab cost, and success rate analysis. It is helpful for finance, operations, and center managers who need to understand cost drivers.
Total Medication Cost by Region: This chart compares medication cost across regions. It helps identify regional cost differences and budget pressure.
Total Lab Cost by Center: This visual compares lab cost across centers. It helps track location-level lab spending and detect centers that need cost review.
Success Rate by Treatment Type: This chart compares outcome rate across treatment types. It helps teams evaluate patterns for internal reporting and performance review.
Cost Tracking
IVF Centers Dashboard in Power BI vs. Tableau vs. Paid Healthcare SaaS – Where This Fits
| Feature | This Power BI dashboard | Tableau alternative | Paid healthcare SaaS |
|---|---|---|---|
| Cost | $17.99 one-time | License plus dashboard build time | Monthly or annual subscription |
| Platform | Power BI Desktop PBIX | Tableau Desktop or Cloud | Vendor-hosted platform |
| Setup time | Open, connect or replace data, refresh | Build model and visuals | Implementation project |
| Customizable fields | Editable visuals, model, measures, and slicers | Editable with Tableau skills | Limited by vendor settings |
| IVF operations analytics | Built-in center, treatment, outcome, and cost pages | Must be designed | Depends on module and plan |
| Year-1 cost at 5 users | $17.99 plus any Microsoft licensing | Often higher license or build cost | Often hundreds or thousands |
Who This Template Is For – and Who It’s Not For
This template is for IVF center owners, fertility clinic administrators, operations managers, finance teams, healthcare analysts, and consultants who need an editable Power BI reporting layer for clinic activity. It is not an EMR, patient record system, appointment system, billing platform, laboratory information system, or medical decision tool.
How to Use the IVF Centers Dashboard in Power BI
- Download and unzip the product file.
- Open the PBIX file in Power BI Desktop.
- Review the Overview, Center Analysis, Treatment Mix, Outcomes, and Cost Tracking pages.
- Replace or connect your own IVF center data using the same field structure.
- Refresh the model and validate cards, charts, and slicers.
- Customize visuals, measures, colors, and filters as needed before publishing internally.
Real-World Use Cases
Dr. Meera, clinic director: reviews Total Cases, Total Revenue, and success-rate patterns before monthly performance meetings.
Arjun, finance manager: uses Cost Tracking to compare medication cost, lab cost, and operating cost by center, doctor, and region.
Sofia, healthcare analyst: uses Treatment Mix and Outcomes pages to prepare center-level reporting packs for leadership.
Frequently Asked Questions
Do I need Power BI Desktop?
Yes. Open and edit the PBIX file in Power BI Desktop, which is available from Microsoft.
Can I replace the sample data?
Yes. Replace or connect your own structured IVF center data, then refresh the report and verify the visuals.
Can I customize the dashboard?
Yes. You can edit report pages, charts, fields, measures, slicers, colors, and labels.
Is this a medical system?
No. This is a business intelligence dashboard for reporting and analysis. It does not replace clinical systems or medical judgment.
Does it include cost analysis?
Yes. It includes medication cost, lab cost, operating cost, revenue, center, doctor, region, and treatment type views.
Is this a subscription?
No. This is a one-time downloadable Power BI template from NextGenTemplates.
About the Author
Built by PK – Microsoft Certified Professional with 15+ years of Excel, Google Sheets, and Power BI experience. Founder of NextGenTemplates, reaching 300K+ subscribers across YouTube channels. Every template is hand-built and tested before release.
Explore Related Templates
You may also like IVF Centers Dashboard in Excel, IVF Centers KPI Dashboard in Power BI, and Home Healthcare KPI Dashboard in Excel. Browse more Power BI templates and Power BI dashboard templates.
Download the IVF Centers Dashboard in Power BI today and turn fertility center revenue, cost, treatment, outcome, doctor, region, and center data into interactive reporting.
Last updated: June 27, 2026.
Watch the step-by-step video tutorial:
Compatibility and Requirements
- Works in Power BI Desktop, which is free. Microsoft explains how to get it in Get Power BI Desktop.
- The file is a PBIX report that you open and edit on your computer.
More Questions About This Template
Which pages are included?
Five pages: Overview, Center Analysis, Treatment Mix, Outcomes and Cost Tracking.
Which KPI cards are on the Overview page?
Total Revenue, Total Medication Cost, Total Lab Cost, Total Cases and Total Operating Cost.
Can I see success rate by treatment type?
Yes. The Cost Tracking page has a Success Rate by Treatment Type chart, and the Overview page shows Success Rate by Overall Performance.
Is there an Excel version?
Yes. See the IVF Centers Dashboard in Excel. A lighter Power BI option with fewer visuals is the IVF Centers KPI Dashboard in Power BI.





























Reviews
There are no reviews yet.