

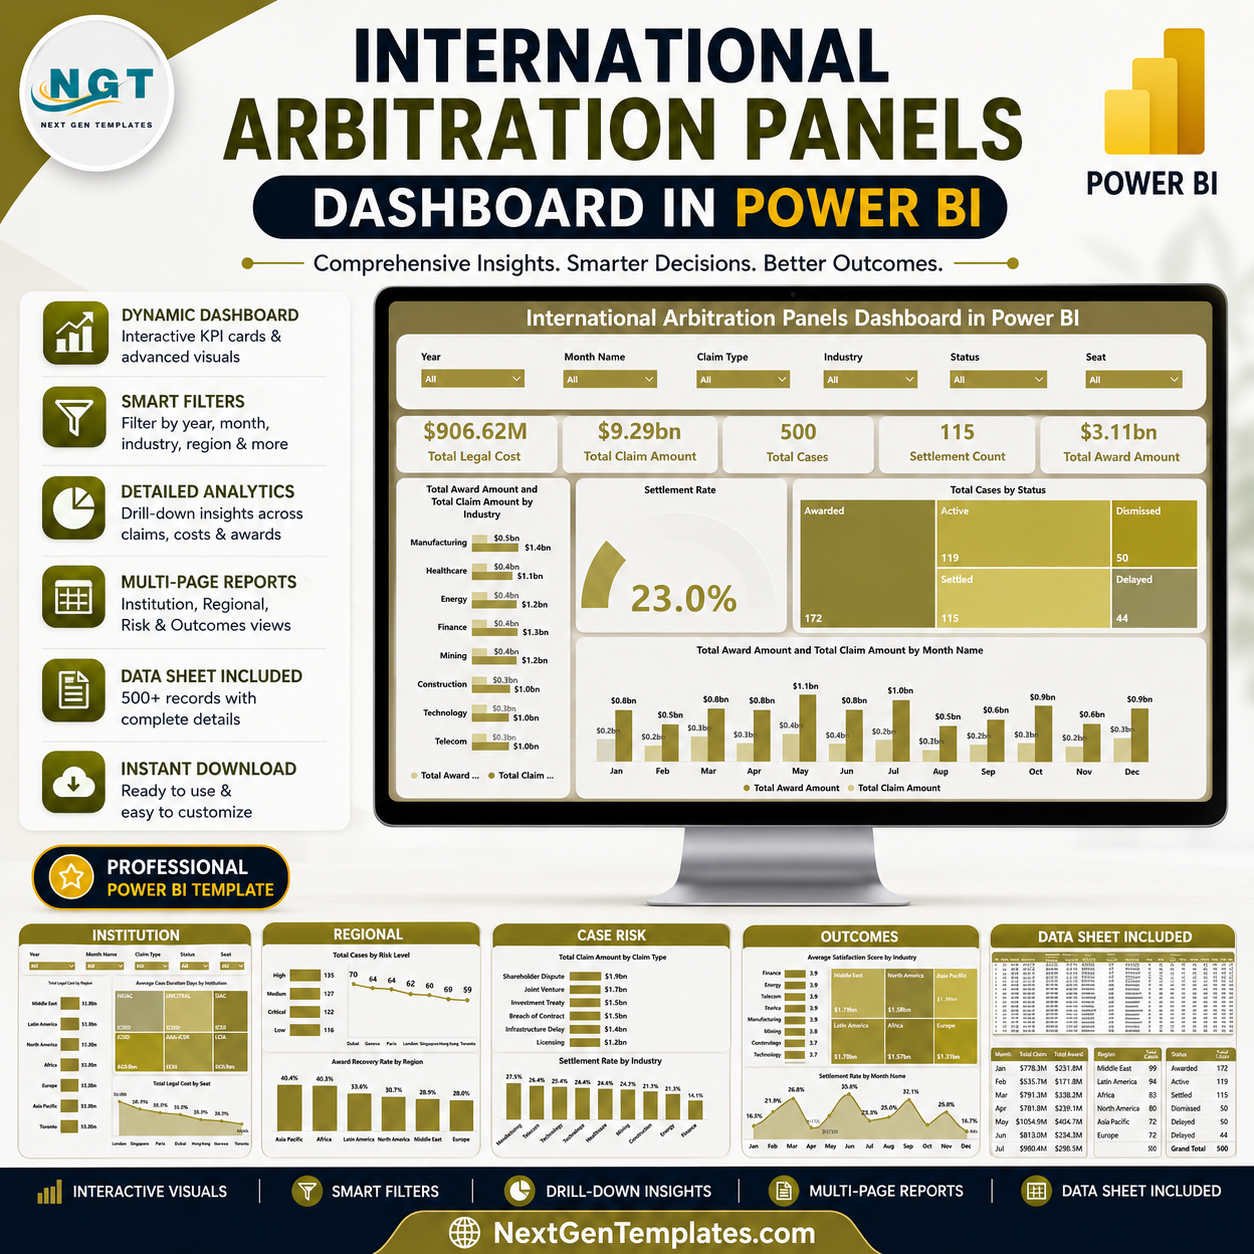

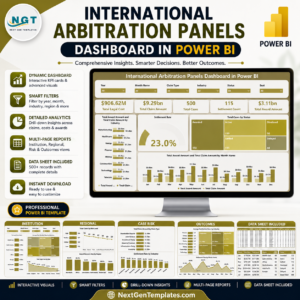
International Arbitration Panels Dashboard in Power BI gives arbitration teams, legal operations managers, case administrators, finance analysts, and law-firm partners a ready-to-use reporting file for claim amount, award amount, legal cost, case status, settlement rate, recovery, institution, region, seat, industry, risk level, and case duration. The template includes 5 Power BI report pages, 5 headline KPI cards, multiple slicers, and 13 focused chart views. It is built for teams that want clear arbitration analytics in Power BI without starting from a blank report or paying for a recurring legal reporting SaaS subscription.
Key Features of International Arbitration Panels Dashboard in Power BI
- 5 report pages: Overview Page, Institution, Regional, Case Risk, and Outcomes.
- 5 headline cards: Total Legal Cost, Total Claim Amount, Total Cases, Settlement Count, and Total Award Amount.
- Interactive slicers: Filter arbitration reporting pages quickly and review specific segments without rebuilding visuals.
- Claim and award analytics: Compare total claim amount and total award amount by industry and month.
- Legal cost tracking: Review legal cost by region and arbitration seat for budget and portfolio planning.
- Risk and outcome views: Analyze risk level, claim type, settlement rate, award recovery, and satisfaction score.
What’s Inside the International Arbitration Panels Dashboard in Power BI
1. Overview Page
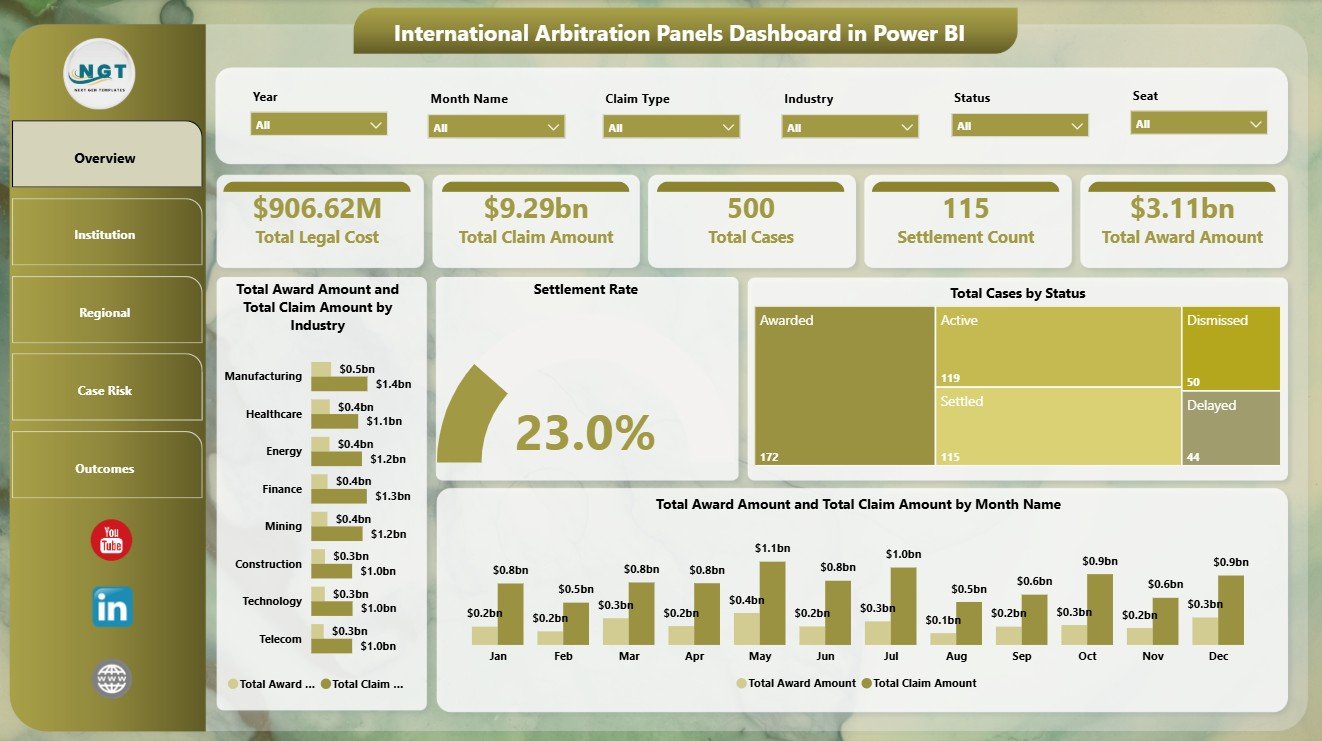
The Overview Page gives a high-level arbitration snapshot with cards for Total Legal Cost, Total Claim Amount, Total Cases, Settlement Count, and Total Award Amount. Multiple slicers help users filter the dashboard quickly and review the same visuals for a selected institution, region, status, month, risk level, or other available field.
Total Award Amount and Total Claim Amount by Industry: This chart compares claimed value and awarded value across industries. It helps users identify which industries carry the highest dispute exposure and where award outcomes are closest to claim value.
Settlement Rate by Overall Cases: This visual shows settlement performance against total case volume. It helps teams understand how often matters are resolved through settlement instead of continuing to award or other outcomes.
Total Cases by Status: This chart displays the distribution of cases by status. It helps users see the current portfolio mix across active, settled, awarded, pending, delayed, or closed matters.
Total Award Amount and Total Claim Amount by Month Name: This monthly chart compares claim value and award value over time. It helps reveal seasonal movement, spikes, and periods where award recovery changed materially.
International Arbitration Panels Dashboard in Power BI
2. Institution
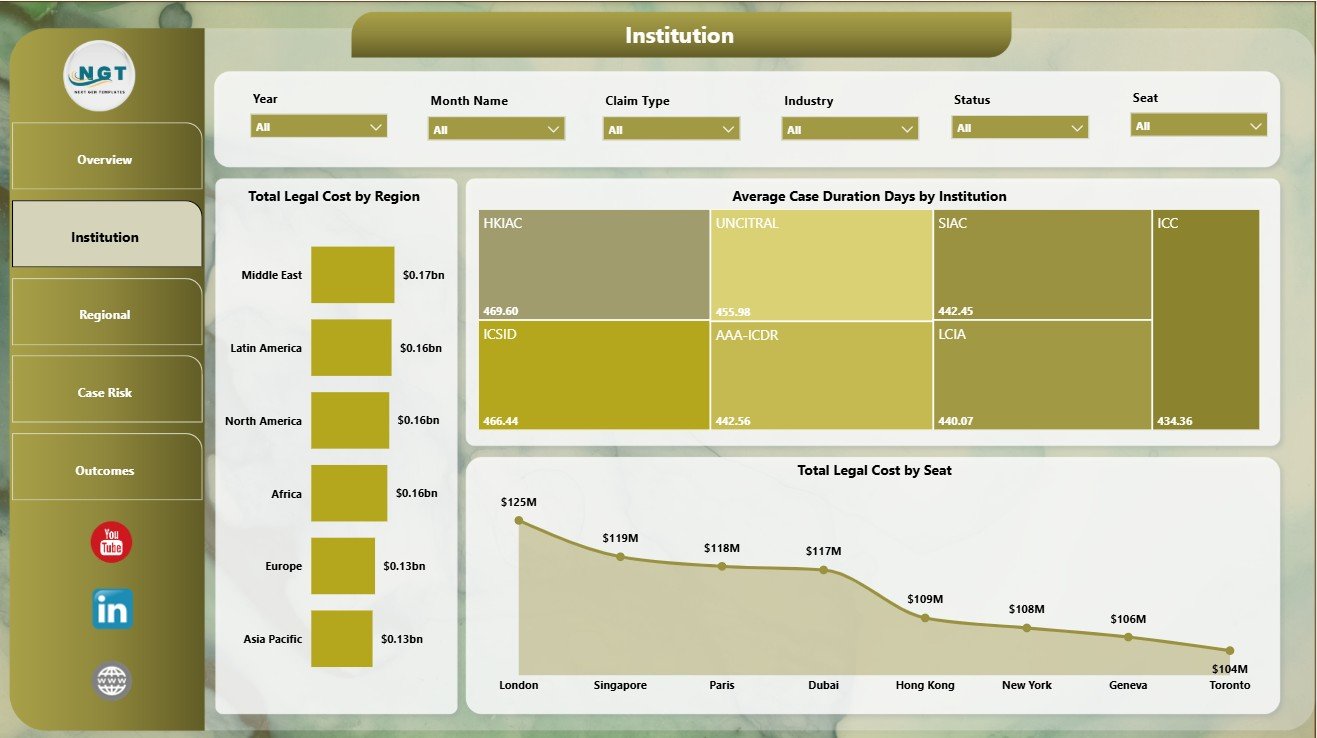
The Institution page focuses on institution-level performance, case duration, regional legal cost, and arbitration seat cost analysis.
Total Legal Cost by Region: This chart compares legal spend across regions. It helps legal and finance teams identify where arbitration matters are creating the highest cost pressure.
Average Case Duration Days by Institution: This visual compares average case duration by institution. It helps users spot institutions where matters tend to close faster or require longer administration.
Total Legal Cost by Seat: This chart ranks arbitration seats by total legal cost. It supports seat-level cost comparison and budget review for future matters.
Institution
3. Regional
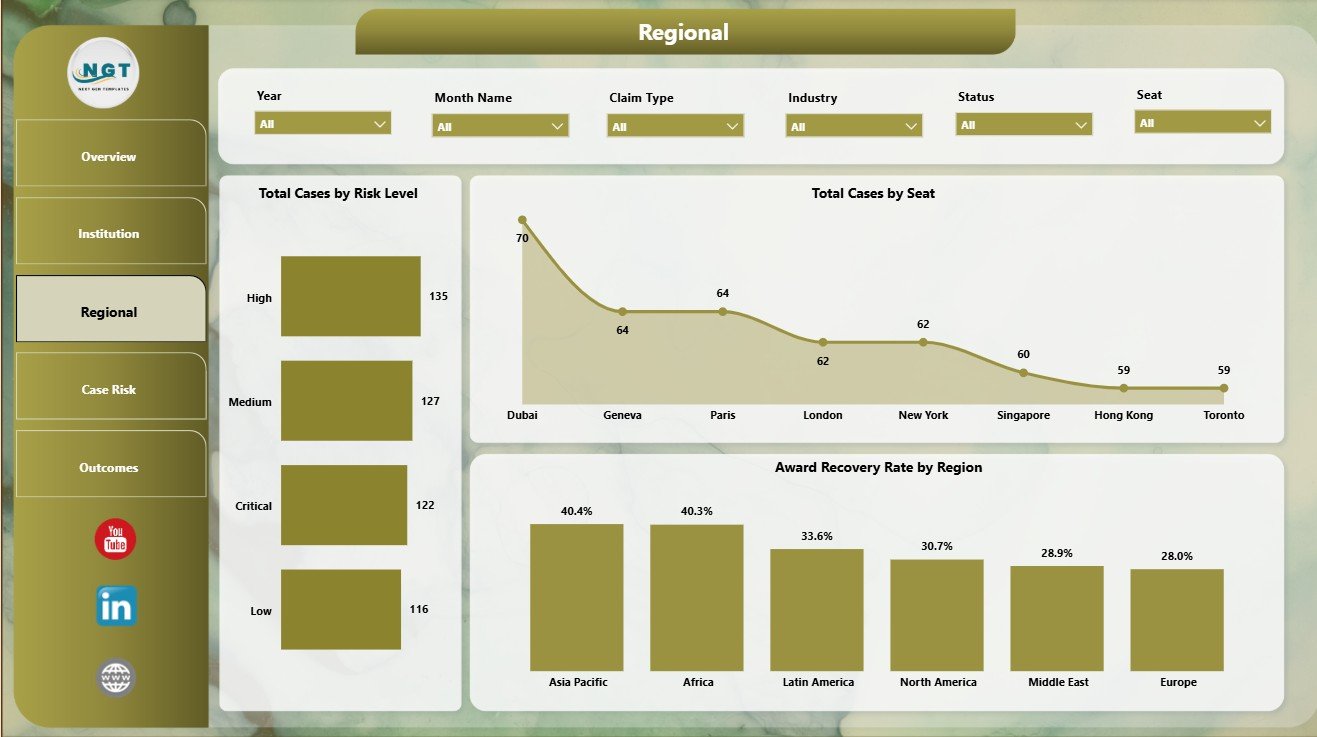
The Regional page gives a location-based view of risk, seat concentration, and award recovery performance.
Total Cases by Risk Level: This chart groups arbitration cases by risk band. It helps managers see whether high-risk matters are concentrated or increasing.
Total Cases by Seat: This visual compares case volume by arbitration seat. It helps identify which seats are most frequently used across the portfolio.
Award Recovery Rate by Region: This chart compares awarded value against claim value by region. It helps users understand where recovery performance is stronger or weaker.
Regional
4. Case Risk
The Case Risk page helps teams review claim exposure, settlement behavior, and duration by risk level.
Total Claim Amount by Claim Type: This chart shows financial exposure by dispute or claim category. It helps users identify which claim types carry the highest value.
Settlement Rate by Industry: This visual compares settlement performance across industries. It helps teams see where negotiated outcomes are more common.
Average Case Duration Days by Risk Level: This chart compares average duration across risk bands. It helps teams understand whether higher-risk matters are also creating longer timelines.
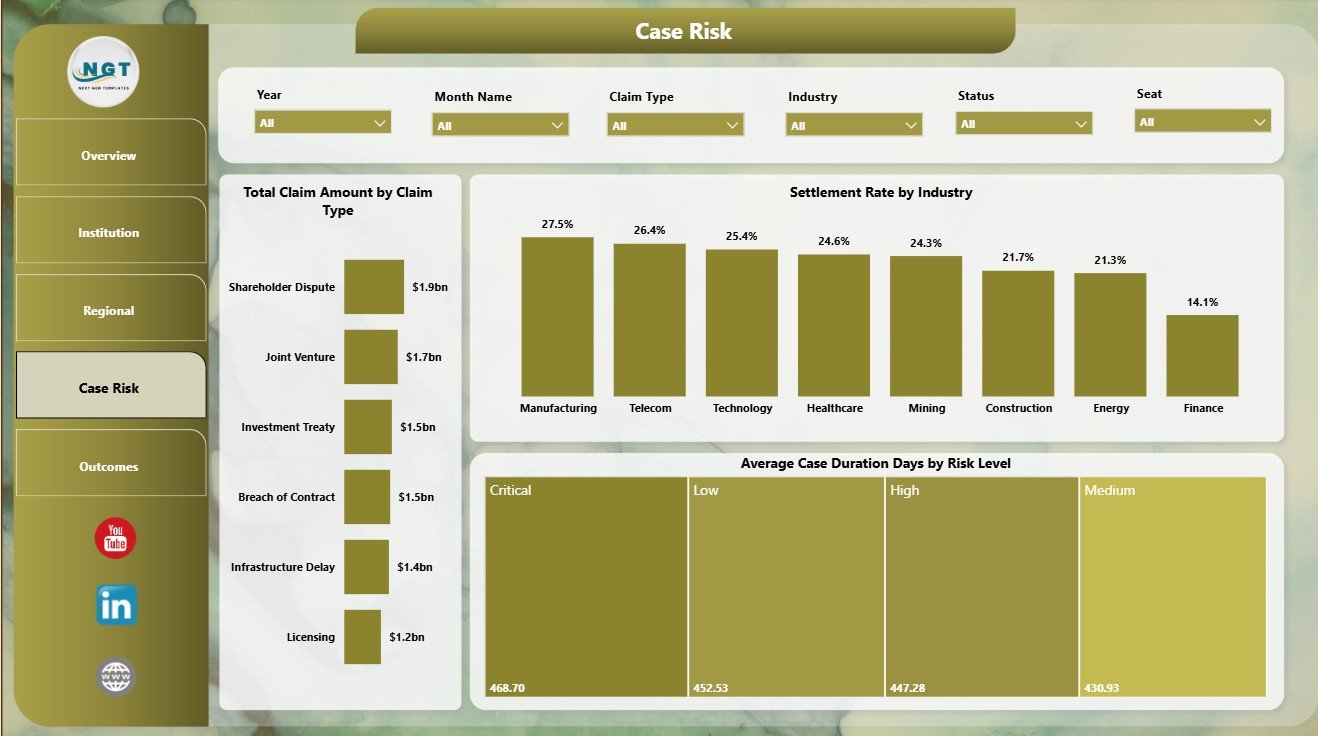
Case Risk
5. Outcomes
The Outcomes page connects satisfaction, claim value, region, and monthly settlement performance.
Average Satisfaction Score by Industry: This chart compares satisfaction results by industry. It helps users identify where case outcomes or service experience may require attention.
Total Claim Amount by Region: This visual shows claim value by region. It helps teams understand where the largest arbitration exposure is located.
Settlement Rate by Month Name: This monthly chart tracks settlement rate over time. It helps identify months where settlement activity increased, slowed, or changed from normal patterns.
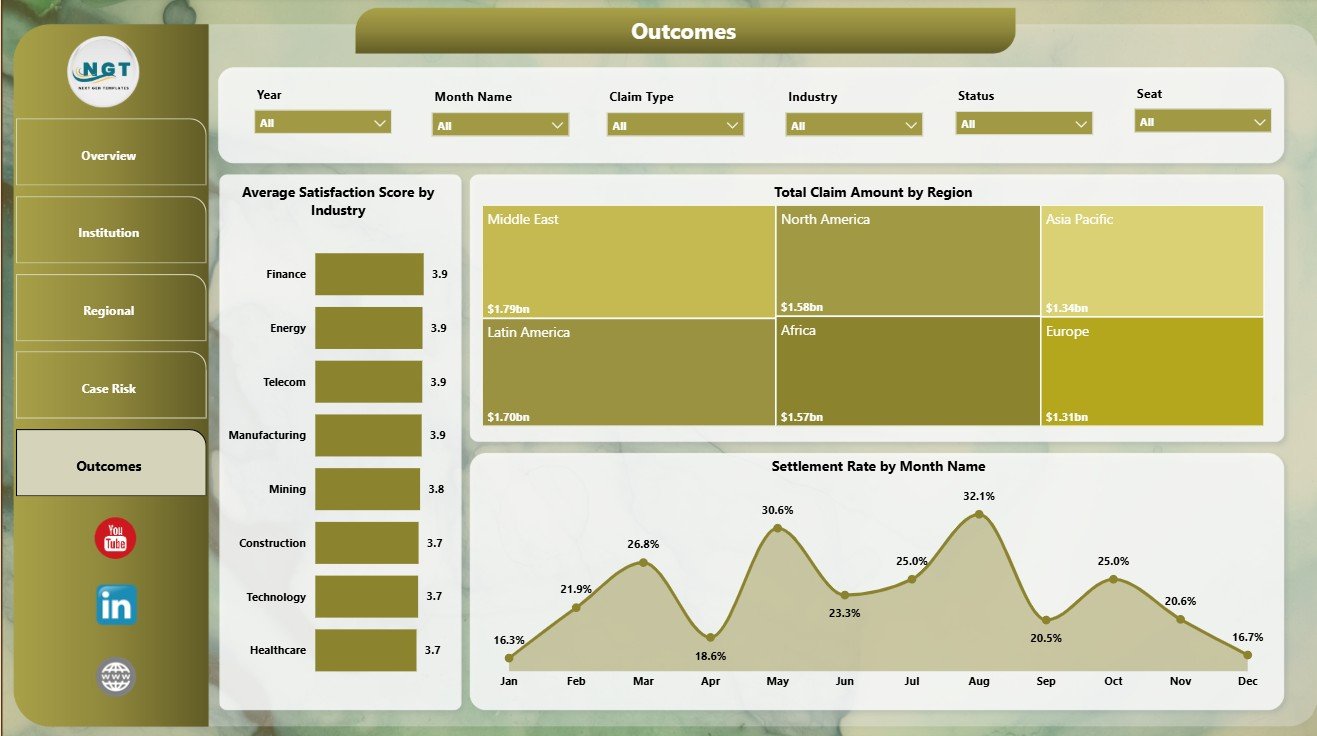
Outcomes
International Arbitration Panels Dashboard in Power BI vs. Tableau vs. Paid Legal SaaS – Where This Fits
| Feature | This Power BI Dashboard | Tableau Alternative | Paid Legal SaaS |
|---|---|---|---|
| Cost | $17.99 one-time | Template or custom dashboard build | Monthly or annual subscription |
| Platform | Microsoft Power BI Desktop | Tableau Desktop or Tableau Cloud | Vendor cloud platform |
| Setup time | Open PBIX and connect or replace sample data | Build or adapt dashboard views | Implementation and onboarding |
| Real-time team collaboration | Available through Power BI Service after publishing | Available through Tableau Cloud/Server | Usually included by plan |
| Customizable fields | Editable report pages, model, visuals, and measures | Editable workbook and data source | Depends on vendor controls |
| Year-1 cost at 5 users | $17.99 plus Power BI licensing if publishing is needed | Often higher licensing or development cost | Often hundreds or thousands |
| Arbitration analytics | Built-in pages for cost, claims, awards, institution, region, risk, recovery, settlement, and outcomes | Requires setup or adaptation | May require configuration or premium reporting |
Who This Template Is For – and Who It’s Not For
This template is for arbitration law firms, legal operations teams, case administrators, dispute resolution teams, finance analysts, consultants, and corporate legal departments that track arbitration data and want a Power BI reporting layer.
It is not a case management system, e-filing system, document repository, conflict-checking tool, calendaring system, billing platform, or client portal. It works best when the team already has structured arbitration case data and needs a cleaner analytics report.
How to Use the International Arbitration Panels Dashboard in Power BI
- Download and unzip the product file.
- Open the PBIX file in Microsoft Power BI Desktop.
- Review the sample data model and report pages.
- Replace or connect your arbitration case data using the same field structure.
- Refresh the report and validate cards, slicers, and charts.
- Use slicers to filter by available arbitration fields such as institution, region, seat, status, risk level, industry, and month.
- Publish to Power BI Service if your team needs browser-based sharing.
Real-World Use Cases
Anika, arbitration partner: reviews total claims, awards, settlements, and status mix before a monthly dispute portfolio meeting.
Marcus, legal operations manager: uses institution, region, and risk pages to identify long-duration matters, high-cost seats, and risk concentration.
Priya, finance analyst: compares legal cost, claim amount, award amount, and recovery rate before preparing arbitration financial notes.
Frequently Asked Questions
What does this Power BI arbitration dashboard track?
It tracks legal cost, claim amount, award amount, total cases, settlement count, case status, institution, region, seat, industry, risk level, claim type, satisfaction score, case duration, recovery rate, and settlement rate.
Do I need Power BI Desktop?
Yes. Open and edit the PBIX file in Power BI Desktop. Power BI Desktop is available from Microsoft.
Can I replace the sample data?
Yes. Replace or connect your own structured arbitration records, then refresh the report and verify the visuals.
Can I customize the report?
Yes. You can edit report pages, visuals, filters, measures, colors, labels, and the data model if you are comfortable in Power BI.
Is this a legal case management system?
No. This is a reporting dashboard template, not a workflow system for filings, documents, reminders, billing, or client communication.
Is this a subscription?
No. This is a one-time downloadable Power BI template from NextGenTemplates.
About the Author
Built by PK – Microsoft Certified Professional with 15+ years of Excel, Google Sheets, and Power BI experience. Founder of NextGenTemplates, reaching 300K+ subscribers across YouTube channels. Every template is hand-built and tested before release.
Explore Related Templates
You may also like International Arbitration Panels Dashboard in Excel, Intellectual Property Law Firms Dashboard in Excel, and Employment Law Services Dashboard in Excel. Browse more Power BI Dashboard templates and Power BI templates.
Download the International Arbitration Panels Dashboard in Power BI today and start reviewing arbitration claims, awards, costs, institutions, regions, risks, outcomes, recovery, and settlement performance in one editable Power BI report.
Last updated: June 26, 2026.
Watch the step-by-step video tutorial:
Compatibility and Requirements
- Works in Power BI Desktop, which is free. Open the PBIX file there to edit pages, visuals and measures. Microsoft explains the download in Get Power BI Desktop.
- Publishing to Power BI Service is only needed if your team wants to view the report in a browser.
More Questions About This Template
Which report pages are included?
Five pages: Overview Page, Institution, Regional, Case Risk and Outcomes.
Is there an Excel version of this dashboard?
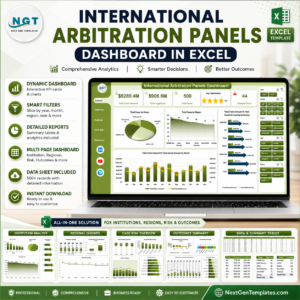
Yes. See the International Arbitration Panels Dashboard in Excel.
Is there a similar Power BI dashboard for arbitration and mediation?
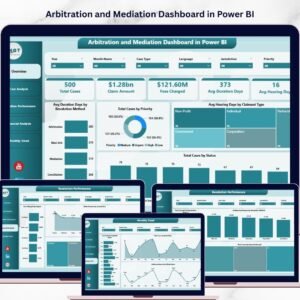
Yes. See the Arbitration and Mediation Dashboard in Power BI.
Which headline numbers appear on the Overview Page?
Total Legal Cost, Total Claim Amount, Total Cases, Settlement Count and Total Award Amount. Slicers let you filter the page to a segment.
Related Arbitration and Legal Templates
- International Arbitration Panels Dashboard in Excel: the same arbitration reporting in Excel
- Arbitration and Mediation Dashboard in Power BI: a Power BI dashboard for arbitration and mediation cases
- Arbitration and Mediation KPI Dashboard in Power BI: a KPI view of the same topic
- Intellectual Property Law Firms Dashboard in Excel: a law firm dashboard for IP work
- Employment Law Services Dashboard in Excel: a dashboard for employment law services
Browse all Power BI dashboards.



















Reviews
There are no reviews yet.