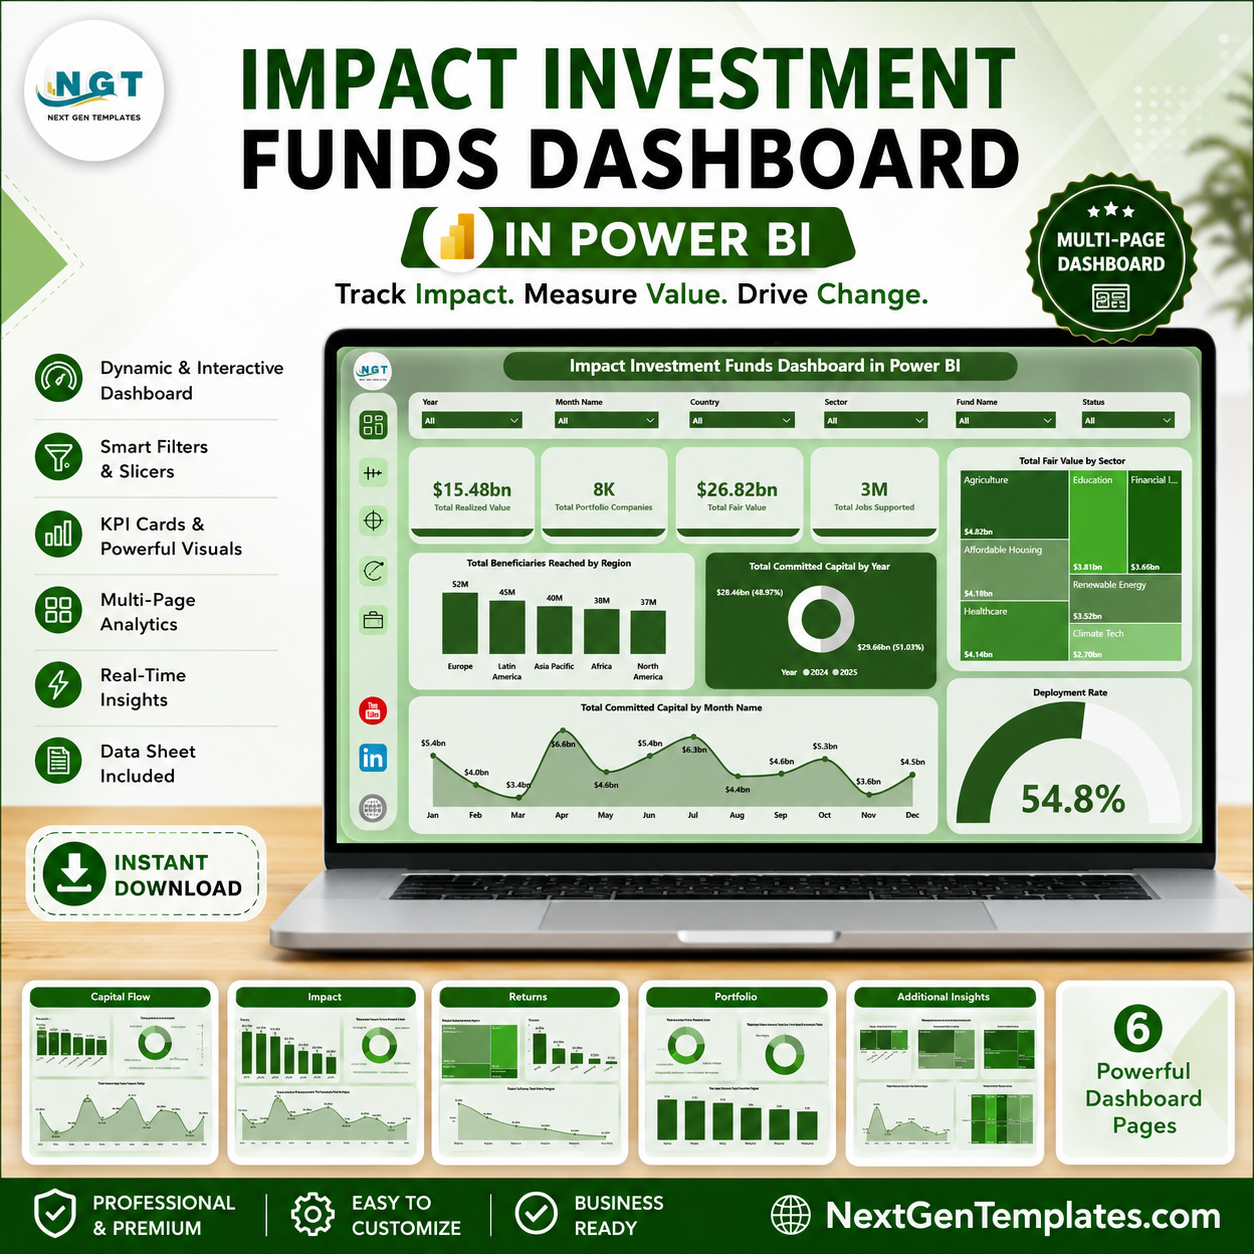
Impact Investment Funds Dashboard in Power BI helps fund managers, ESG analysts, sustainable finance teams, investor reporting leads, and portfolio operations teams monitor fund performance and social impact in one interactive PBIX report. For $17.99 one-time, you get 5 Power BI pages covering capital flow, impact outcomes, returns, and portfolio mix with KPI cards, charts, and slicers. Built by a Microsoft Certified Professional with 15+ years of Excel and Power BI experience, this template reduces blank-page dashboard work and gives your team a practical reporting layer with a simple risk reversal: download it, review the structure, and customize it for your own fund data.
Key Features of Impact Investment Funds Dashboard in Power BI
- 5 Power BI pages for Overview, Capital Flow, Impact, Returns, and Portfolio analysis.
- 4 executive KPI cards for Total Realized Value, Total Portfolio Companies, Total Fair Value, and Total Jobs Supported.
- Capital flow analysis by investor type, impact theme, fund manager, and month.
- Impact reporting views for realized value, jobs supported, sector coverage, and fund manager output.
- Returns page for fair value by risk rating, status, investment stage, and portfolio companies by manager.
- Portfolio page for jobs supported, portfolio companies, deployment rate, and funds count.
- Interactive slicers to filter the report quickly during meetings and review calls.
What’s Inside the Impact Investment Funds Dashboard in Power BI
1. Overview Page
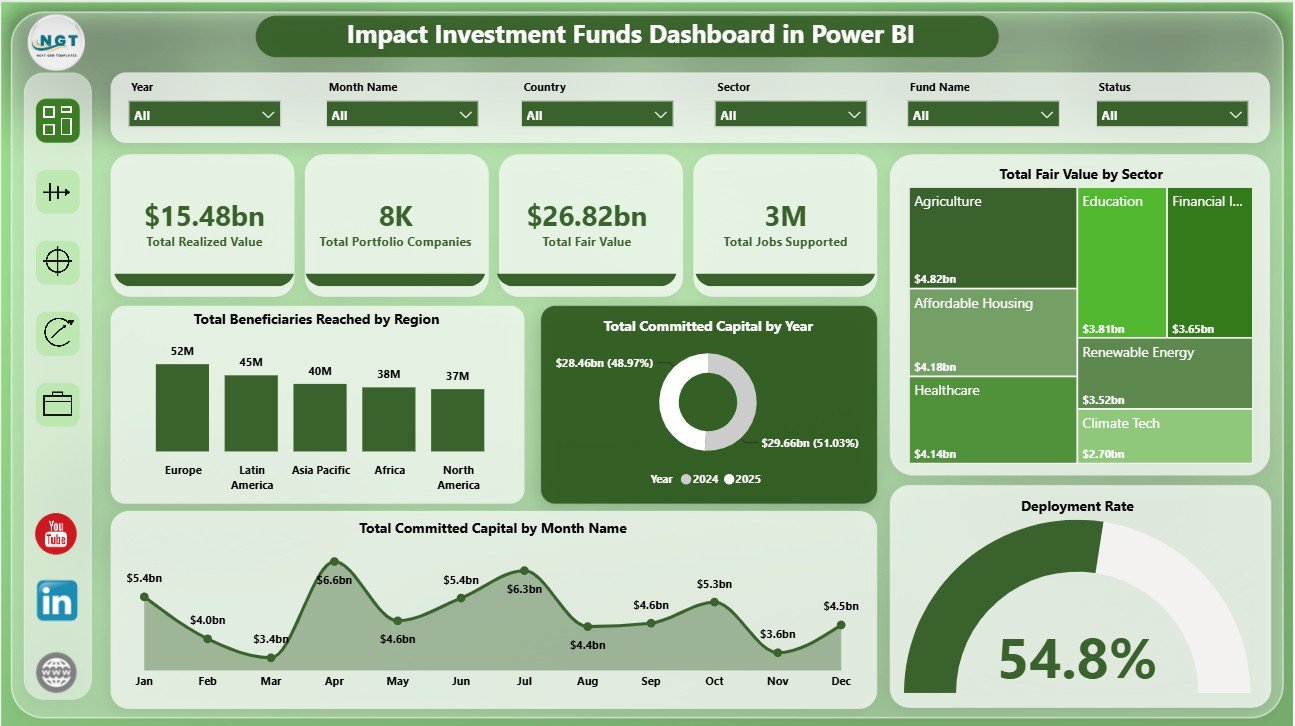
The Overview page gives leadership a fast summary of fund value and impact delivery. KPI cards show Total Realized Value, Total Portfolio Companies, Total Fair Value, and Total Jobs Supported so users can review financial value, portfolio breadth, and employment impact at a glance.
Total Beneficiaries Reached by Region: Compares beneficiary reach across regions so teams can see where capital is producing the largest social footprint. It is useful for investor reporting, board updates, and regional allocation reviews.
Total Committed Capital by Year: Shows annual commitment trends and helps users understand whether fundraising or allocation activity is increasing over time. This chart is helpful for long-term capital planning.
Total Fair Value by Sector: Breaks down current fair value by sector so users can spot concentration risk and sector-level value contribution. It supports portfolio balancing and sector comparison.
Total Committed Capital by Month Name: Shows monthly capital commitment patterns and highlights seasonality or timing clusters. Use it to explain when fund commitments are strongest.
Deployment Rate by Overall Portfolio: Tracks how effectively committed capital has moved into portfolio activity. This helps investment teams review execution speed and capital utilization.
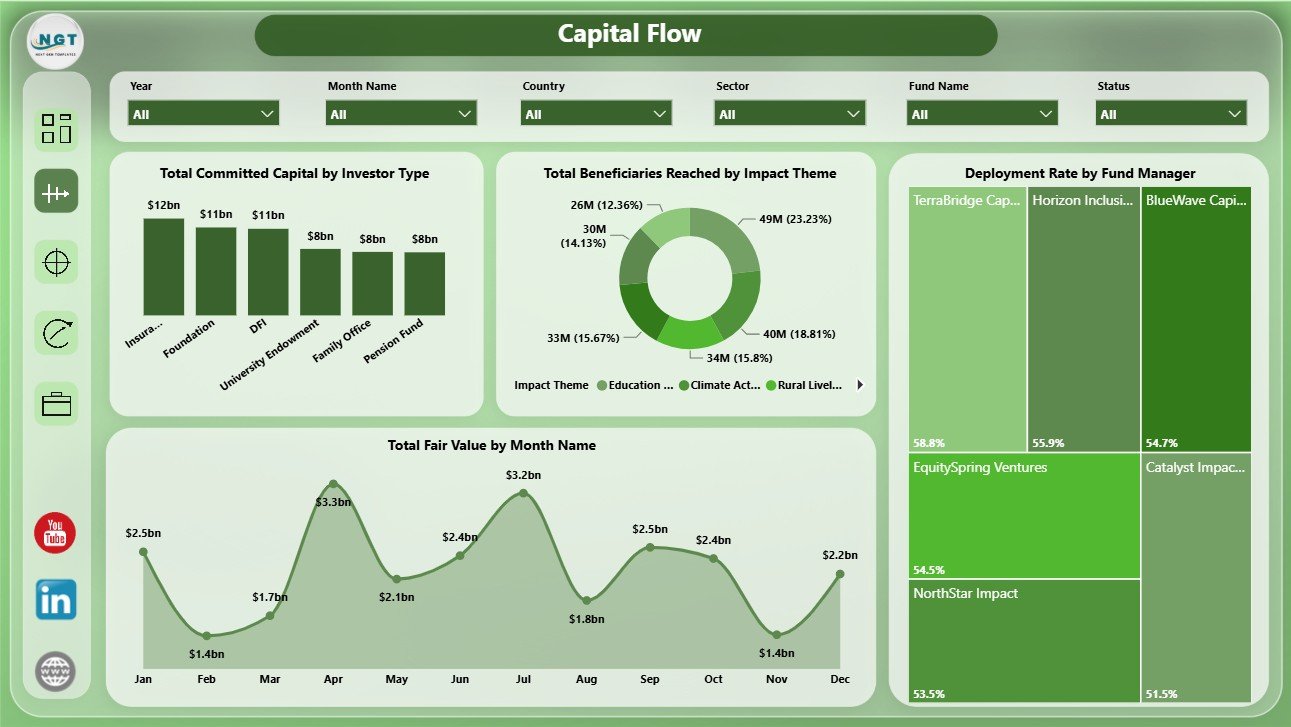
2. Capital Flow
The Capital Flow page focuses on how committed capital, fair value, deployment, and beneficiary reach move through the portfolio. Total Committed Capital by Investor Type shows which investor groups contribute the most capital. Total Beneficiaries Reached by Impact Theme connects funding activity with impact priorities. Deployment Rate by Fund Manager compares manager execution. Total Fair Value by Month Name shows month-wise value movement.
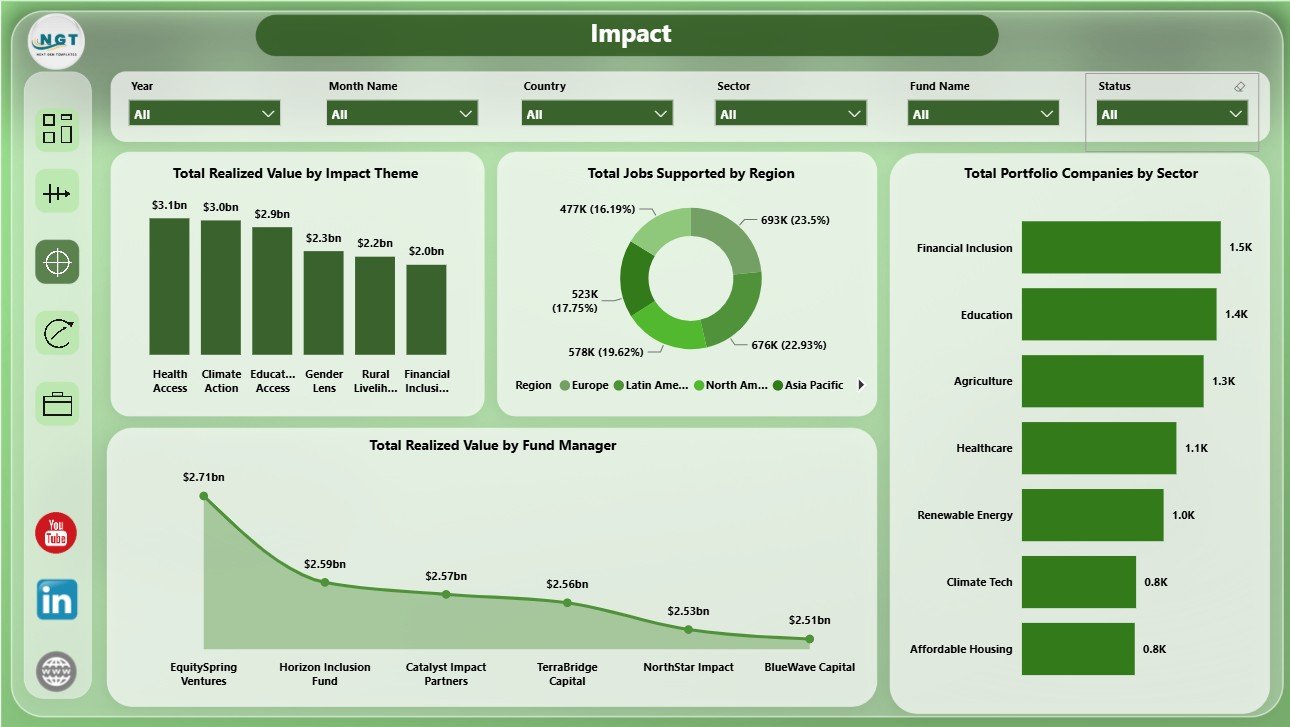
3. Impact
The Impact page connects financial activity to social outcomes. Total Realized Value by Impact Theme shows which themes are producing realized value. Total Jobs Supported by Region compares employment impact geographically. Total Portfolio Companies by Sector shows sector coverage. Total Realized Value by Fund Manager compares manager-level realized value contribution.
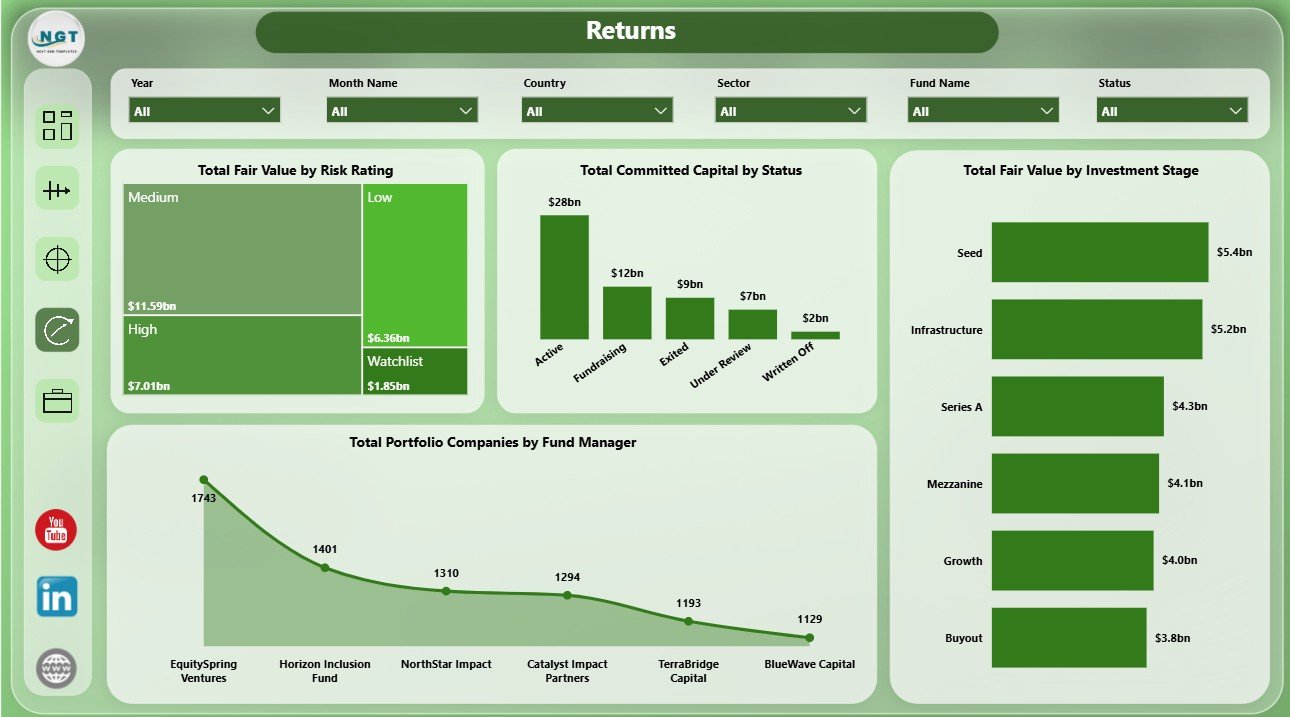
4. Returns
The Returns page helps users review risk, status, stage, and manager-level portfolio distribution. Total Fair Value by Risk Rating highlights value exposure by risk profile. Total Committed Capital by Status shows where capital sits by status. Total Fair Value by Investment Stage compares stage-level value. Total Portfolio Companies by Fund Manager shows manager coverage.
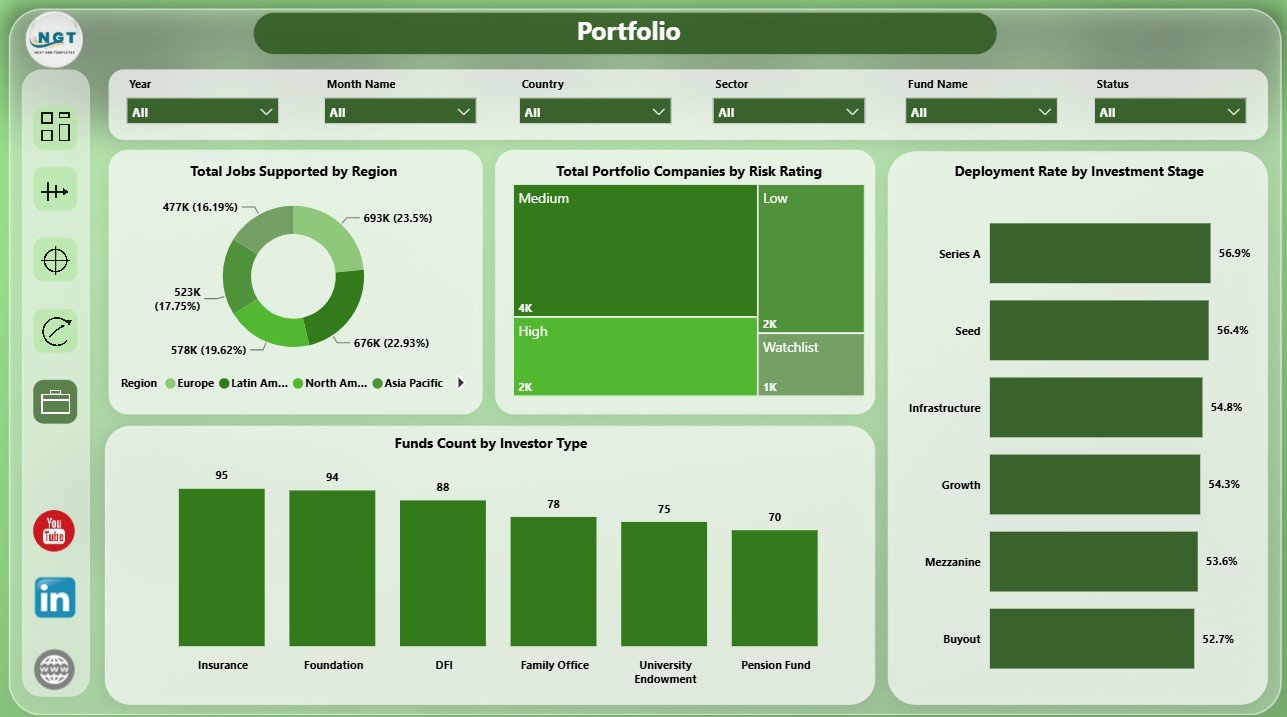
5. Portfolio
The Portfolio page gives a practical view of portfolio scale and capital deployment. Total Jobs Supported by Region shows employment impact by geography. Total Portfolio Companies by Risk Rating tracks risk mix. Deployment Rate by Investment Stage compares stage-level capital use. Funds Count by Investor Type shows the investor-type mix across funds.
Impact Investment Funds Dashboard in Power BI vs. Tableau vs. Paid Fund SaaS – Where This Fits
| Feature | This Power BI Dashboard | Tableau or Qlik Alternative | Paid Fund SaaS |
|---|---|---|---|
| Cost | $17.99 one-time template | Requires license and dashboard build time | Monthly or annual subscription |
| Platform | Power BI Desktop and Power BI Service | Tableau or Qlik environment | Vendor cloud platform |
| Setup time | Open PBIX and replace sample data/source | Build model and visuals manually | Configuration and onboarding |
| Customizable fields | Edit model, measures, visuals, pages, and slicers | Editable with platform skills | Limited by vendor settings |
| Impact metrics | Beneficiaries, jobs, themes, regions, sectors, fair value, and realized value | Must be designed manually | Depends on product module |
| Year-1 cost at 5 users | Template cost plus Power BI licensing if sharing online | License cost plus analyst time | Often hundreds or thousands |
Who This Template Is For – and Who It’s Not For
This template is for impact investment funds, ESG investment firms, fund managers, development finance institutions, sustainable finance analysts, portfolio operations teams, and consultants who need Power BI reporting for committed capital, fair value, realized value, deployment rate, jobs supported, beneficiaries reached, impact themes, sectors, regions, risk ratings, statuses, and investment stages. It is not a fund accounting system, investor portal, compliance filing platform, automated verification tool, or live data warehouse.
How to Use the Impact Investment Funds Dashboard in Power BI
- Download and unzip the file.
- Open the PBIX file in Power BI Desktop.
- Review the sample data structure and replace it with your own source.
- Refresh the report and check all pages.
- Use slicers to filter by the available dimensions.
- Publish to Power BI Service if your team wants browser-based sharing.
Real-World Use Cases
Aisha, impact fund manager: reviews realized value, fair value, deployment rate, and portfolio company count before investment committee meetings.
Daniel, impact measurement analyst: uses beneficiary, jobs, region, and impact theme views to prepare investor impact summaries.
Priya, portfolio operations lead: compares fund manager, risk rating, investment stage, and investor type patterns before quarterly portfolio reviews.
Frequently Asked Questions
What does this Power BI dashboard track?
It tracks realized value, fair value, portfolio companies, jobs supported, beneficiaries reached, committed capital, investor type, impact theme, fund manager, sector, risk rating, investment stage, status, region, and month.
Do I need Power BI Desktop?
Yes. Open the PBIX file in Power BI Desktop, which is free from Microsoft, then connect or replace the sample data as needed.
Can I customize the dashboard?
Yes. You can edit pages, visuals, slicers, measures, data model fields, colors, and source connections in Power BI Desktop.
Is this a subscription?
No. This is a one-time downloadable Power BI template from NextGenTemplates.
Can I use it for ESG reporting?
Yes. It supports impact and ESG-style review when your source data includes the required investment, value, region, sector, and impact fields.
Does it replace fund administration software?
No. It is a Power BI reporting template for prepared data, not a full administration, accounting, compliance, or investor portal system.
About the Author
Built by PK – Microsoft Certified Professional with 15+ years of Excel, Google Sheets, and Power BI experience. Founder of NextGenTemplates, reaching 300K+ subscribers across YouTube channels. Every template is hand-built and tested before release.
Explore Related Templates
You may also like Impact Investment Funds Dashboard in Excel, Startup Burn Rate Dashboard in Power BI, and Geothermal Energy Dashboard in Power BI. Browse more Power BI Dashboard templates.
Download the Impact Investment Funds Dashboard in Power BI and turn impact fund data into a clear Power BI report for capital, returns, portfolio, and impact review.
Last updated: June 22, 2026.
Watch the step-by-step video tutorial:


Reviews
There are no reviews yet.