
Hydropower Projects Dashboard in Power BI gives energy teams, project managers, developers, finance reviewers, and operations leaders a ready-to-use PBIX dashboard for monitoring revenue, planned budget, actual generation, actual cost, budget variance, construction phase, project status, country, river basin, plant type, funding source, turbine type, and risk level. Hydropower projects often carry large budgets, long delivery cycles, and strict generation expectations, so delayed reporting can hide cost pressure and operational gaps until the monthly review is already over.
This Power BI dashboard helps you review multiple report pages with KPI cards, interactive slicers, and visual analysis in one place. Replace the sample source with your project data, refresh the report, and use the built-in pages to compare cost, revenue, risk, location, and operations performance. It is a one-time downloadable template from NextGenTemplates, so there is no recurring dashboard subscription.
Key Features of Hydropower Projects Dashboard in Power BI
- 5 Power BI report pages covering Overview, Project Trend, Location, Risk, and Operations analysis.
- Executive KPI cards for Total Revenue, Total Planned Budget, Total Actual Generation, Total Actual Cost, and Net Budget Variance.
- Interactive slicers for fast filtering across project, location, phase, status, risk, plant, and operating dimensions.
- Revenue and cost visuals to compare monthly performance, country-level cost, developer contribution, and funding-source variance.
- Hydropower operations views for turbine type, plant type, generation attainment, and availability rate.
- Editable PBIX structure so analysts can adjust visuals, fields, measures, colors, and report pages in Power BI Desktop.
What’s Inside the Hydropower Projects Dashboard in Power BI
1. Overview Page
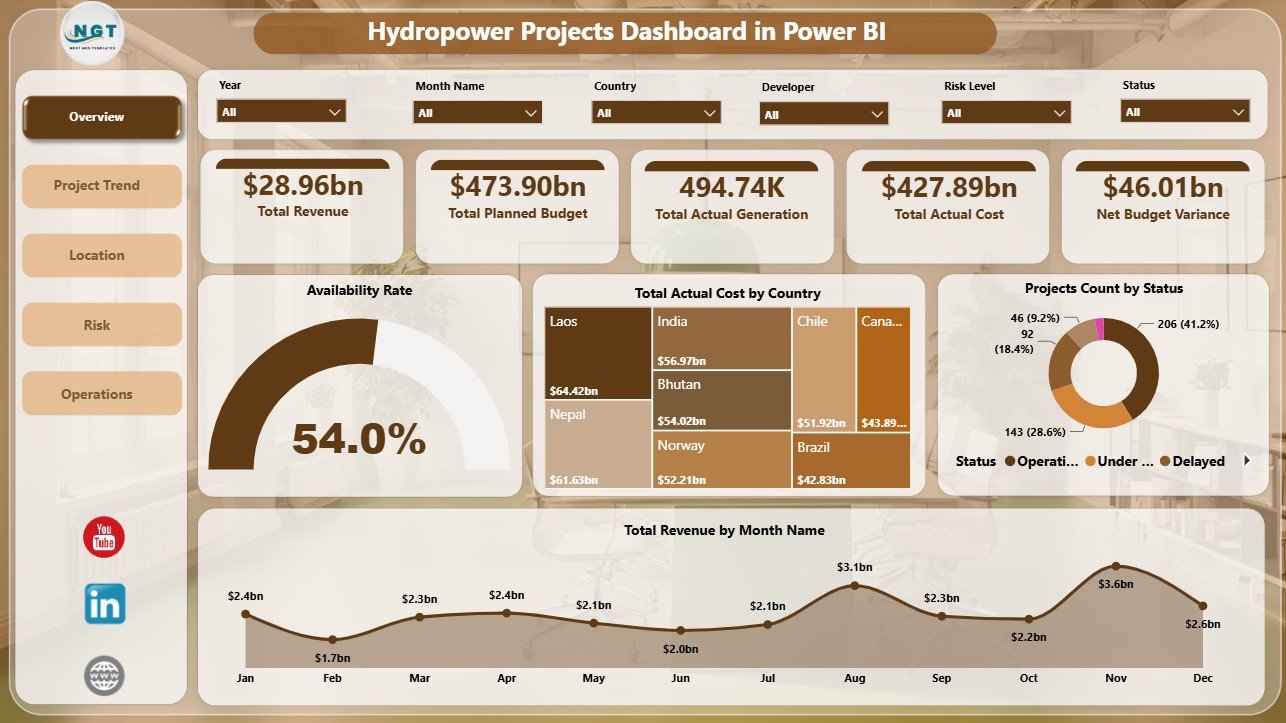
The Overview page gives decision-makers a high-level portfolio snapshot. KPI cards show Total Revenue, Total Planned Budget, Total Actual Generation, Total Actual Cost, and Net Budget Variance so leaders can quickly compare financial scale, production output, and budget position.
Availability Rate: This visual helps users check how reliably projects or plants are performing. It is useful for connecting project health with operational readiness.
Total Actual Cost by Country: This chart compares actual cost across countries. It helps finance and project teams identify markets with higher execution cost.
Projects Count by Status: This visual shows how many projects sit in each status group. It helps managers understand whether the portfolio is moving, delayed, completed, or needing attention.
Total Revenue by Month Name: This chart shows monthly revenue movement. It helps teams identify stronger months, weaker periods, and reporting trends that need explanation.
2. Project Trend
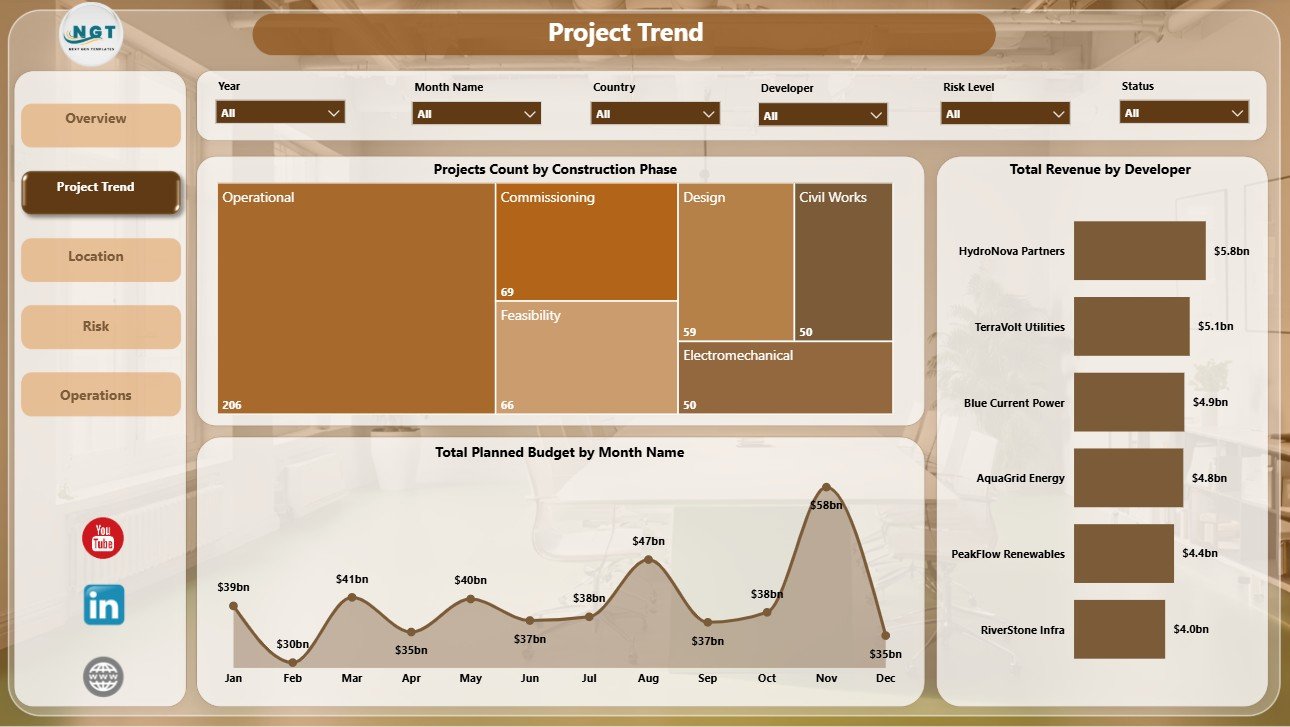
The Project Trend page focuses on project pipeline and time-based performance. Projects Count by Construction Phase shows where projects sit across feasibility, construction, commissioning, operations, or other phase groups.
Total Planned Budget by Month Name shows how planned spending moves across months, while Total Revenue by Developer compares developer-level contribution and highlights the partners or developers driving the most revenue.
3. Location
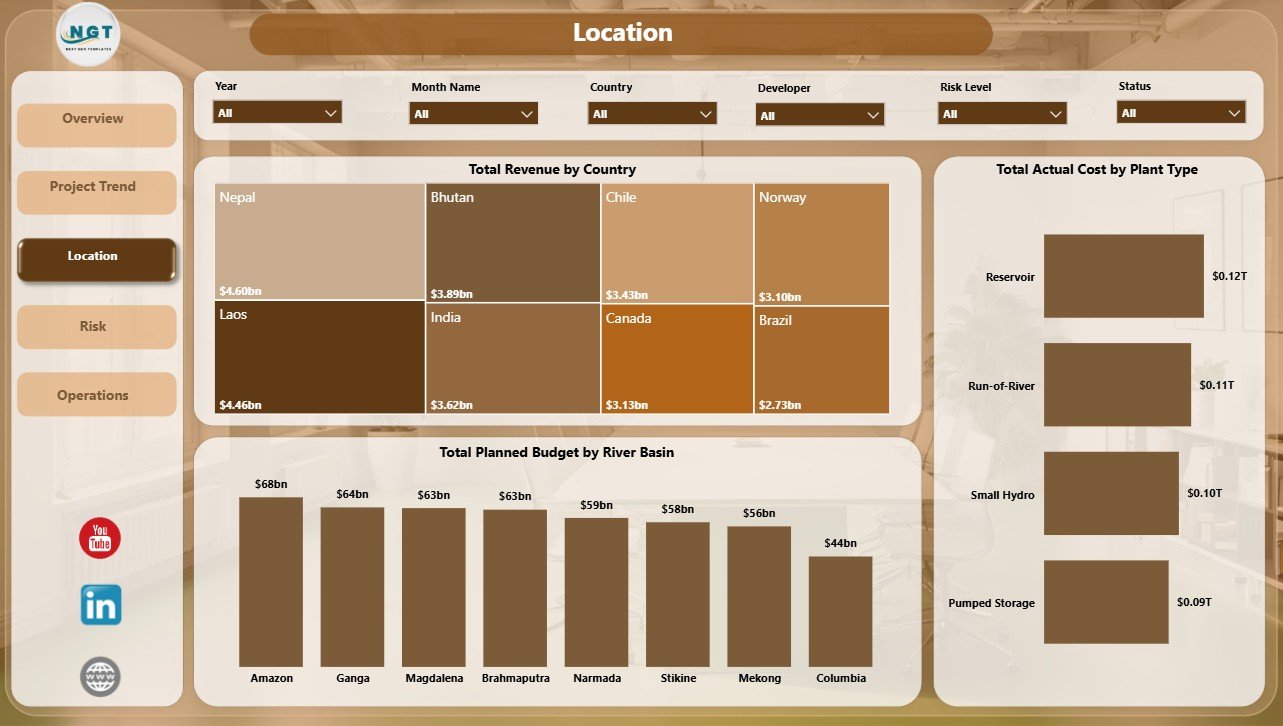
The Location page helps users compare projects by country, river basin, and plant type. Total Revenue by Country identifies markets producing the most revenue and supports country-level business reviews.
Total Planned Budget by River Basin helps teams review budget allocation by basin, and Total Actual Cost by Plant Type compares cost patterns across plant categories for planning and cost-control discussions.
4. Risk
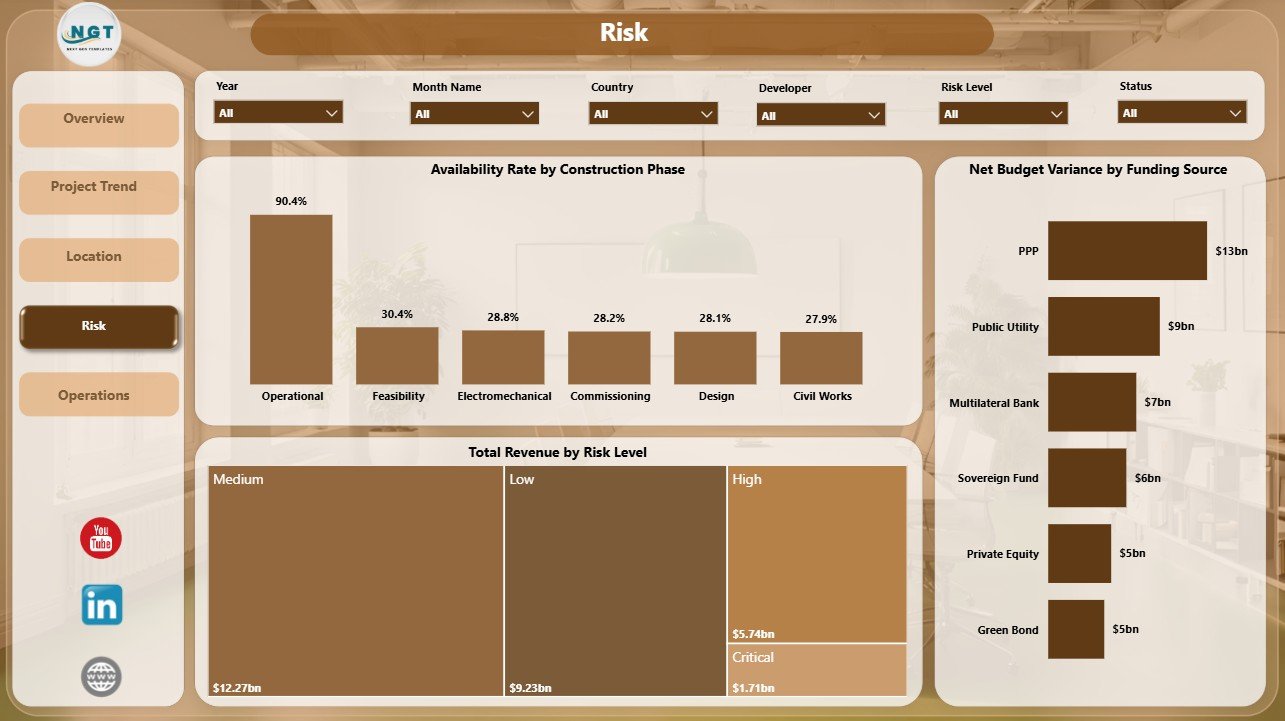
The Risk page connects availability, revenue, budget variance, construction phase, risk level, and funding source. Availability Rate by Construction Phase helps teams see how project stage relates to operational readiness or availability performance.
Total Revenue by Risk Level shows how much revenue is tied to each risk category, while Net Budget Variance by Funding Source helps finance teams see which funding sources may need closer cost governance.
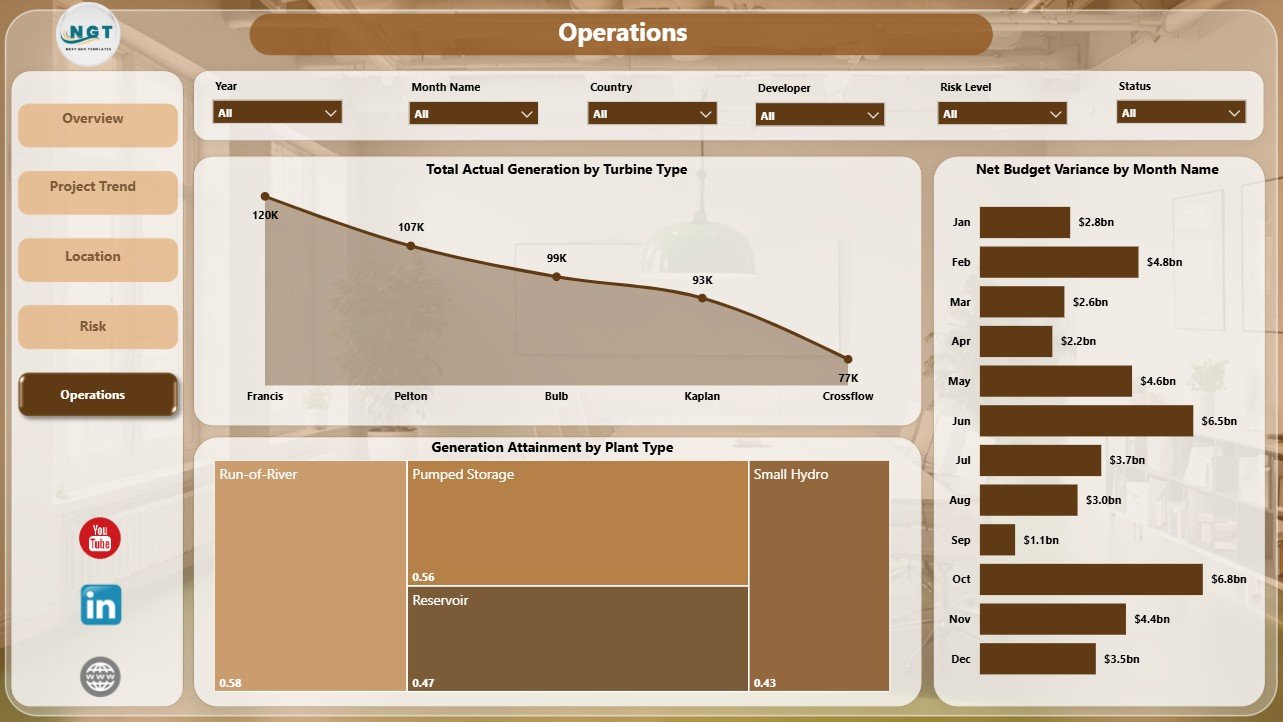
5. Operations
The Operations page is designed for plant performance and generation review. Total Actual Generation by Turbine Type shows which turbine groups contribute the most generation output.
Generation Attainment by Plant Type compares actual generation against expected performance by plant category, and Net Budget Variance by Month Name shows whether budget variance is improving or worsening over time.
Hydropower Projects Dashboard in Power BI vs. Tableau vs. Paid Project SaaS – Where This Fits
| Feature | This Power BI dashboard | Tableau alternative | Paid project SaaS |
|---|---|---|---|
| Cost | $17.99 one-time template | Requires Tableau setup and licensing | Monthly or annual subscription |
| Platform | Power BI Desktop and Power BI Service | Tableau Desktop or Cloud | Vendor cloud system |
| Setup time | Replace source data and refresh | Rebuild or adapt workbook | Configuration and onboarding |
| Real-time team collaboration | Available through Power BI Service when configured | Available through Tableau Cloud | Usually included by plan |
| Mobile access | Available after publishing to Power BI Service | Available after publishing | Usually included |
| Customizable fields | Editable PBIX model and visuals | Customizable by Tableau users | Often limited by vendor schema |
| Hydropower project analysis | Built into five report pages | Custom dashboard required | Depends on module and setup |
| Year-1 cost at 5 users | $17.99 plus Power BI licensing if needed | Higher BI licensing cost | Often hundreds or thousands |
Who This Template Is For – and Who It’s Not For
This template is for hydropower project managers, renewable energy analysts, EPC teams, developers, finance controllers, operations managers, asset performance analysts, investment teams, and consultants who need a Power BI reporting layer for hydropower project performance.
It is not a live SCADA system, engineering design tool, ERP system, project document repository, or automatic regulatory filing platform. It works best when you already have structured source data and want a clean Power BI report for recurring analysis.
How to Use the Hydropower Projects Dashboard in Power BI
- Download and unzip the product file.
- Open the PBIX file in Power BI Desktop.
- Replace the sample source data with your own hydropower project data.
- Refresh the report model.
- Use slicers to filter Overview, Project Trend, Location, Risk, and Operations pages.
- Publish to Power BI Service if your team wants browser or mobile viewing.
Real-World Use Cases
Arjun, Hydropower Project Manager: reviews budget variance, status, phase, and generation before monthly steering committee meetings.
Meera, Renewable Energy Analyst: compares revenue by country, river basin budget, turbine generation, and plant-type attainment for performance commentary.
Daniel, Infrastructure Finance Lead: monitors planned budget, actual cost, net budget variance, and funding-source exposure before project finance reviews.
Frequently Asked Questions
What does this hydropower Power BI dashboard track?
It tracks revenue, planned budget, actual generation, actual cost, net budget variance, project status, construction phase, country, river basin, plant type, turbine type, risk level, funding source, availability rate, and generation attainment.
Do I need Power BI Desktop?
Yes. The PBIX file opens in Power BI Desktop, which is free from Microsoft. You can also publish the report to Power BI Service if your organization uses it.
Can I replace the sample data?
Yes. Replace the sample source with your project records, refresh the model, and the report visuals will update.
Can I customize the report?
Yes. You can edit visuals, measures, fields, colors, slicers, report pages, and model logic in Power BI Desktop.
Is this a subscription?
No. It is a one-time downloadable Power BI dashboard template from NextGenTemplates.
About the Author
Built by PK – Microsoft Certified Professional with 15+ years of Excel, Google Sheets, and Power BI experience. Founder of NextGenTemplates, reaching 300K+ subscribers across YouTube channels. Every template is hand-built and tested before release.
Explore Related Templates
Read the detailed blog post for Hydropower Projects Dashboard in Power BI. You may also like the Hydropower Projects Dashboard in Excel, Hydropower Projects KPI Dashboard in Power BI, and Geothermal Energy Dashboard in Excel. Browse more Power BI templates and Power BI Dashboard templates.
Download the Hydropower Projects Dashboard in Power BI and start reviewing revenue, budget, generation, risk, location, and operations performance in one editable PBIX report.
Last updated: June 20, 2026.


Reviews
There are no reviews yet.