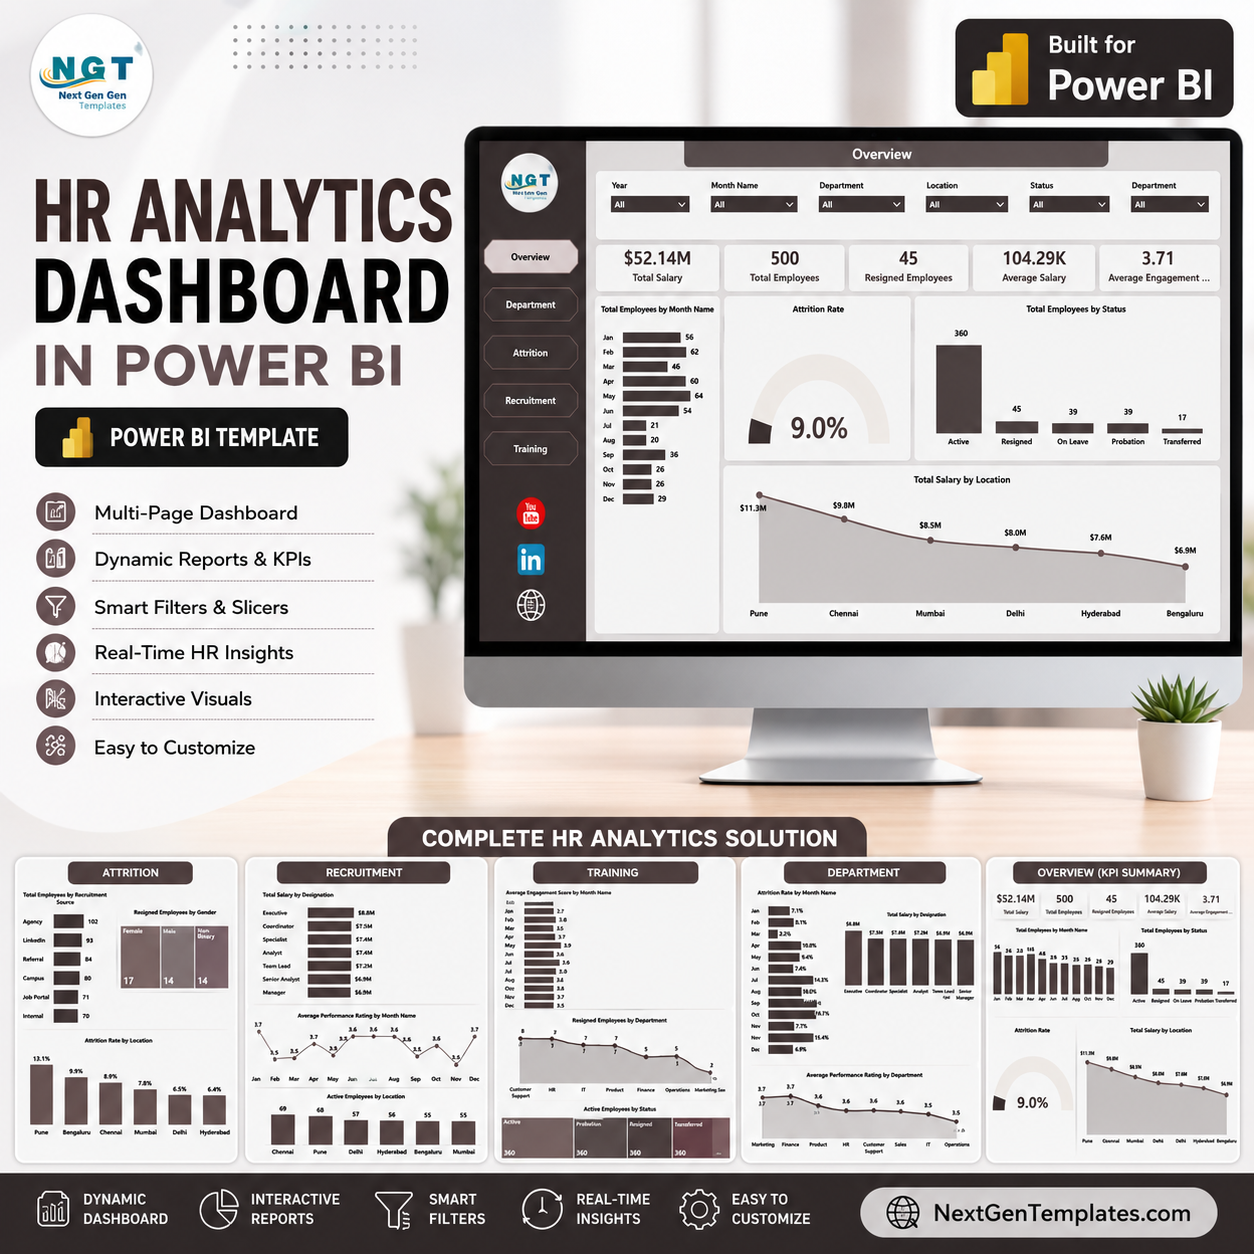
HR Analytics Dashboard in Power BI gives HR managers, people operations teams, HR analysts, and business leaders a ready-to-use report for reviewing workforce trends across 5 Power BI pages, 5 executive KPI cards, and 16 focused HR visuals. At $17.99, it gives your team a low-risk reporting layer for salary, headcount, attrition, recruitment, performance, engagement, department, designation, location, gender, and training analysis without starting from a blank Power BI file.
Key Features of HR Analytics Dashboard in Power BI
- 5 report pages covering Overview, Department, Attrition, Recruitment, and Training.
- 5 top-level cards for Total Salary, Total Employees, Resigned Employees, Average Salary, and Average Engagement Score.
- Multiple slicers for fast filtering by available HR dimensions.
- Salary, employee count, attrition, recruitment, performance, engagement, and training visuals.
- Built in Power BI so users can inspect the model, adjust visuals, and connect their own prepared data source.
- One-time download with no NextGenTemplates subscription.
What’s Inside the HR Analytics Dashboard in Power BI
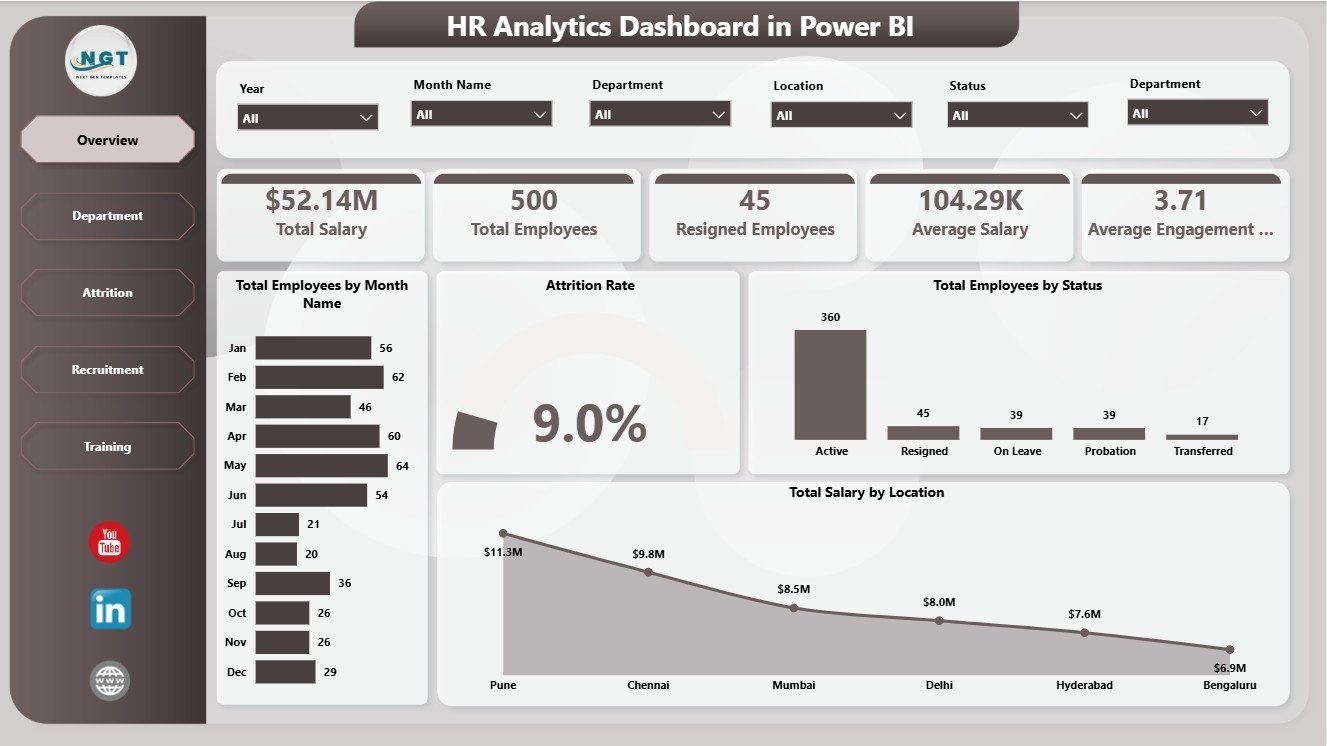
1. Overview Page
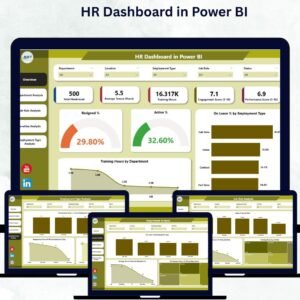
The Overview page gives decision-makers a high-level HR summary. Cards show Total Salary, Total Employees, Resigned Employees, Average Salary, and Average Engagement Score so leadership can quickly review workforce size, cost, exits, and engagement.
Total Employees by Month Name: This chart shows monthly workforce movement and helps HR leaders see where hiring or staffing volume changes over time. It is useful for spotting growth periods, seasonal shifts, or months that need closer review.
Attrition Rate: This visual summarizes employee turnover as a percentage. It helps managers understand resignation pressure and compare attrition movement after applying slicers.
Total Employees by Status: This chart splits employees by active, resigned, or other status values. It gives a quick workforce composition view for management meetings.
Total Salary by Location: This visual compares salary distribution by location. It supports payroll review, location-level budgeting, and regional workforce cost analysis.
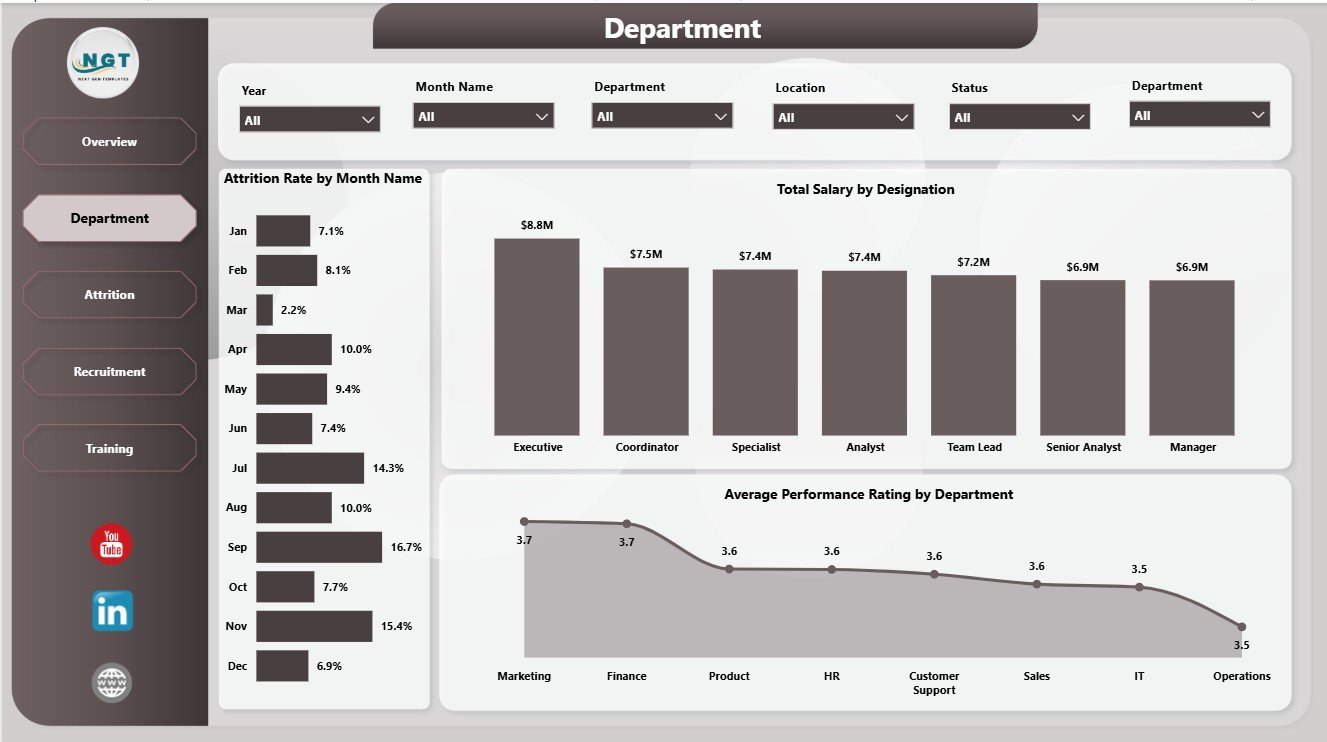
2. Department
The Department page focuses on department-level workforce patterns. Attrition Rate by Month Name helps compare turnover movement across months. Total Salary by Designation shows role-level payroll concentration. Average Performance Rating by Department helps managers compare team performance and identify departments that may need support.
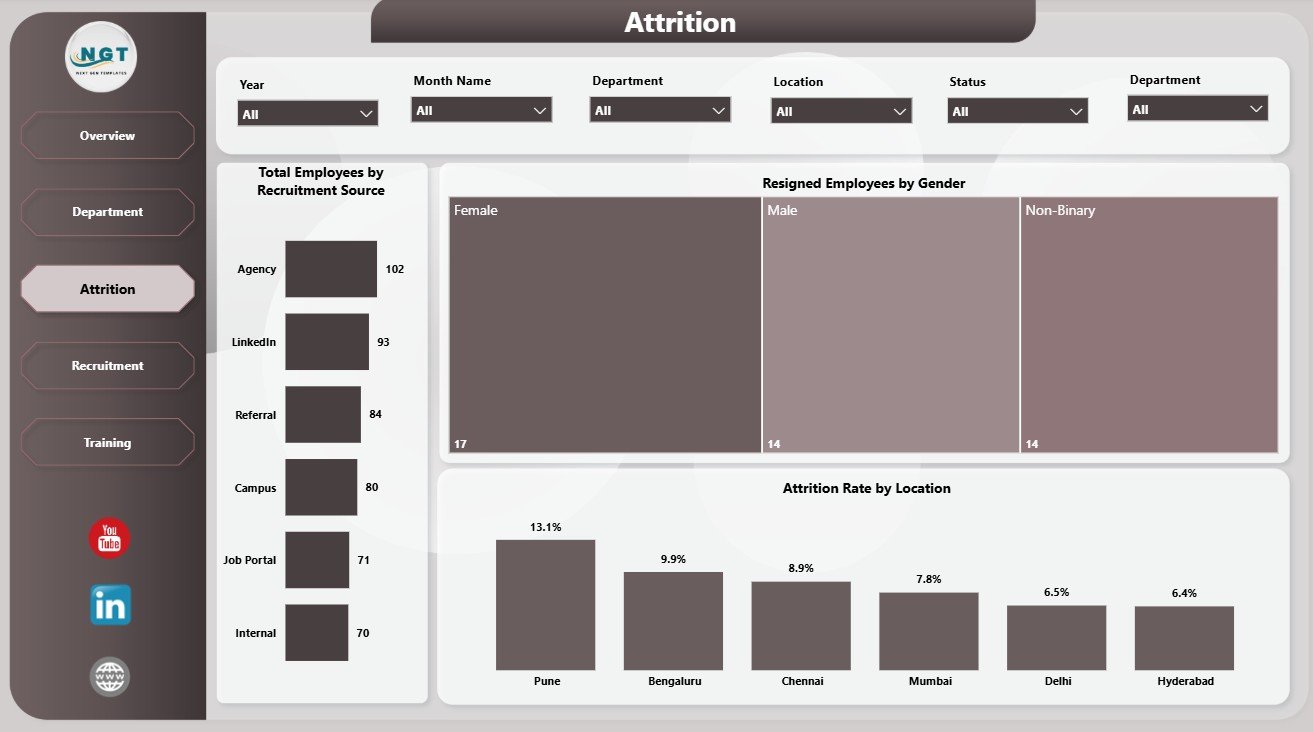
3. Attrition
The Attrition page is built for retention review. Total Employees by Recruitment Source shows where the workforce came from. Resigned Employees by Gender supports demographic turnover review. Attrition Rate by Location helps identify locations with higher resignation risk.
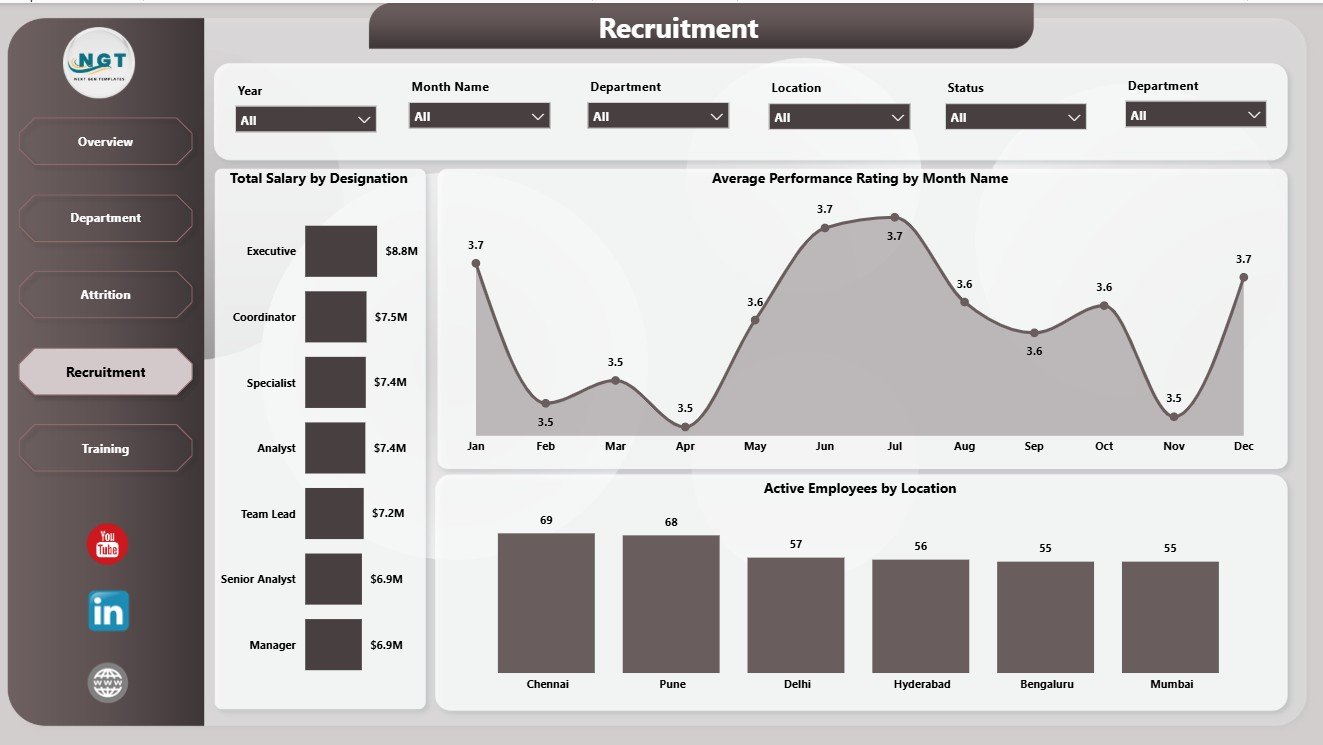
4. Recruitment
The Recruitment page connects hiring, salary, performance, and active employee distribution. Total Salary by Designation highlights payroll cost by role. Average Performance Rating by Month Name tracks performance movement. Active Employees by Location shows where the current workforce is concentrated.
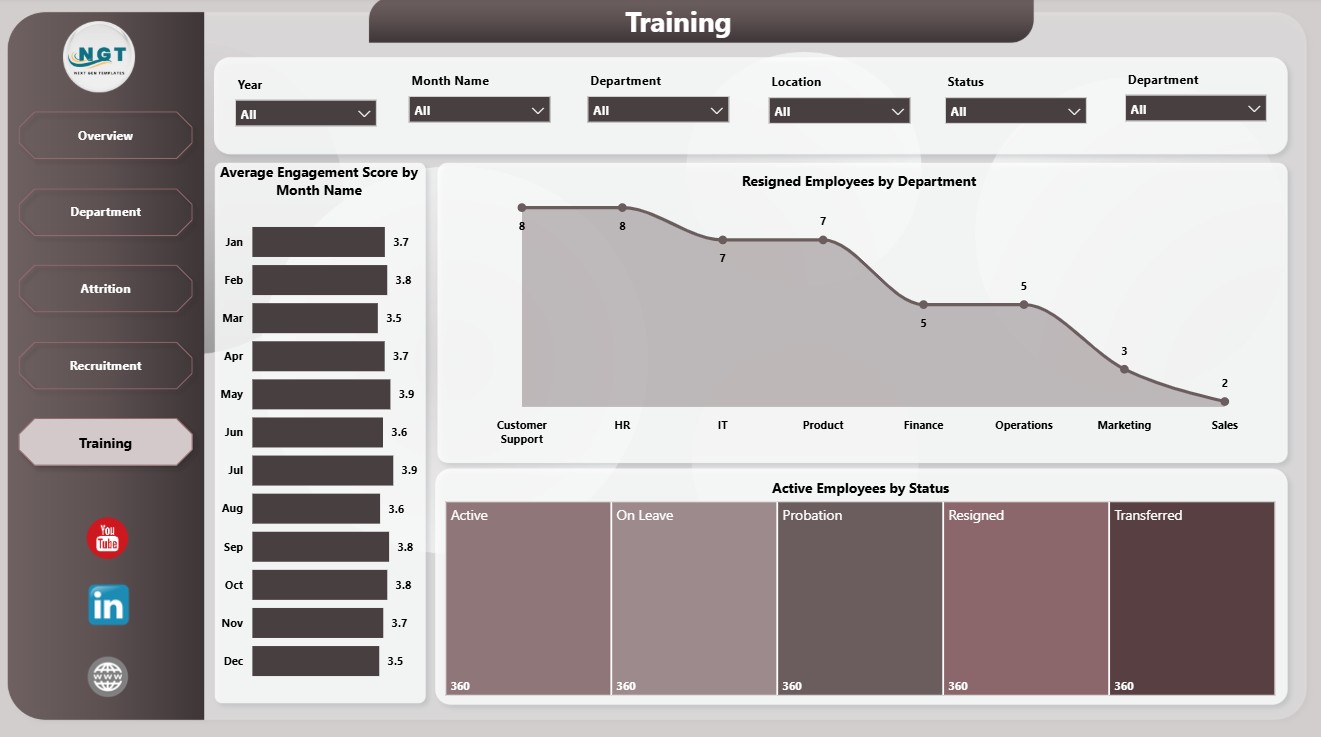
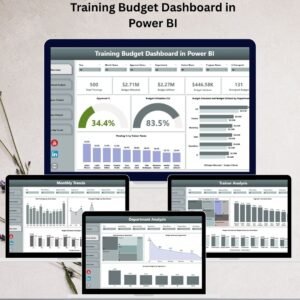
5. Training
The Training page helps HR and L&D teams review employee engagement, department exits, and active employee status. Average Engagement Score by Month Name tracks engagement movement. Resigned Employees by Department highlights teams with more exits. Active Employees by Status provides current workforce context.
HR Analytics Dashboard in Power BI vs. Tableau vs. Paid HR SaaS – Where This Fits
| Feature | This Power BI dashboard | Tableau alternative | Paid HR SaaS |
|---|---|---|---|
| Cost | $17.99 one-time | Requires Tableau setup and licensing | Monthly or annual subscription |
| Platform | Power BI Desktop | Tableau Desktop or Cloud | Vendor-hosted HR system |
| Setup time | Open PBIX and replace/connect data | Build or adapt dashboards | Implementation and onboarding |
| Customizable fields | Editable model and visuals | Editable with Tableau skills | Limited by vendor settings |
| Year-1 cost at 5 users | $17.99 plus existing Power BI use | License-dependent | Often hundreds or thousands |
| HR analytics pages | Built in across 5 pages | Custom setup required | Depends on selected module |
Who This Template Is For – and Who It’s Not For
This template is for HR managers, HR analysts, people operations teams, recruiters, L&D leads, HR consultants, and business owners who want a visual Power BI layer for recurring workforce reporting. It is not a full HRIS, payroll engine, applicant tracking system, employee self-service portal, or live compliance workflow.
How to Use the HR Analytics Dashboard in Power BI
- Download and unzip the product file.
- Open the PBIX file in Power BI Desktop.
- Replace the sample data or connect your prepared HR data source.
- Refresh the report and review the 5 dashboard pages.
- Use slicers to filter by available HR dimensions.
Real-World Use Cases
Priya, HR Manager: She uses the Overview page before leadership meetings to review total salary, headcount, resignations, average salary, and engagement.
Daniel, HR Consultant: He customizes the PBIX for each client and uses the Attrition and Department pages for workforce retention recommendations.
Anita, L&D Lead: She reviews engagement movement and department-level resignations to connect training efforts with employee experience trends.
Frequently Asked Questions
What does this Power BI HR dashboard track?
It tracks salary, employee count, resigned employees, average salary, engagement score, attrition rate, employee status, location, department, designation, recruitment source, gender, performance rating, and monthly trends.
Do I need Power BI Desktop?
Yes. Open the PBIX file in Power BI Desktop, which is available from Microsoft.
Can I connect my own data?
Yes. You can replace the sample data or modify the data source connection inside Power BI Desktop.
Can I customize the pages?
Yes. You can edit visuals, fields, colors, measures, page titles, slicers, and report layout.
Is this a subscription?
No. This is a one-time downloadable Power BI dashboard template from NextGenTemplates.
About the Author
Built by PK – Microsoft Certified Professional with 15+ years of Excel, Google Sheets, and Power BI experience. Founder of NextGenTemplates, reaching 300K+ subscribers across YouTube channels. Every template is hand-built and tested before release.
Explore Related Templates
Explore more Power BI Dashboard templates and related HR Analytics Dashboard in Excel. You may also like the HR & Workforce Analytics Bundle.
Download the HR Analytics Dashboard in Power BI to turn salary, headcount, attrition, recruitment, engagement, performance, and training data into a clear Power BI report.
Watch the step-by-step video tutorial:


Reviews
There are no reviews yet.