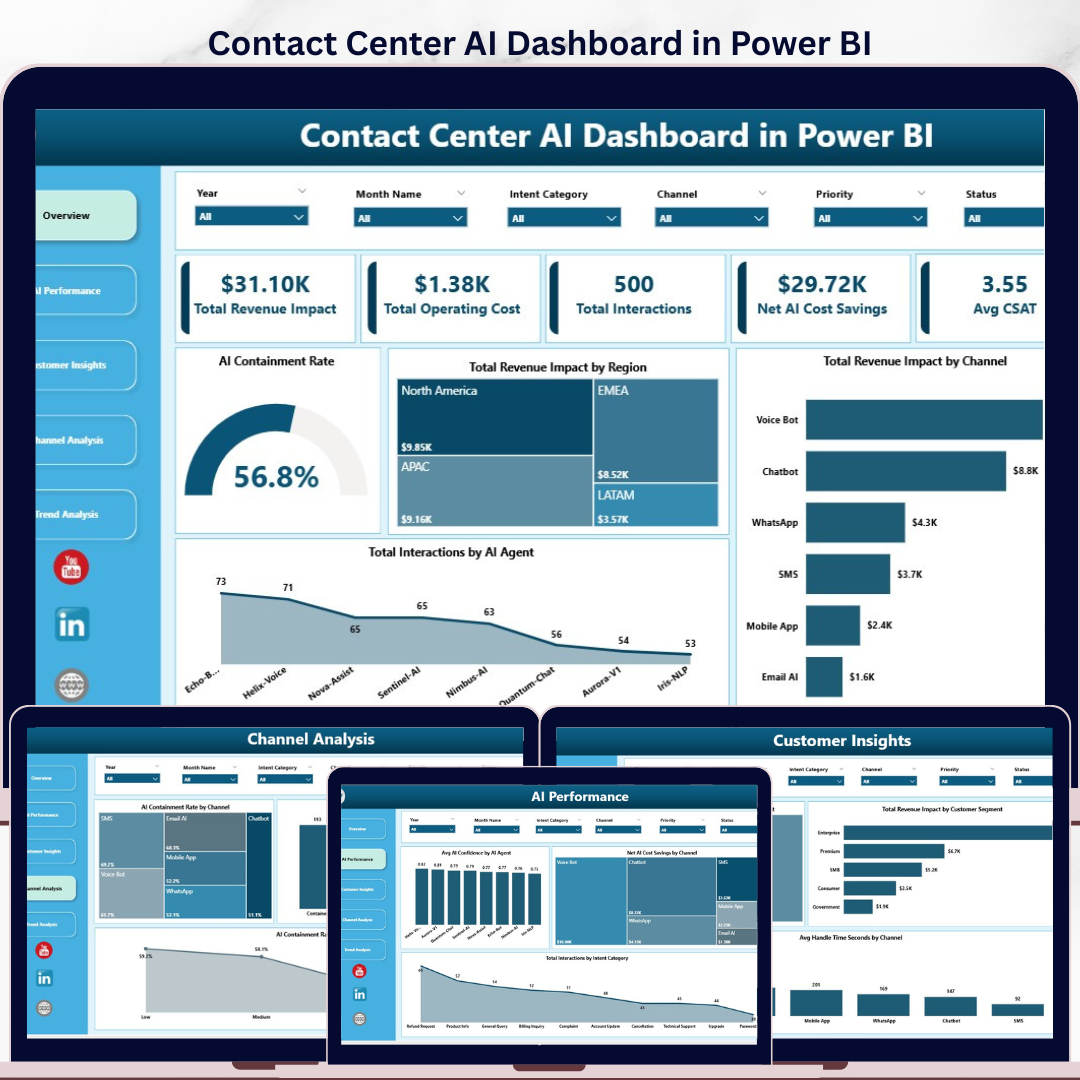


Contact Center AI Dashboard in Power BI helps customer service teams track AI containment, total interactions, revenue impact, operating cost, AI cost savings, CSAT, agent performance, channel mix, sentiment, and resolution trends in one editable PBIX dashboard. Contact center analytics platforms can cost hundreds or thousands per year once dashboards, AI reporting, and agent-based subscriptions are included. This Power BI dashboard gives you a one-time $17.99 reporting template with 5 report pages, 6 executive KPI cards, slicers, and ready-made visuals for leaders who want decision-ready support analytics without a recurring SaaS bill.
Key Features of Contact Center AI Dashboard in Power BI
- Executive KPI cards: Track Total Revenue Impact, Total Operating Cost, Total Interactions, Net AI Cost Savings, Avg CSAT, and AI Containment Rate.
- AI performance reporting: Compare AI confidence, savings by channel, interaction volume by intent category, and AI agent-level activity.
- Customer insight analysis: Review resolution time by sentiment, revenue impact by customer segment, and handle time by channel.
- Channel analysis: See AI containment by channel, interactions by status, and AI containment by priority.
- Trend analysis: Monitor resolution time by priority, language mix, and channel-level resolution performance.
- Interactive slicers: Filter report pages quickly by relevant contact center fields for faster management reviews.
- Editable Power BI format: Use Power BI Desktop to customize colors, measures, data model fields, report pages, and visuals.
What’s Inside the Contact Center AI Dashboard in Power BI
Overview Page
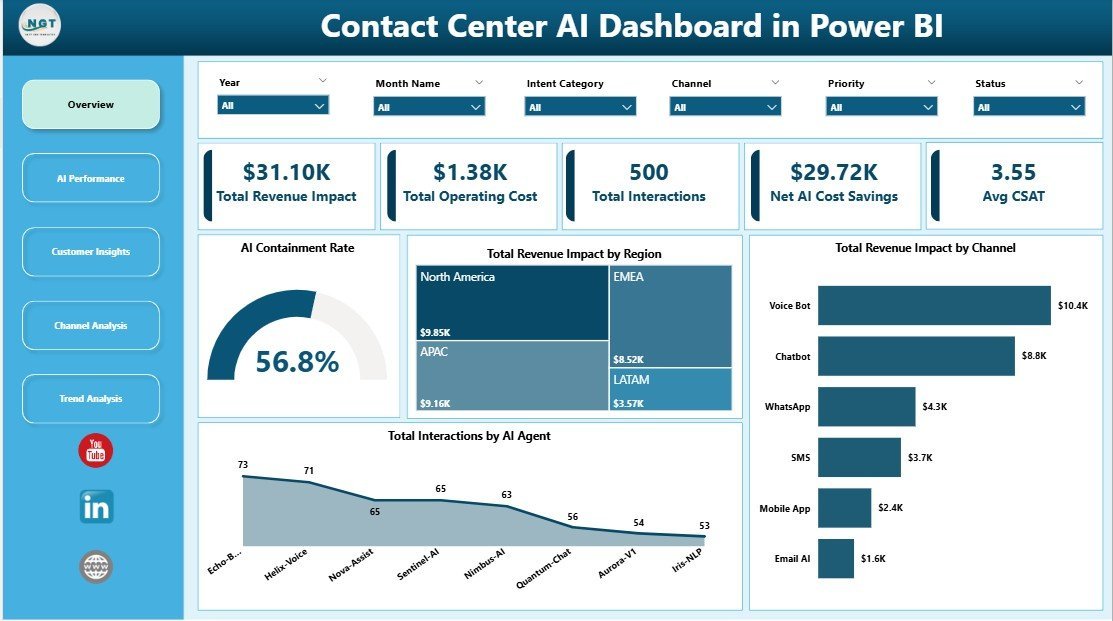
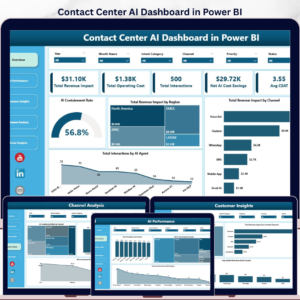
The Overview page gives leadership a fast read on business impact and service performance. The KPI cards summarize revenue impact, operating cost, interaction volume, AI savings, CSAT, and containment rate before users explore deeper pages.
AI Containment Rate by Overall Interactions: This chart shows how much customer demand is resolved through AI compared with total interaction activity. It helps teams understand whether automation is reducing human workload or simply adding another support layer.
Total Revenue Impact by Region: This visual compares financial contribution across regions. Leaders can quickly see where contact center outcomes are strongest and where service quality or escalation rules may need attention.
Total Revenue Impact by Channel: This chart links business impact to service channels such as chat, voice, email, or bot flows. It helps managers decide which channels deserve additional automation or staffing focus.
Total Interactions by AI Agent: This visual compares workload across AI agents. Use it to identify heavily used assistants, underused agents, and candidates for retraining or workflow redesign.

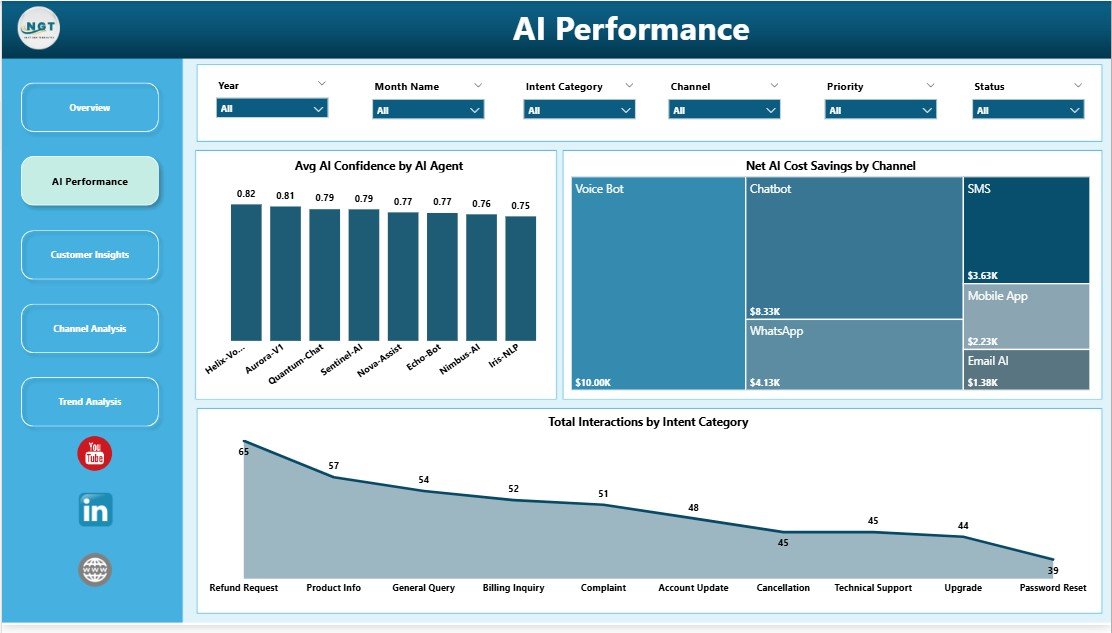
AI Performance
The AI Performance page focuses on automation quality and business contribution. Avg AI Confidence by AI Agent helps teams compare model confidence, Net AI Cost Savings by Channel shows where automation saves the most money, and Total Interactions by Intent Category reveals the customer topics creating the most demand.
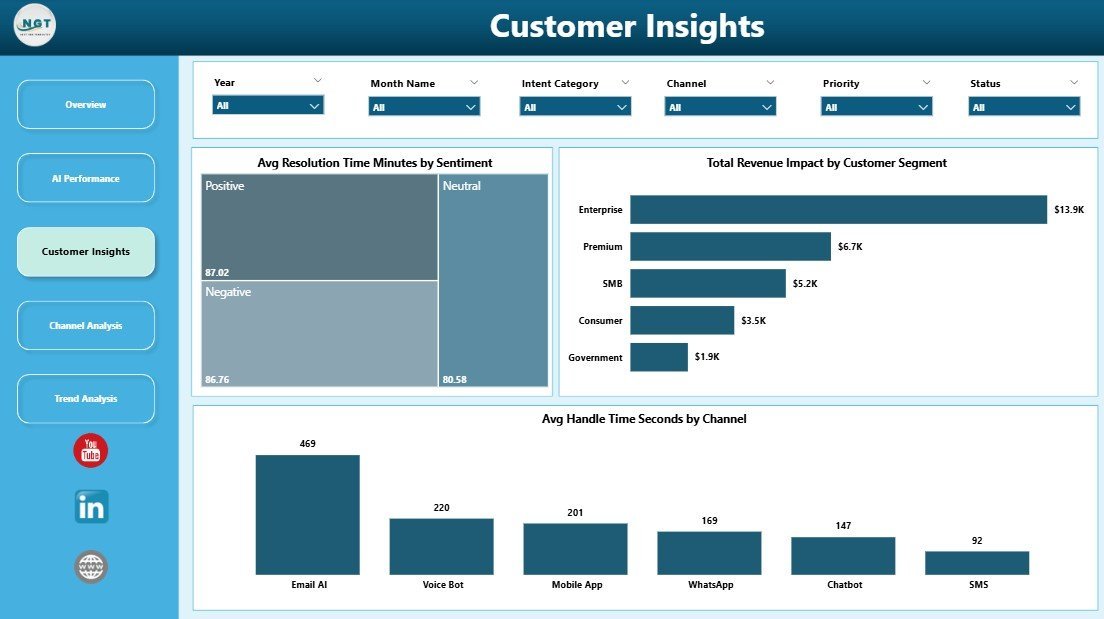
Customer Insights
The Customer Insights page connects AI support activity with customer experience. Avg Resolution Time Minutes by Sentiment shows whether negative interactions take longer, Total Revenue Impact by Customer Segment highlights commercially important groups, and Avg Handle Time Seconds by Channel compares service effort across channels.

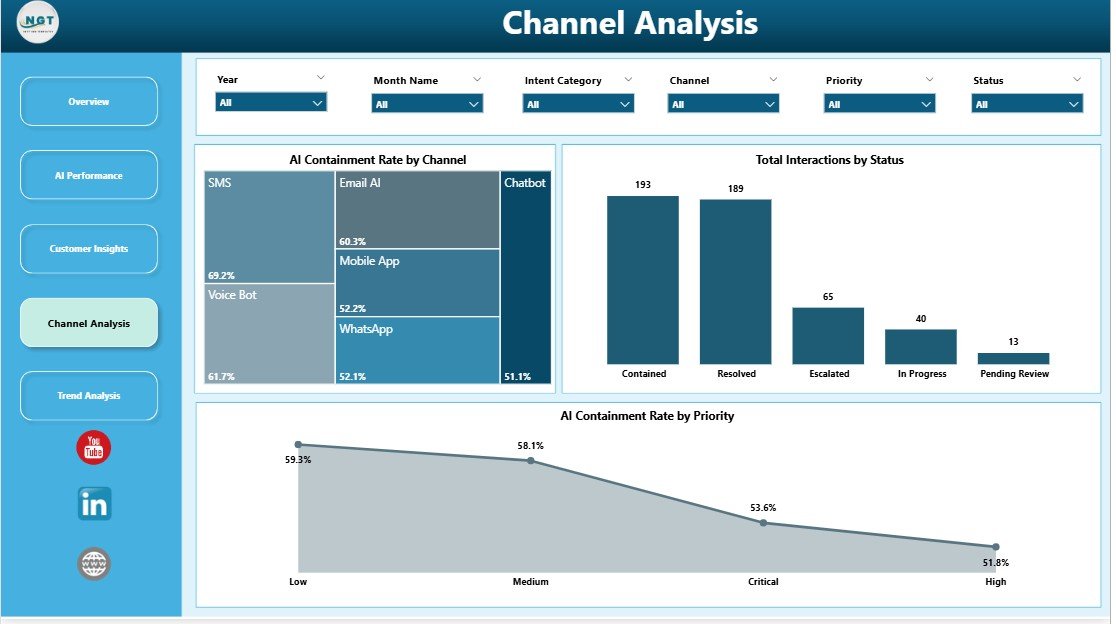
Channel Analysis
The Channel Analysis page helps managers compare containment, workflow status, and priority handling. AI Containment Rate by Channel shows where AI performs best, Total Interactions by Status explains backlog or workflow distribution, and AI Containment Rate by Priority shows whether high-priority issues still need human escalation.
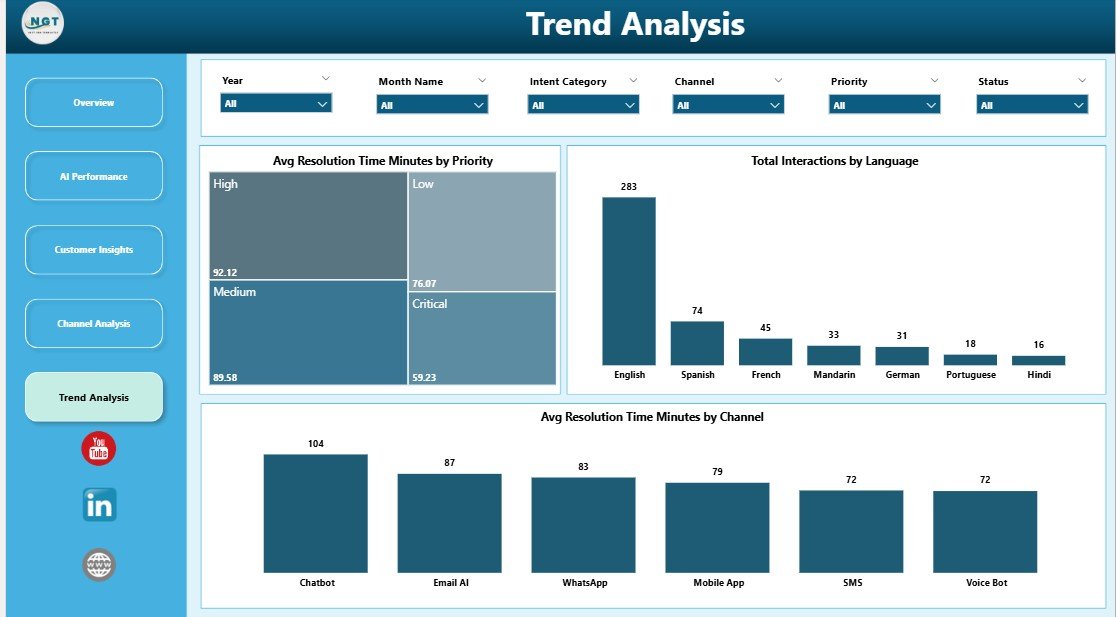
Trend Analysis
The Trend Analysis page is built for performance reviews over time. Avg Resolution Time Minutes by Priority highlights priority-level service speed, Total Interactions by Language shows multilingual demand, and Avg Resolution Time Minutes by Channel helps teams spot process delays by support path.
Contact Center AI Dashboard in Power BI vs. Tableau vs. Paid CRM/SaaS – Where This Fits
| Feature | This Power BI Dashboard | Tableau Alternative | Paid CRM/SaaS Analytics |
|---|---|---|---|
| Cost | $17.99 one-time template price | License or template build cost | Monthly subscription or agent pricing |
| Platform | Power BI Desktop and Power BI Service | Tableau Desktop or Cloud | Vendor-hosted analytics |
| Setup time | Under 10 minutes after download | Depends on model setup | Often requires onboarding |
| AI containment reporting | Included across overview and channel pages | Possible with custom build | Often plan-dependent |
| Customizable fields | Editable PBIX data model and report pages | Editable with Tableau skills | Limited by vendor permissions |
| Year-1 cost at 5 users | $17.99 plus Microsoft licensing you already use | Can rise with licenses | Can reach hundreds or thousands per year |
Who This Template Is For – and Who It’s Not For
This template is for contact center managers, CX analysts, AI operations leads, BPO supervisors, customer service directors, and support teams that already export AI and interaction data and want a faster reporting layer in Power BI.
It is not a replacement for live call routing, agent scheduling, ticketing, call recording, QA scoring, or real-time queue management. If you need direct API sync, enterprise governance, or embedded CCaaS workflows, use this as an analytics companion rather than your core contact center platform.
How to Use the Contact Center AI Dashboard in Power BI
- Download and unzip the product file after purchase.
- Open the PBIX file in Power BI Desktop.
- Replace the sample source with your own contact center export or mapped data source.
- Refresh the report so cards, charts, slicers, and measures update.
- Use the Overview, AI Performance, Customer Insights, Channel Analysis, and Trend Analysis pages for weekly or monthly reviews.
Real-World Use Cases
Priya, Contact Center Manager: She reviews containment by channel every Monday and identifies where human escalation is still too high.
Daniel, CX Analyst: He compares sentiment, resolution time, and customer segment revenue impact to explain where automation improves experience and where it needs tuning.
Maria, BPO Operations Lead: She uses AI savings and channel views to show clients which service paths are reducing cost while maintaining CSAT.
Frequently Asked Questions
What does the Contact Center AI Dashboard in Power BI track?
It tracks revenue impact, operating cost, total interactions, net AI cost savings, CSAT, AI containment rate, confidence, channel, status, priority, language, sentiment, and resolution performance.
Do I need Power BI Desktop?
Yes. Open and customize the PBIX file in Power BI Desktop, which is available from Microsoft.
Can I replace the sample data?
Yes. Replace the sample source with your own exported data, map fields consistently, and refresh the report.
Can this connect directly to Zendesk, Genesys, Freshdesk, or Salesforce?
The template does not include a prebuilt live connector. You can connect Power BI to your own exported or supported data source if your team has access and permissions.
Can I customize the report pages?
Yes. You can edit visuals, measures, fields, colors, filters, and page layouts in Power BI Desktop.
Is this a one-time purchase?
Yes. The template is a one-time download with no subscription fee from NextGenTemplates.
About the Author
Built by PK – Microsoft Certified Professional with 15+ years of Excel, Google Sheets, and Power BI experience. Founder of NextGenTemplates, reaching 300K+ subscribers across YouTube channels. Every template is hand-built and tested before release.
Explore Related Templates
- Contact Center AI Dashboard in Excel – spreadsheet version of this AI contact center reporting workflow.
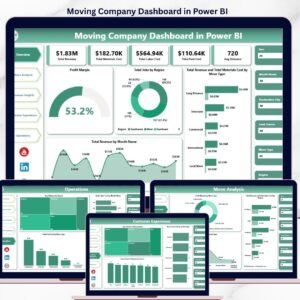
- Moving Company Dashboard in Power BI – operational service analytics in Power BI.
- Pest Control Dashboard in Power BI – field service and technician performance dashboard.
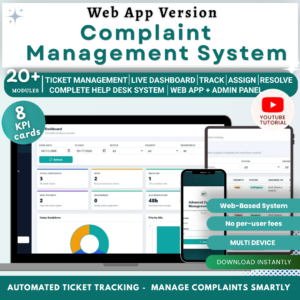
- Complaint Management System: Web App Version – structured complaint tracking with role-based access.
- Browse Power BI Dashboard templates.
Ready to measure AI containment, cost savings, CSAT, and service performance in Power BI? Download the Contact Center AI Dashboard in Power BI and turn support data into decision-ready visuals.
🔗 Click here to read the Detailed blog post


Reviews
There are no reviews yet.