

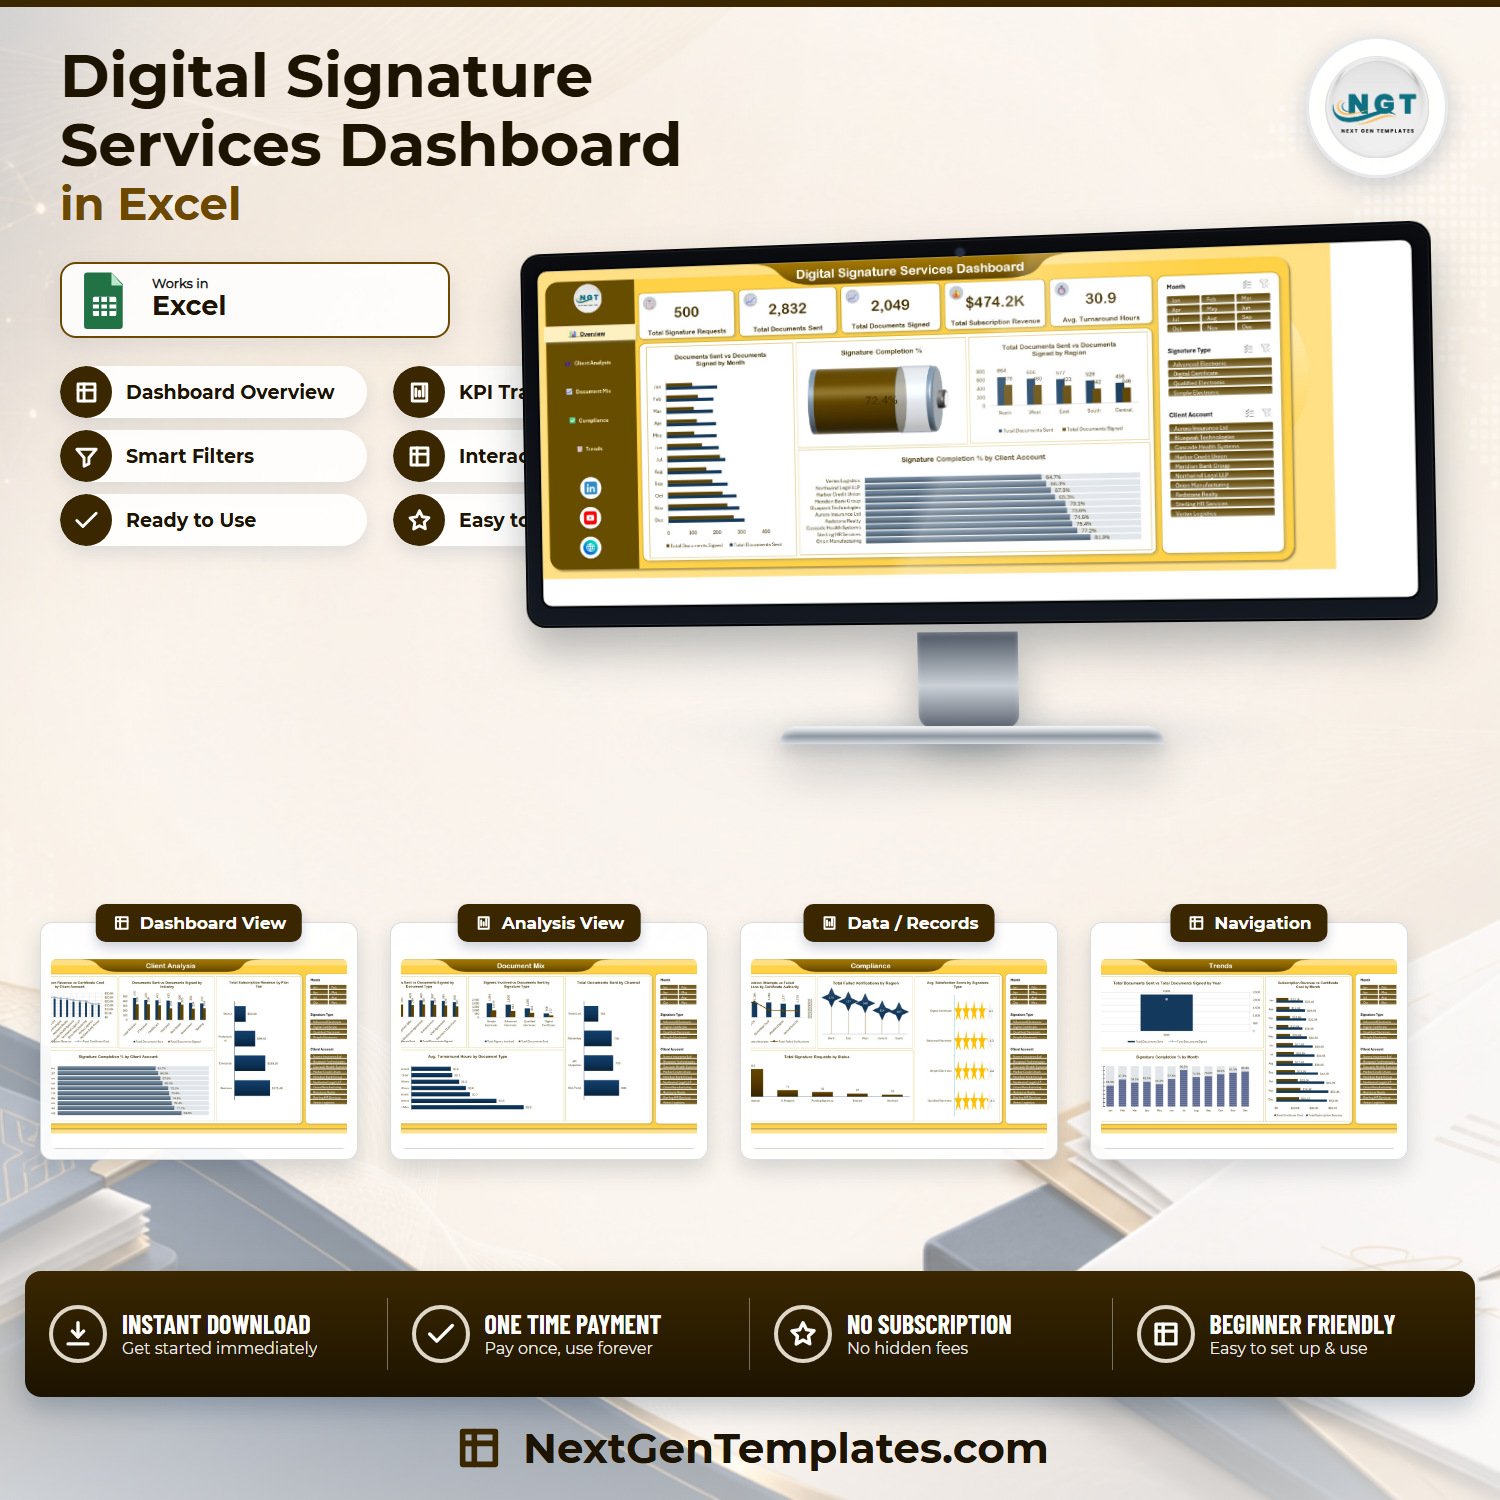

The Digital Signature Services Dashboard in Excel tracks 5 headline KPIs and 19 linked charts across 5 interactive pages, driven by 500 sample signature requests and 23 data columns. The demo file reports 2,832 documents sent, 2,049 signed, a 72.4% signature completion rate, $474.2K subscription revenue and 30.9 average turnaround hours. Setup takes under 10 minutes – paste your own export into the Data sheet, refresh, and every page updates.
This is the analytical Excel Dashboard line – a multi-page pivot-and-slicer workbook, not the single-page Excel KPI Dashboard and not the Excel KPI Scorecard. If you run an e-signature platform, a trust service provider, or the document-operations desk inside a law firm, bank or insurer, this is the reporting layer your signing platform does not give you.
🌍 Join 8,400+ teams in 40+ countries using NextGenTemplates to replace paid SaaS reporting seats with one-time-purchase Excel, Google Sheets and Power BI templates.
✅ Instant download · One-time payment · No subscription · No per-user fees · Lifetime access
🔑 Key Features of the Digital Signature Services Dashboard in Excel
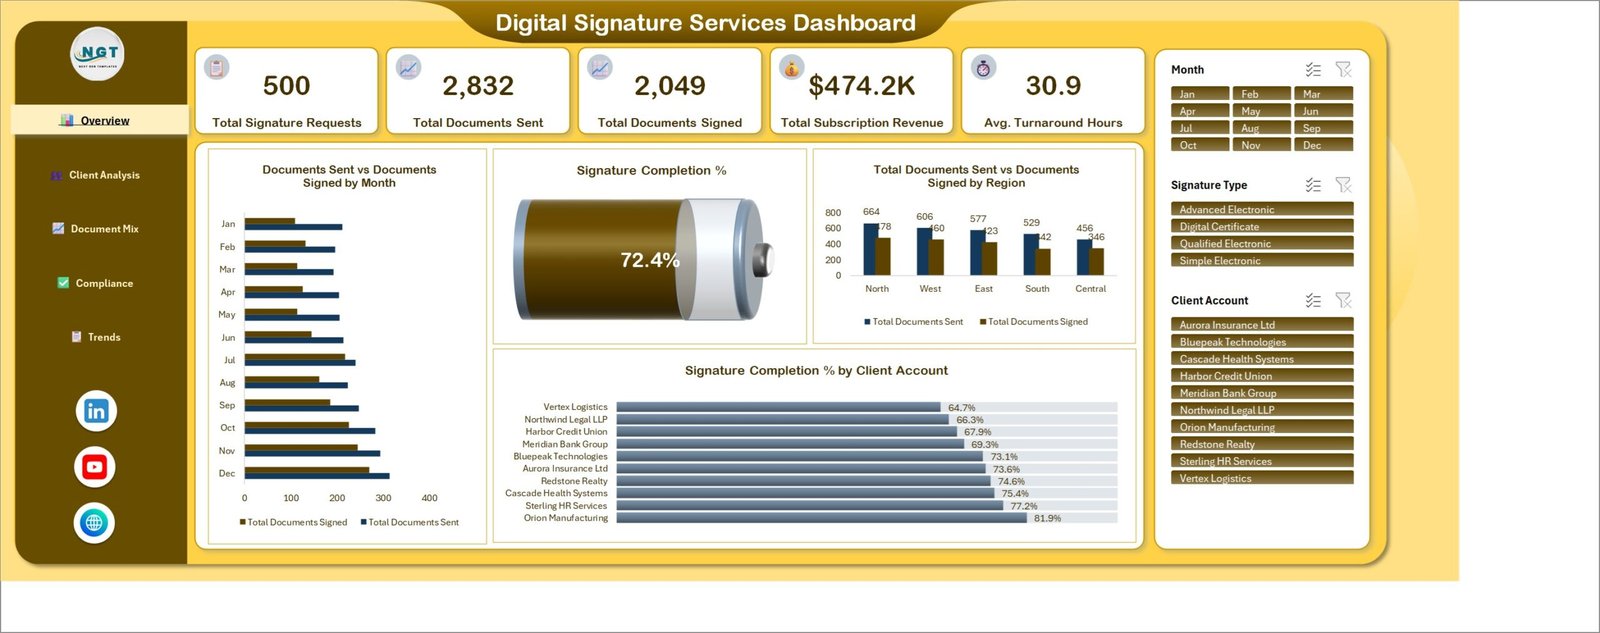
📌 Five KPI cards on every open. The Overview header carries Total Signature Requests, Total Documents Sent, Total Documents Signed, Total Subscription Revenue and Avg. Turnaround Hours. Each card is a formula over the Data sheet, so the numbers move the moment you swap the sample rows for your own.
🎚️ Three synchronised slicers. Month, Signature Type and Client Account sit in a fixed right-hand rail on all five pages. Selecting Qualified Electronic or Northwind Legal LLP re-filters every KPI and every chart on that page at once – no re-building pivots.
🧭 A left navigation rail with five pages. Overview, Client Analysis, Document Mix, Compliance and Trends are one click apart, each laid out on a single screen with no scrolling.
📊 19 charts named for the question they answer. Signature Completion % by Client Account, Documents Sent vs Documents Signed by Document Type, Total Documents Sent by Channel, Verification Attempts vs Failed Verifications by Certificate Authority – every chart title states the metric and the breakdown.
🗂️ A 23-column Data sheet holding 500 sample records. Request ID, Request Date, Client Account, Industry, Region, Country, Document Type, Signature Type, Certificate Authority, Plan Tier, Channel, Documents Sent, Documents Signed, Signers Involved, Turnaround Hours, Verification Attempts, Failed Verifications, Certificate Cost, Subscription Revenue, Satisfaction Score, Status, Month and Year.
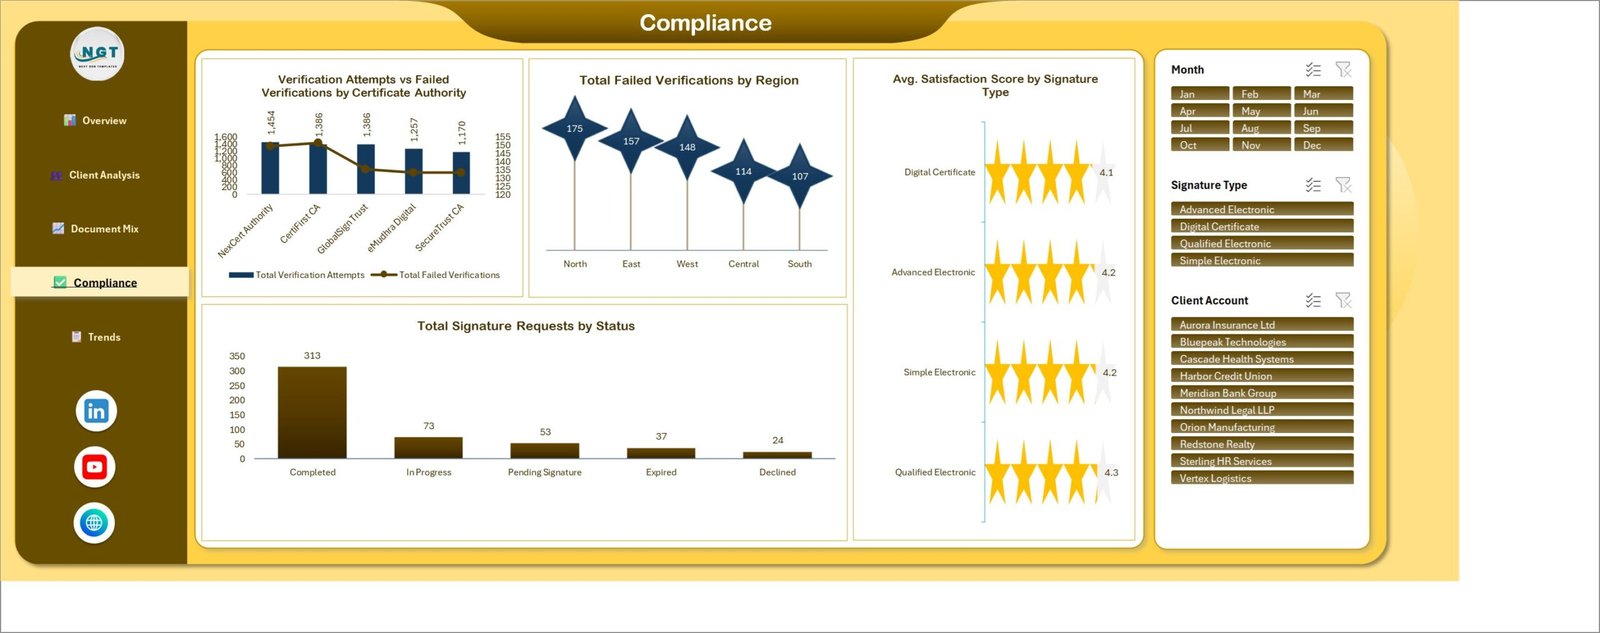
🔒 A dedicated compliance page. Failed verifications by region, verification attempts by certificate authority, satisfaction by signature type and a request-status breakdown (313 Completed, 73 In Progress, 53 Pending Signature, 37 Expired, 24 Declined) sit together on one screen.
📦 What’s Inside the Digital Signature Services Dashboard in Excel
The workbook ships seven sheets: five dashboard pages plus a Data sheet and a Support sheet. Here is each page as it actually appears.
Page 1: Overview
The landing page carries the five KPI cards – 500 Total Signature Requests, 2,832 Total Documents Sent, 2,049 Total Documents Signed, $474.2K Total Subscription Revenue and 30.9 Avg. Turnaround Hours. Charts include Documents Sent vs Documents Signed by Month, Signature Completion % shown as a 72.4% gauge, Total Documents Sent vs Documents Signed by Region, and Signature Completion % by Client Account ranking all ten accounts from 64.7% to 81.9%.
Page 2: Client Analysis
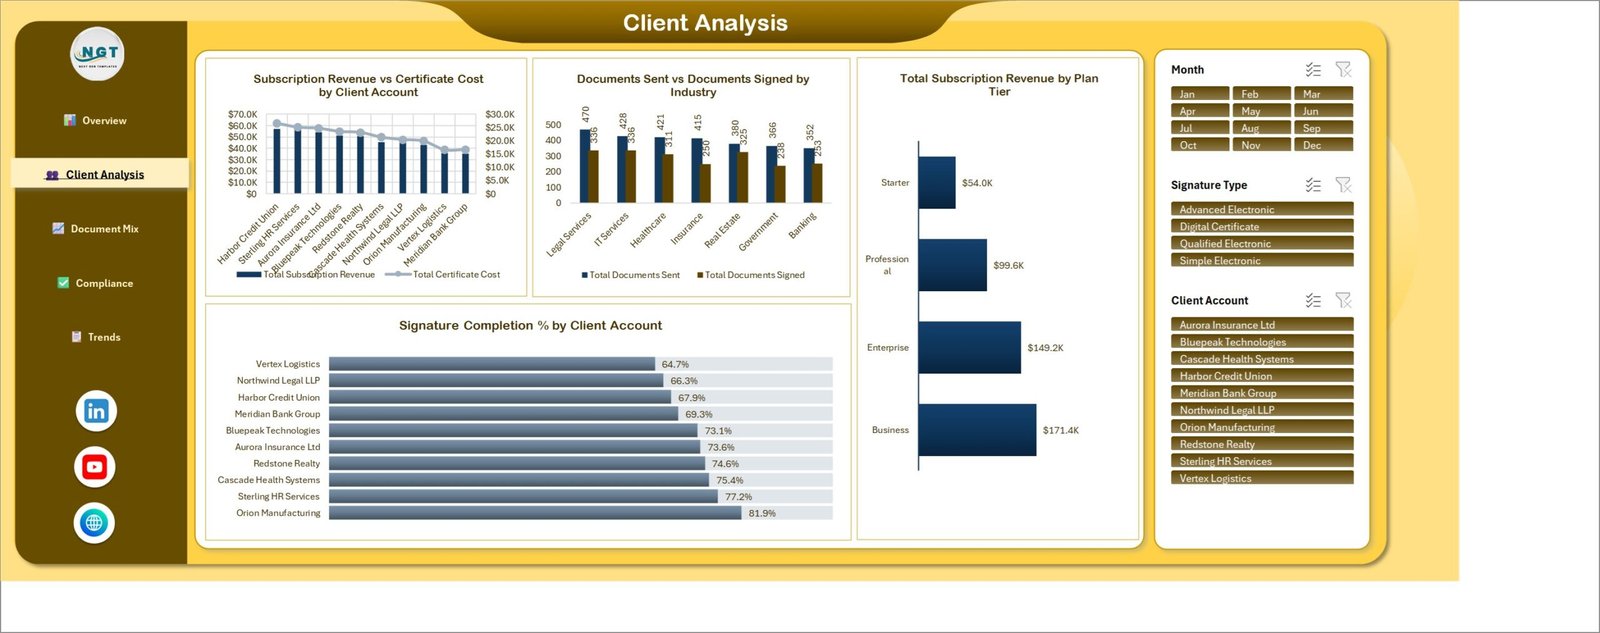
This page answers which accounts and industries actually pay. Charts include Subscription Revenue vs Certificate Cost by Client Account, Documents Sent vs Documents Signed by Industry across Legal Services, IT Services, Healthcare, Insurance, Real Estate, Government and Banking, Total Subscription Revenue by Plan Tier (Business $171.4K, Enterprise $149.2K, Professional $99.6K, Starter $54.0K), and Signature Completion % by Client Account.
Page 3: Document Mix
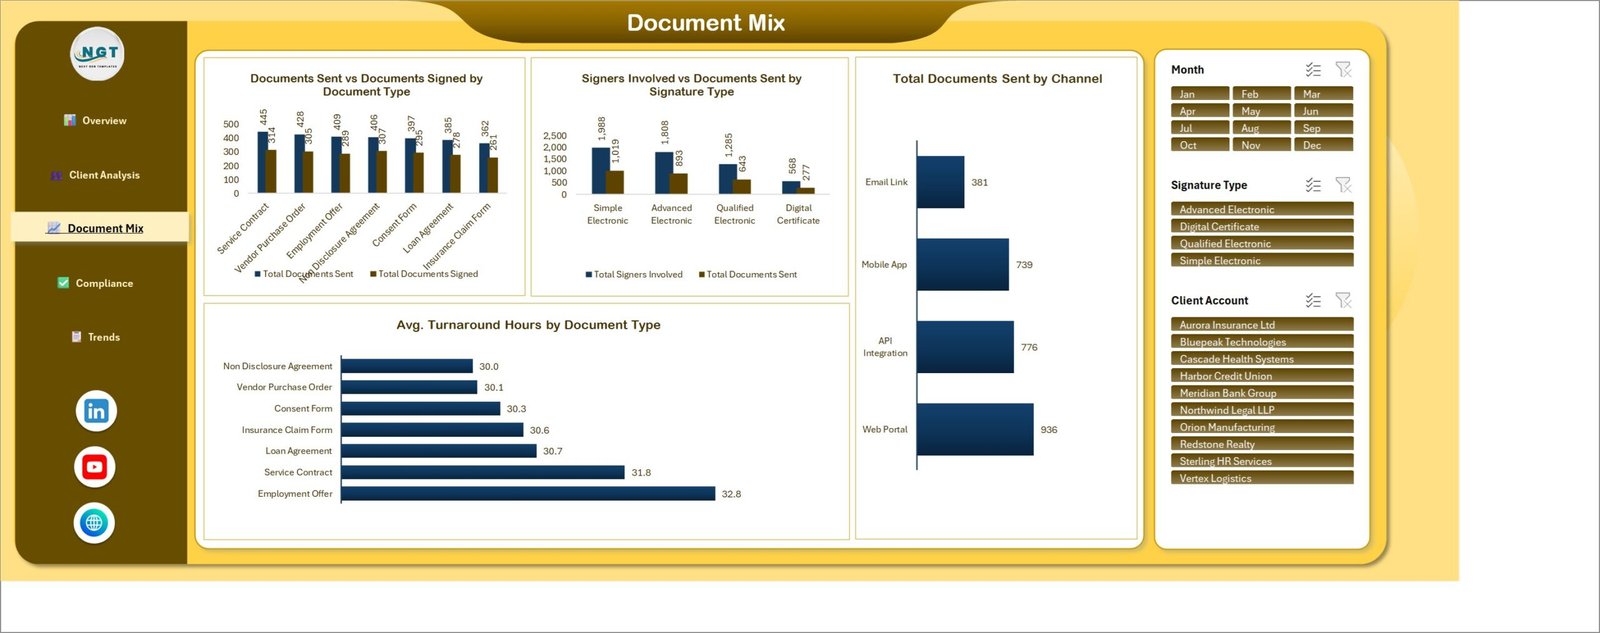
This page profiles what is being signed and how it reaches signers. Charts include Documents Sent vs Documents Signed by Document Type across Service Contract, Vendor Purchase Order, Employment Offer, Non Disclosure Agreement, Consent Form, Loan Agreement and Insurance Claim Form; Signers Involved vs Documents Sent by Signature Type; Total Documents Sent by Channel (Web Portal 936, API Integration 776, Mobile App 739, Email Link 381); and Avg. Turnaround Hours by Document Type, where Employment Offer is slowest at 32.8 hours.
Page 4: Compliance
This page is the audit view. Charts include Verification Attempts vs Failed Verifications by Certificate Authority across NexCert Authority, CertFirst CA, GlobalSignTrust, eMudhra Digital and SecureTrust CA; Total Failed Verifications by Region; Avg. Satisfaction Score by Signature Type rendered as star ratings from 4.1 to 4.3; and Total Signature Requests by Status.
Page 5: Trends
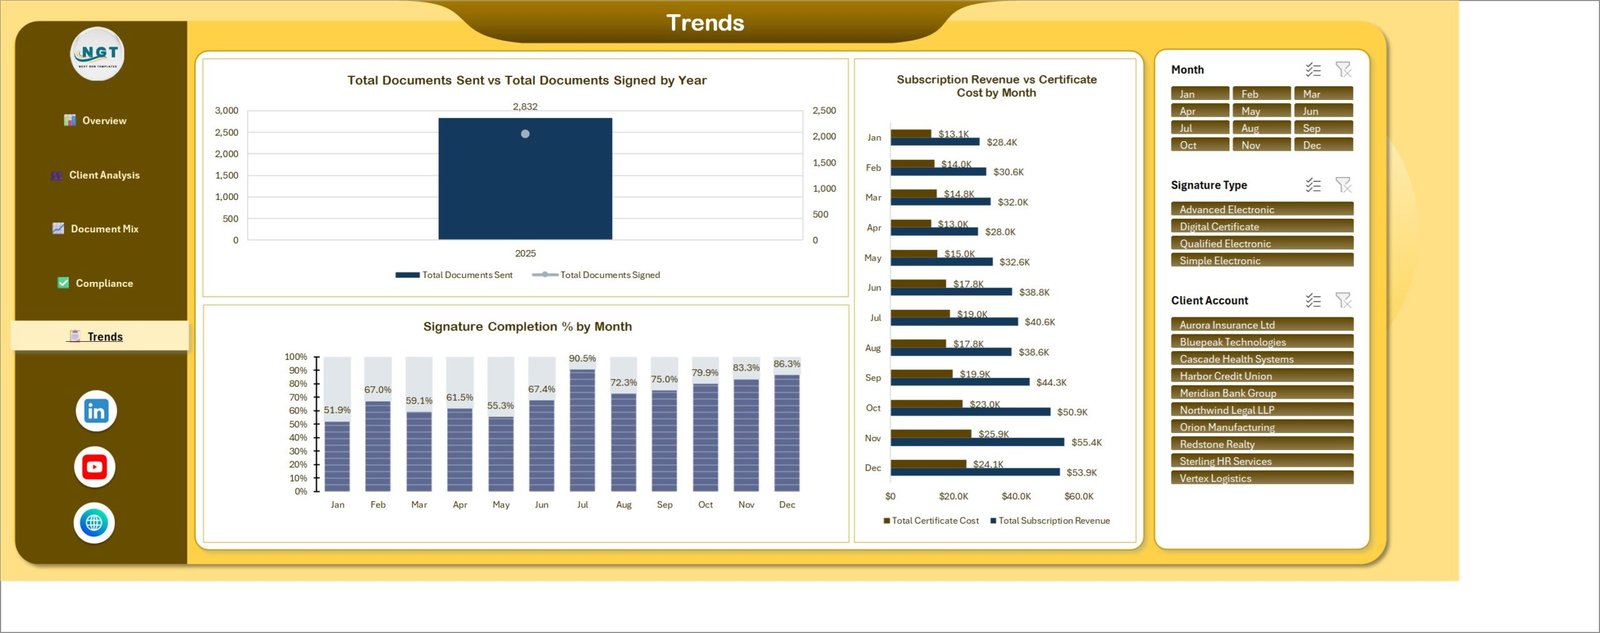
This page shows movement over time. Charts include Total Documents Sent vs Total Documents Signed by Year, Signature Completion % by Month climbing from 51.9% in January to a 90.5% peak in July and 86.3% in December, and Subscription Revenue vs Certificate Cost by Month so you can watch margin as volume grows.
Data Sheet
500 sample signature-request rows across 23 columns. This is the only sheet you edit – delete the sample rows, paste your own export in the same column order, and refresh.
Support Sheet
The pivot tables and helper calculations that feed every chart and KPI card. It stays out of your way, but it is unlocked and visible so you can extend a chart or add a metric yourself.
📊 Digital Signature Services Dashboard in Excel vs. a Google Sheets Build vs. DocuSign / Adobe Acrobat Sign Reporting
| Feature | Digital Signature Services Dashboard in Excel | Google Sheets equivalent | DocuSign / Adobe Acrobat Sign reporting |
|---|---|---|---|
| Cost | $17.99 one-time ✅ | $9-17 one-time | $25-65 per user per month |
| Platform | Microsoft Excel, works offline ✅ | Browser only | Vendor cloud only |
| Setup time | Under 10 minutes ✅ | Under 10 minutes | Days – admin roles and report builders |
| Works across multiple signing vendors | Yes – any CSV export ✅ | Yes | No – your own platform only |
| Certificate authority failure analysis | Built in ✅ | Build it yourself | Partial, enterprise tiers only |
| Real-time team collaboration | Via OneDrive / SharePoint | Native ✅ | Native |
| Mobile access | Excel mobile app | Any browser ✅ | Native app |
| Customisable fields and charts | Fully – unlocked pivots ✅ | Fully | Fixed report catalogue |
| Year-1 cost at 5 users | $17.99 total ✅ | $17 total | $1,500-3,900 |
For teams that want signature-completion, turnaround and certificate-failure reporting across every signing vendor they use without paying per-seat analytics fees, the Digital Signature Services Dashboard in Excel sits in the sweet spot.
👥 Who This Template Is For – and Who It’s Not For
✅ This template is built for:
- Operations and customer-success leads at e-signature and trust service providers running 10-500 client accounts
- Document-operations and contract teams in law firms, banks, insurers and HR shared services who send hundreds of documents a month
- Compliance officers who need failed-verification and certificate-authority evidence in a file an auditor can open
- Analysts who already live in Excel pivots and want a finished layout instead of building one
❌ This template is NOT for:
- Anyone who needs to actually send or sign documents – this reports on signing activity, it does not perform signing
- Teams needing a live API feed; this refreshes when you paste a new export, not continuously
- Enterprises requiring SOC 2 controls, SSO and row-level security inside the reporting tool itself
- Datasets far beyond a few hundred thousand rows, where a Power BI dashboard is the better fit
⚙️ How to Use the Digital Signature Services Dashboard in Excel
- Download the ZIP and open the workbook in Microsoft Excel 2016 or later, or Microsoft 365.
- Open the Data sheet and review the 23 sample columns so you know the expected order.
- Export your signature-request history from your signing platform as CSV.
- Delete the sample rows and paste your own records under the same headers.
- Press Ctrl+Alt+F5 to refresh all pivots. Every KPI and chart recalculates.
- Use the Month, Signature Type and Client Account slicers to filter any page.
- Print or export a page to PDF for your monthly service review.
💼 Real-World Use Cases
Priya runs client operations at a regional e-signature provider with 40 accounts. She uses the Signature Completion % by Client Account chart to spot which accounts sit under 70% – in the sample file that is Vertex Logistics at 64.7% – and books a workflow review with them before renewal, instead of discovering the problem at churn.
Daniel is the document-operations manager at a mid-size law firm. He filters to Qualified Electronic signatures and reads Avg. Turnaround Hours by Document Type to prove that Employment Offer packs take 32.8 hours against 30.0 for NDAs, then re-orders the signer sequence on the slowest template.
Fatima is a compliance officer at an insurer. Each quarter she exports the Compliance page – failed verifications by certificate authority and by region, plus the request-status split – as the evidence pack for her internal audit, a job that used to mean three manual pivot rebuilds.
❓ Frequently Asked Questions
What KPIs does the Digital Signature Services Dashboard in Excel track?
The Digital Signature Services Dashboard in Excel tracks five headline KPIs – Total Signature Requests, Total Documents Sent, Total Documents Signed, Total Subscription Revenue and Avg. Turnaround Hours – plus signature completion rate, failed verifications, satisfaction score and certificate cost across 19 charts.
How long does setup take?
Under 10 minutes. Open the Digital Signature Services Dashboard in Excel, replace the 500 sample rows on the Data sheet with your own export in the same 23-column order, and press Ctrl+Alt+F5. All five pages recalculate immediately – no formula editing and no macros to enable.
How does this compare to DocuSign or Adobe Acrobat Sign reporting?
Vendor reporting only covers documents sent through that vendor and is billed per user per month. The Digital Signature Services Dashboard in Excel is a $17.99 one-time file that accepts a CSV export from any signing platform, so you can report across several vendors in one place.
Does it work with any e-signature platform?
Yes. The Digital Signature Services Dashboard in Excel reads a plain 23-column table, so any platform that exports request-level history to CSV or Excel will work. Map your export columns to the Data sheet headers once and the mapping holds for every future refresh.
Do I need macros or add-ins?
No. The Digital Signature Services Dashboard in Excel is a standard .xlsx workbook built on pivot tables, slicers and native Excel charts. There is no VBA, no macro security prompt and no add-in to install – it opens cleanly on locked-down corporate machines.
Can I add my own metrics or change the colours?
Yes. The Support sheet holding the pivots is visible and unlocked, so you can add a column to the Data sheet, extend a pivot and drop a new chart onto any page. The brown-and-gold theme is standard Excel formatting you can restyle to your brand.
Is this the same as the Excel KPI Dashboard line?
No. The Digital Signature Services Dashboard in Excel is an analytical five-page dashboard with slicers and pivot-driven charts. The Excel KPI Dashboard and Excel KPI Scorecard lines are month-picker scorecards with traffic lights and trend pages – a different template family with a different layout.
👤 About the Author
Built by PK – Microsoft Certified Professional with 15+ years of Excel, Google Sheets and Power BI experience. Founder of NextGenTemplates, reaching 300K+ subscribers across YouTube channels (@PK-AnExcelExpert, @NextGenTemplates, @NeoTechNavigators). Every template is hand-built and tested before release.
🔗 Explore Related Templates
If signature data is one part of a wider privacy and security remit, the Data Protection Office Dashboard in Excel covers DSARs, breach handling and GDPR workload on the same five-page pattern. For custody of the keys and credentials behind those certificates, see the Digital Asset Custodians Dashboard in Excel. Teams tracking threat exposure alongside document risk usually pair it with the Cyber Risk Management Dashboard in Power BI.
For the audit side of the same job, the Compliance Audit KPI Dashboard in Google Sheets is a lighter monthly scorecard, and the Meeting Minutes Data Entry System in Excel captures the approvals that lead to a signature request. Browse the full Excel Dashboard Templates collection for more.
📖 Click here to read the Detailed Blog Post
🎥 Visit our YouTube channel for step-by-step video tutorials
👉 YouTube.com/@NextGenTemplates
📅 Last updated: September 2026
Watch the demo video:
Compatibility and Requirements
- Works in Microsoft Excel desktop (Excel 2016 or later, or Microsoft 365).
- The pages are driven by pivot tables and slicers. Microsoft explains slicers in Use slicers to filter data.
Related Digital Signature and Service Templates
- Digital Signature Services Dashboard in Power BI: the same topic in Power BI
- IT Services Dashboard in Excel: service reporting for IT teams
- Customer Service Dashboard in Excel: another multi-page Excel dashboard for service teams
- Shared Services KPI Dashboard in Excel: a KPI view for shared services
- KPI Dashboard Library (Excel): 15 Excel dashboards in one download
Browse all Excel dashboards and IT templates.


































Reviews
There are no reviews yet.