

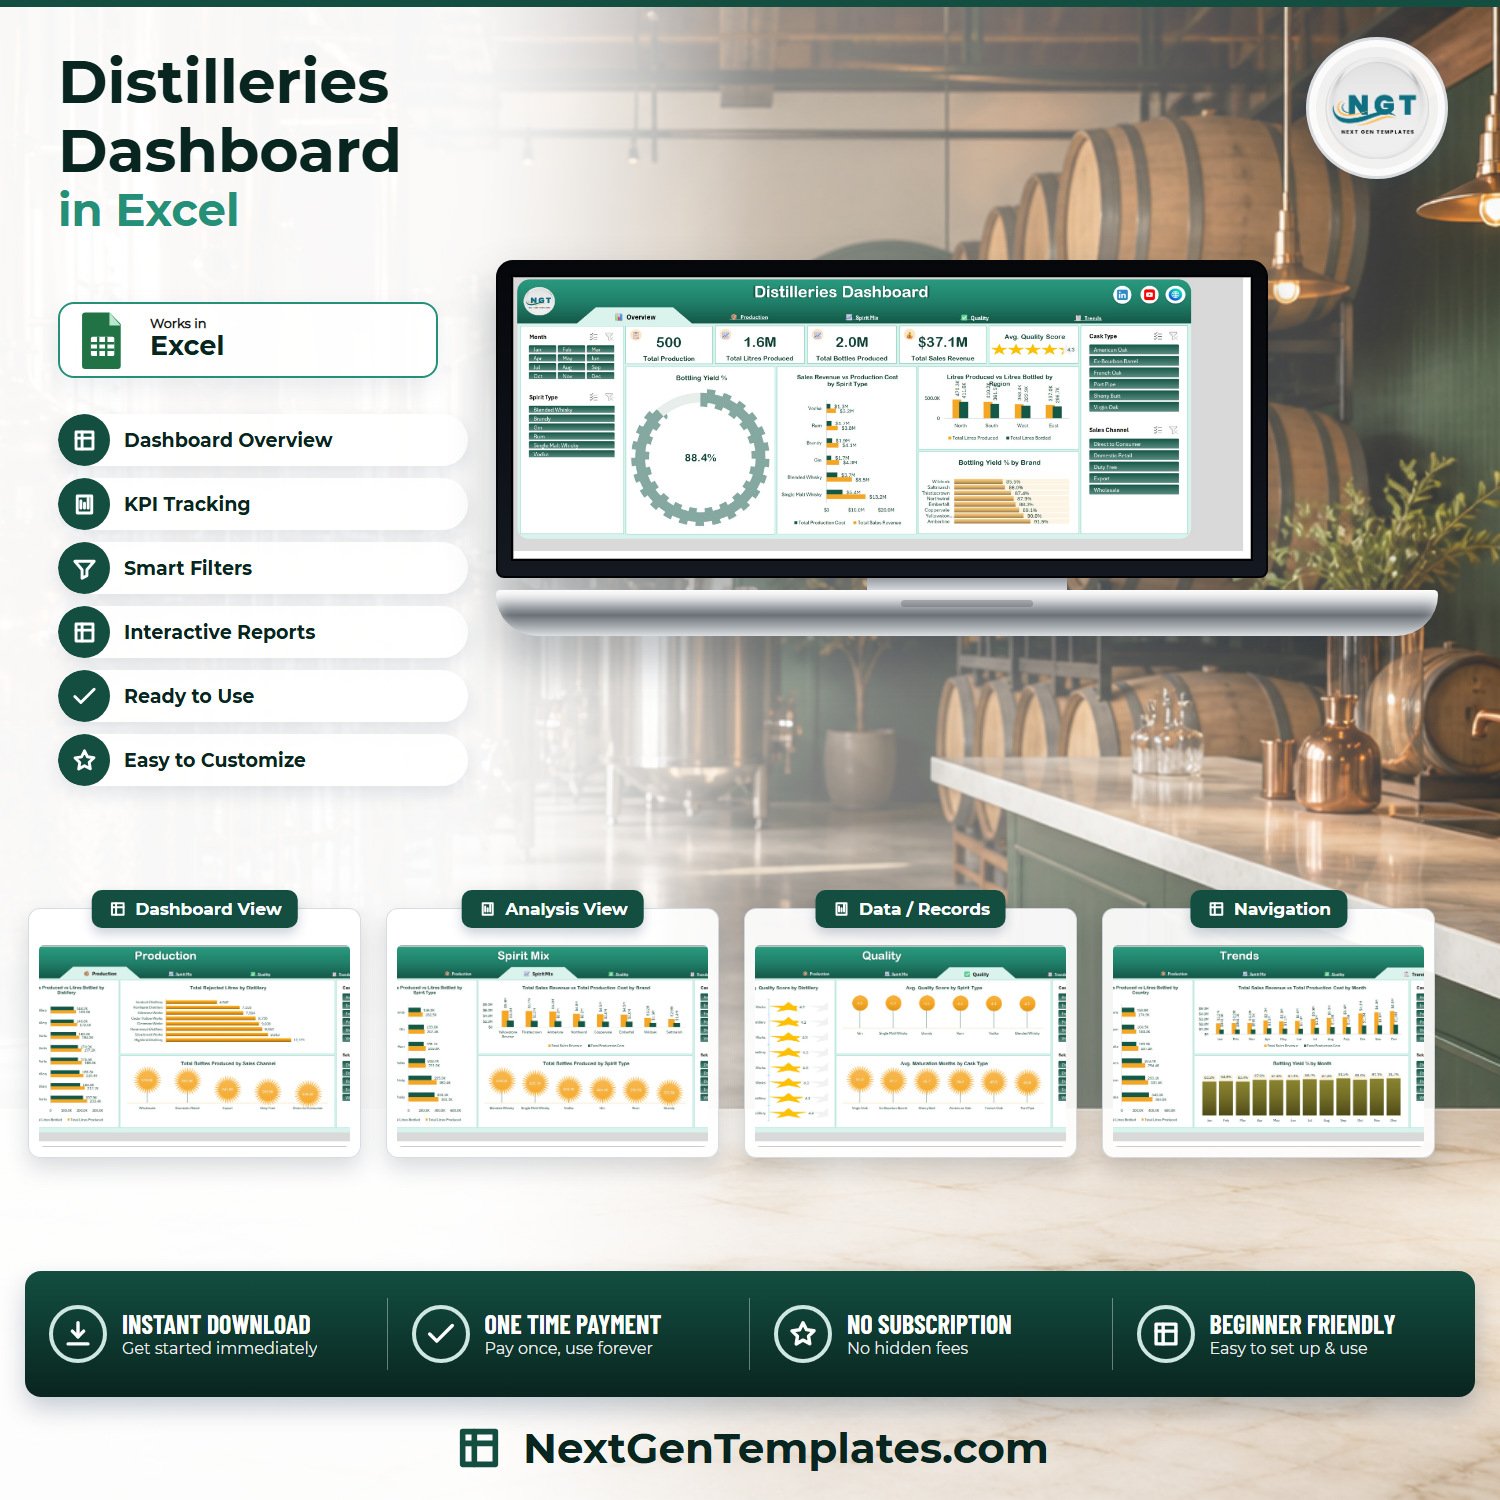

The Distilleries Dashboard in Excel turns 500 production batches into 5 linked dashboard pages, 21 pivot tables and 17 pivot charts, all filtered live by 4 slicers. The loaded sample covers 8 distilleries, 8 brands, 6 spirit types, 6 cask types and 6 countries – 1.6M litres produced, 2.0M bottles filled, $37.1M in sales revenue and an 88.4% bottling yield.
Setup takes under 10 minutes. Paste your own batch log into the Data sheet, hit Refresh All, and every KPI card, chart and slicer on all five pages updates from your numbers. No add-ins, no macros, no monthly fee.
🌍 Join 8,400+ teams in 40+ countries using NextGenTemplates to replace paid SaaS tools with one-time-purchase Excel, Google Sheets, Power BI and HTML templates.
✅ Instant download · One-time payment · No subscription · No per-user fees · Lifetime access
🔑 Key Features of the Distilleries Dashboard in Excel
- 🥃 Five linked pages – Overview, Production, Spirit Mix, Quality and Trends. A tab strip at the top of every sheet jumps straight to any other page, so nobody has to hunt through the workbook.
- 🎚 Ten metrics tracked end to end – Total Production batches, Total Litres Produced, Total Litres Bottled, Total Bottles Produced, Total Rejected Litres, Bottling Yield %, Total Sales Revenue, Total Production Cost, Avg. Quality Score and Avg. Maturation Months.
- 🎟 Four slicers synced across every page – Month, Spirit Type, Cask Type and Sales Channel. Click “Single Malt Whisky” once and all five pages re-cut to single malt only.
- 📊 17 live pivot charts on 21 pivot tables – every visual is a real pivot chart wired to the Data sheet. Nothing in this workbook is a pasted picture of a chart.
- 💧 Yield loss made visible – Litres Produced is charted against Litres Bottled by distillery, spirit type, region and country, with Total Rejected Litres by Distillery next to it, so the gap between what you distilled and what you sold is impossible to miss.
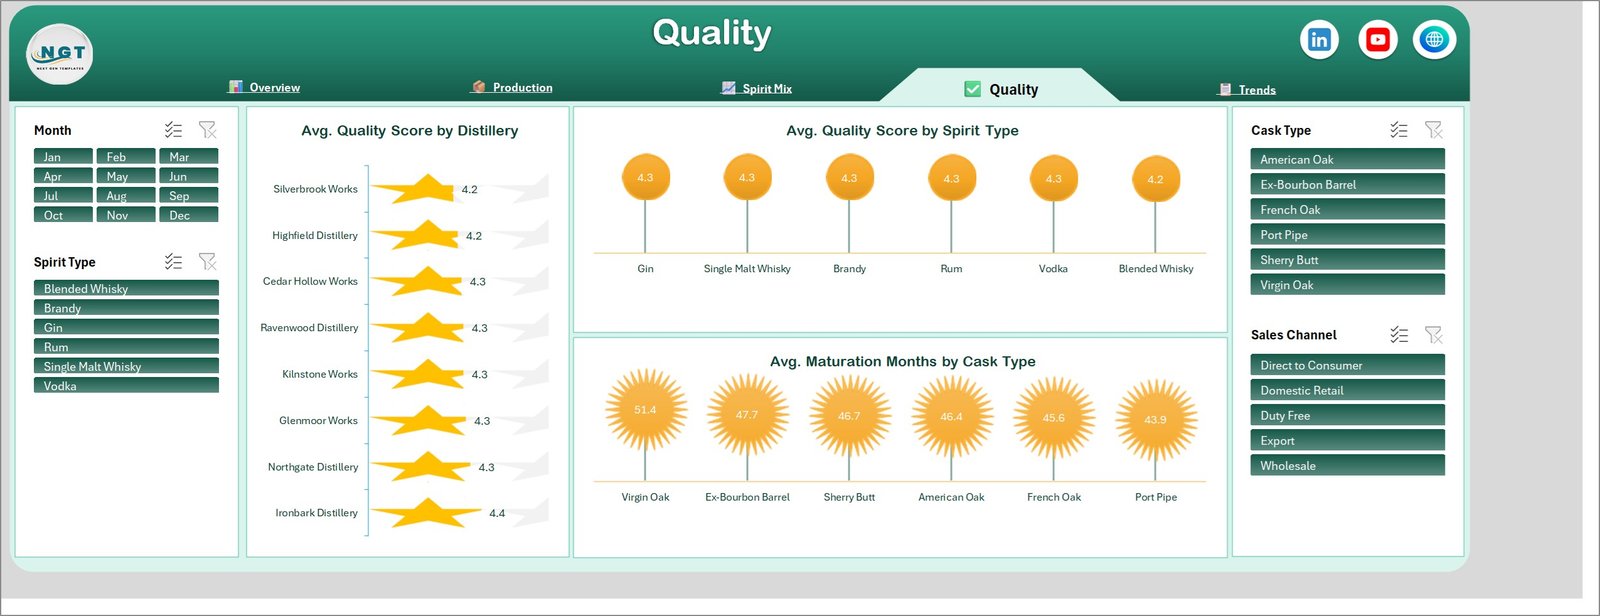
- ⭐ Quality and maturation built in – Avg. Quality Score by Distillery and by Spirit Type, plus Avg. Maturation Months by Cask Type across American Oak, Ex-Bourbon Barrel, French Oak, Port Pipe, Sherry Butt and Virgin Oak.
- 💰 Margin at brand level – Total Sales Revenue vs Total Production Cost is charted by spirit type, by brand and by month, so a brand that sells well but costs too much to make stands out immediately.
- 📋 500 sample records across 22 data fields – Batch ID, Production Date, Distillery, Region, Country, Spirit Type, Brand, Cask Type, Sales Channel, Litres Produced, Litres Bottled, Bottles Produced, Rejected Litres, Alcohol By Volume, Maturation Months, Quality Score, Production Cost, Sales Revenue, Excise Duty, Status, Month and Year.
- 🎨 Fully editable – it is an ordinary .xlsx workbook. Change the green theme, rename a brand, add a distillery or drop a chart. You own the file.
📦 What’s Inside the Distilleries Dashboard in Excel
Seven sheets in total: five dashboard pages you look at, one Data sheet you paste into, and one Support sheet that holds the pivot tables feeding the charts.
Page 1: Overview
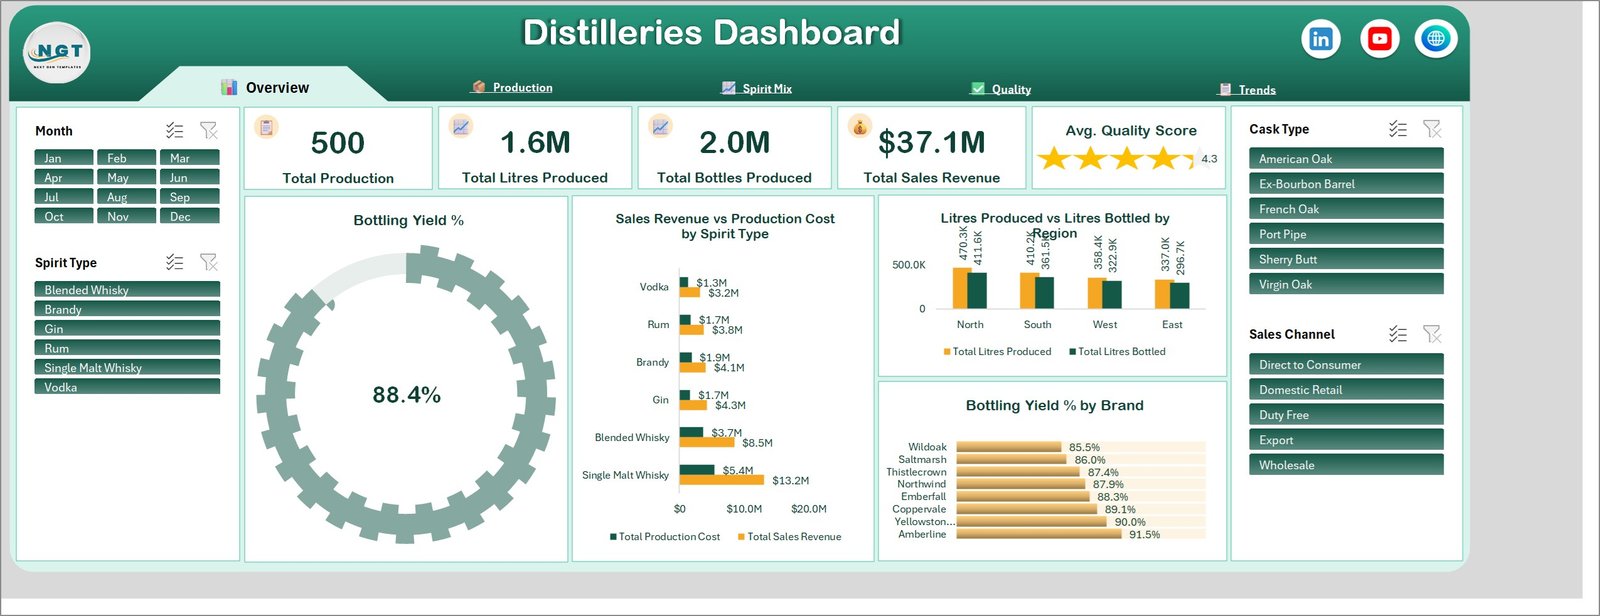
The landing page carries five KPI cards – Total Production (500 batches), Total Litres Produced (1.6M), Total Bottles Produced (2.0M), Total Sales Revenue ($37.1M) and Avg. Quality Score (4.3, shown as stars). Below them sit a Bottling Yield % gauge reading 88.4%, plus Sales Revenue vs Production Cost by Spirit Type, Litres Produced vs Litres Bottled by Region and Bottling Yield % by Brand.
Page 2: Production
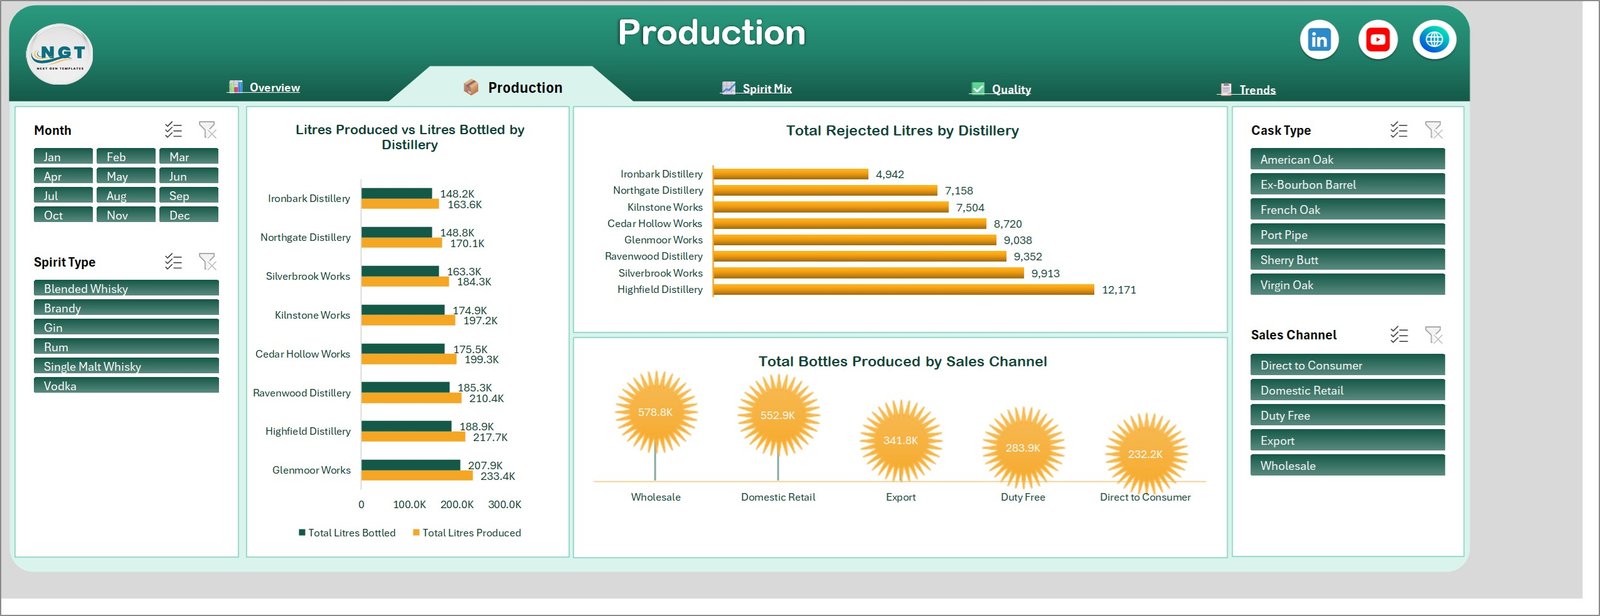
The plant-by-plant view. Litres Produced vs Litres Bottled by Distillery ranks all eight sites, Total Rejected Litres by Distillery exposes where wastage concentrates, and Total Bottles Produced by Sales Channel splits output across Wholesale, Domestic Retail, Export, Duty Free and Direct to Consumer.
Page 3: Spirit Mix
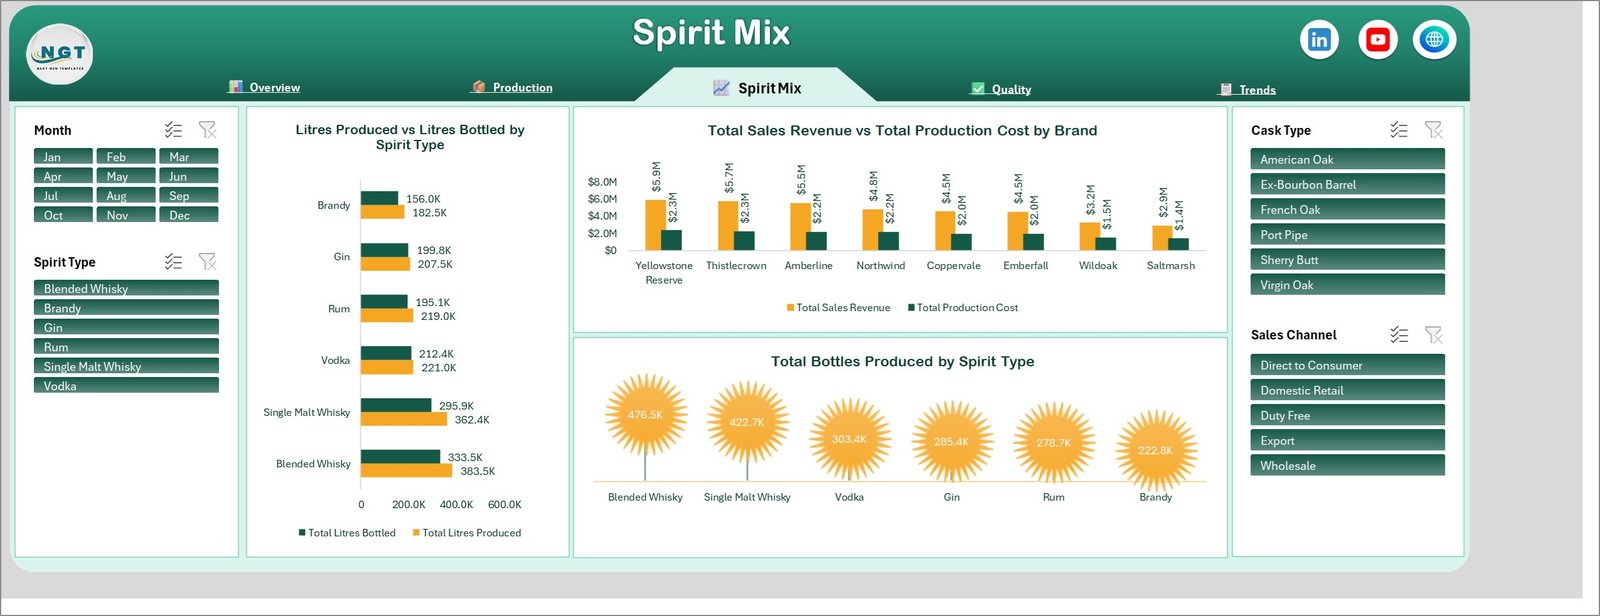
The portfolio view. Litres Produced vs Litres Bottled by Spirit Type covers Blended Whisky, Single Malt Whisky, Vodka, Rum, Gin and Brandy; Total Sales Revenue vs Total Production Cost by Brand ranks all eight brands side by side; and Total Bottles Produced by Spirit Type shows volume share at a glance.
Page 4: Quality
The QC view. Avg. Quality Score by Distillery scores every site on a five-star scale, Avg. Quality Score by Spirit Type compares the six spirits, and Avg. Maturation Months by Cask Type shows how long stock sits in Virgin Oak, Ex-Bourbon Barrel, Sherry Butt, American Oak, French Oak and Port Pipe.
Page 5: Trends
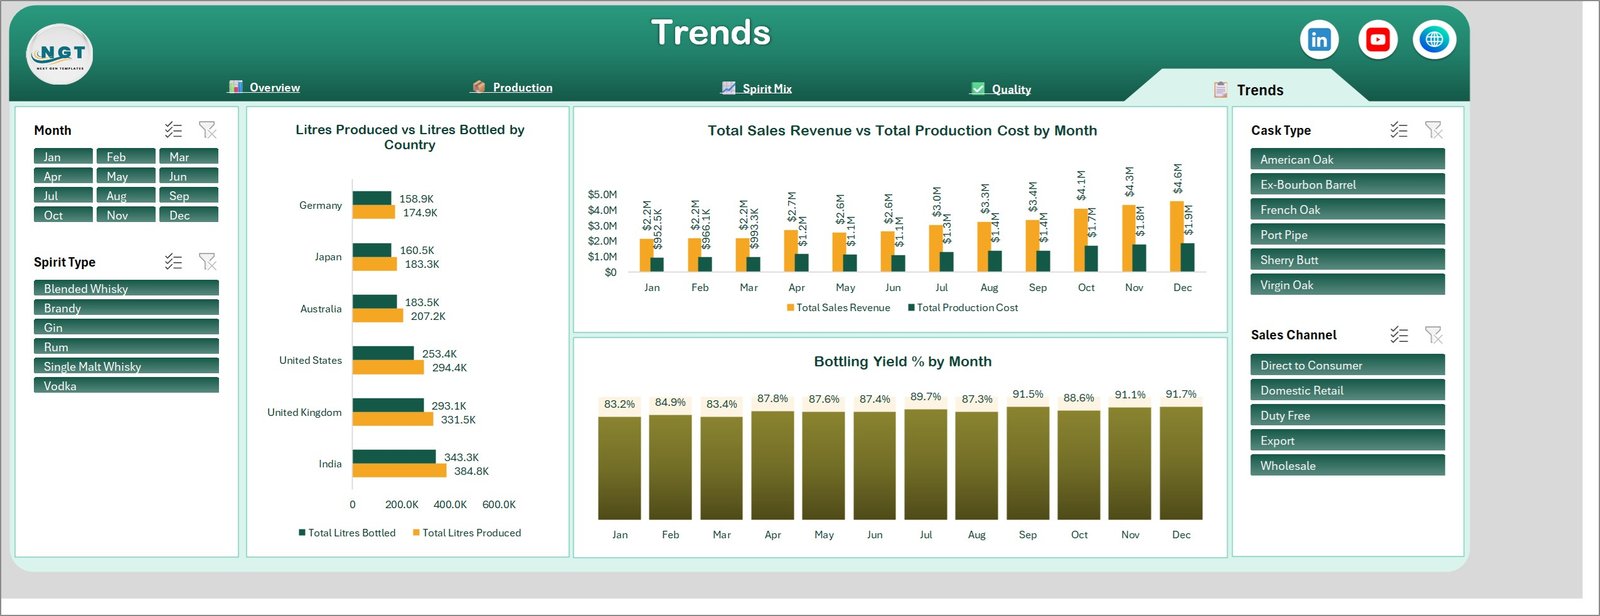
The time and geography view. Litres Produced vs Litres Bottled by Country covers India, the United Kingdom, the United States, Australia, Japan and Germany, while Total Sales Revenue vs Total Production Cost by Month and Bottling Yield % by Month run the full Jan-Dec cycle so seasonality and yield drift show up together.
Data Sheet
500 batch records across 22 fields, laid out as a flat table. Delete the sample rows, paste your own batch log in the same column order, and refresh – the pivot tables and every chart pick it up automatically.
Support Sheet
The 21 pivot tables that drive the charts live here, out of the way of the dashboard pages. You only touch it if you want to add a new chart or change how an existing one aggregates.
📊 Distilleries Dashboard in Excel vs. Google Sheets vs. Paid Distillery ERP – Where This Fits
| Feature | Distilleries Dashboard in Excel | Google Sheets equivalent | Ollie Ops / Vicinity Brew / Crafted ERP |
|---|---|---|---|
| Cost | $17.99 one-time | $0 but built by you | $200-800 / month |
| Platform | Microsoft Excel desktop, works offline | Browser, needs connectivity | Cloud only |
| Setup time | Under 10 minutes | Several days to build | 6-16 week implementation |
| Bottling yield and rejected litres tracking | ✅ Built in, by distillery, brand and month | Build it yourself | ✅ Yes, at a price |
| Cask type and maturation analysis | ✅ Avg. Maturation Months by Cask Type | Build it yourself | ✅ Yes |
| Real-time team collaboration | Via OneDrive / SharePoint | ✅ Native | ✅ Native |
| Mobile access | Excel mobile app (view) | ✅ Browser | ✅ Native app |
| Customizable fields and charts | ✅ Full – it is your workbook | ✅ Yes | Limited without a consultant |
| Year-1 cost at 5 users | $17.99 total | $0 + build time | $2,400-9,600 |
For distillers who want batch, yield, quality and margin reporting without a six-figure ERP rollout, the Distilleries Dashboard in Excel sits in the sweet spot.
👥 Who This Template Is For – and Who It’s Not For
✅ This template is built for:
- Craft and mid-size distillery owners running 1-10 sites who report on batches in spreadsheets today
- Production and bottling managers who need litres produced vs litres bottled and rejected litres in one place
- Brand and commercial managers comparing revenue against production cost across a multi-brand spirits portfolio
- QC leads tracking quality scores and maturation months by cask type
- Consultants and analysts building a beverage-production reporting pack for a client in a day, not a quarter
❌ This template is NOT for:
- Distilleries needing live shop-floor telemetry – this reads a batch log, it does not connect to sensors or a SCADA system
- Teams that need statutory excise filing or bond-warehouse compliance documents generated for them
- Groups that require role-based access control and an audit trail on the data itself – that is an ERP job, not a workbook job
- Anyone without Microsoft Excel on the desktop; the pivot charts and slicers need it
⚙️ How to Use the Distilleries Dashboard in Excel
- Download the ZIP, unzip it, and open Distilleries Dashboard in Excel.xlsx. Click Enable Editing if Excel asks.
- Walk the five pages with the sample data loaded so you can see what each chart is meant to answer.
- Open the Data sheet, delete the 500 sample rows below the header, and paste your own batch records in the same column order.
- Keep the field names as they are – Spirit Type, Cask Type, Sales Channel and Month feed the slicers directly.
- Press Ctrl+Alt+F5, or Data > Refresh All, once. Every pivot table, chart and slicer rebuilds on your numbers.
- Use the four slicers to filter. Selections apply to all five pages at once, so a spirit-type filter follows you from Overview to Trends.
- Recolour, rename or add charts as you like, then save the workbook to OneDrive or SharePoint to share it with your team.
💼 Real-World Use Cases
Ravi runs a three-site gin and rum distillery in Goa. Every Monday he pastes the weekend batch log into the Data sheet and opens the Production page. Litres Produced vs Litres Bottled by Distillery told him one site was losing noticeably more litres than the other two – a cracked filter housing he would have found months later on a paper log.
Claire is commercial director at a Scottish single malt house with eight brands. She lives on the Spirit Mix page, where Total Sales Revenue vs Total Production Cost by Brand ranks the portfolio in one chart. It is how she decided to push two brands into Duty Free and quietly stop promoting a third that was selling volume at almost no margin.
Tom is a QC manager at a contract bottler. He uses the Quality page to keep Avg. Quality Score by Distillery above 4.2 and watches Avg. Maturation Months by Cask Type so stock is not pulled from Virgin Oak early. He exports the page to PDF for the monthly production meeting instead of rebuilding slides.
❓ Frequently Asked Questions
What metrics does the Distilleries Dashboard in Excel track?
The Distilleries Dashboard in Excel tracks ten metrics: Total Production batches, Total Litres Produced, Total Litres Bottled, Total Bottles Produced, Total Rejected Litres, Bottling Yield %, Total Sales Revenue, Total Production Cost, Avg. Quality Score and Avg. Maturation Months. All of them update when you replace the sample data.
How long does setup take?
Under 10 minutes. Open the workbook, clear the 500 sample rows on the Data sheet, paste your own batch log in the same column order, and press Refresh All. The Distilleries Dashboard in Excel rebuilds all 21 pivot tables and 17 charts from your numbers immediately.
Do I need macros, add-ins or a subscription?
No. The Distilleries Dashboard in Excel is a plain .xlsx workbook built on native pivot tables, pivot charts and slicers. There are no macros to enable, no add-ins to install and no recurring fee – it is a one-time purchase with lifetime access.
How does this compare to a paid distillery ERP like Ollie or Vicinity Brew?
A distillery ERP runs roughly $200-800 per month and takes 6-16 weeks to implement. The Distilleries Dashboard in Excel costs $17.99 once and answers the same batch, yield, quality and margin questions. It does not handle inventory transactions or excise filing – it is the reporting layer, not the system of record.
Can I add my own distilleries, brands or spirit types?
Yes. The Distilleries Dashboard in Excel reads whatever values appear in your Data sheet, so new distilleries, brands, cask types or sales channels show up in the charts and slicers automatically after a refresh. No formula editing is required.
Which Excel versions does it work in?
The Distilleries Dashboard in Excel works in Excel 2016, 2019, 2021 and Microsoft 365 on Windows, and in Excel for Mac 2016 and later. Slicer behaviour is best on Windows desktop. Excel for the web can display the pages but will not refresh pivot caches reliably.
Is the sample data real distillery data?
No. The 500 batch records shipped inside the Distilleries Dashboard in Excel are realistic sample data for eight fictional distilleries and eight fictional brands, included so you can see every chart populated before you load your own production log.
👤 About the Author
Built by PK – Microsoft Certified Professional with 15+ years of Excel, Google Sheets and Power BI experience. Founder of NextGenTemplates, reaching 300K+ subscribers across YouTube channels (@PKAnExcelExpert, @NextGenTemplates, @NeoTechNavigators). Every template is hand-built and tested before release.
🔗 Explore Related Templates
This listing is the analytical dashboard for distilleries – five pages of pivot charts across the whole batch log. The KPI dashboards and KPI scorecards below are different products for the same industry, not duplicates:
- Distilleries KPI Dashboard in Excel – the KPI cut of the same industry, with monthly targets and status flags.
- Distillery KPI Scorecard in Excel – a ten-KPI scorecard with twelve months of actuals against target.
- Micro Breweries Pubs Dashboard in Excel – the same analytical layout for the beer side of the business.
- Craft Winery and Vineyard Dashboard in Excel – vineyard, harvest and cellar reporting in the same style.
Also available as: Distilleries KPI Dashboard in Power BI and Distillery KPI Dashboard in Google Sheets for teams standardised on those platforms.
💎 Browse more Excel Dashboard Templates, or step up to the Template Bundles if you need a whole reporting pack in one purchase.
📖 Click here to read the Detailed Blog Post
🎥 Visit our YouTube channel for step-by-step video tutorials
👉 YouTube.com/@NextGenTemplates
Watch the step-by-step video Demo:
📅 Last updated: September 2026
Compatibility and Requirements
- Works in Microsoft Excel desktop (Excel 2016 or later, or Microsoft 365). It is a plain .xlsx workbook with no macros.
- The four slicers (Month, Spirit Type, Cask Type and Sales Channel) filter all five pages at once. Microsoft explains them in Use slicers to filter data.



























Reviews
There are no reviews yet.