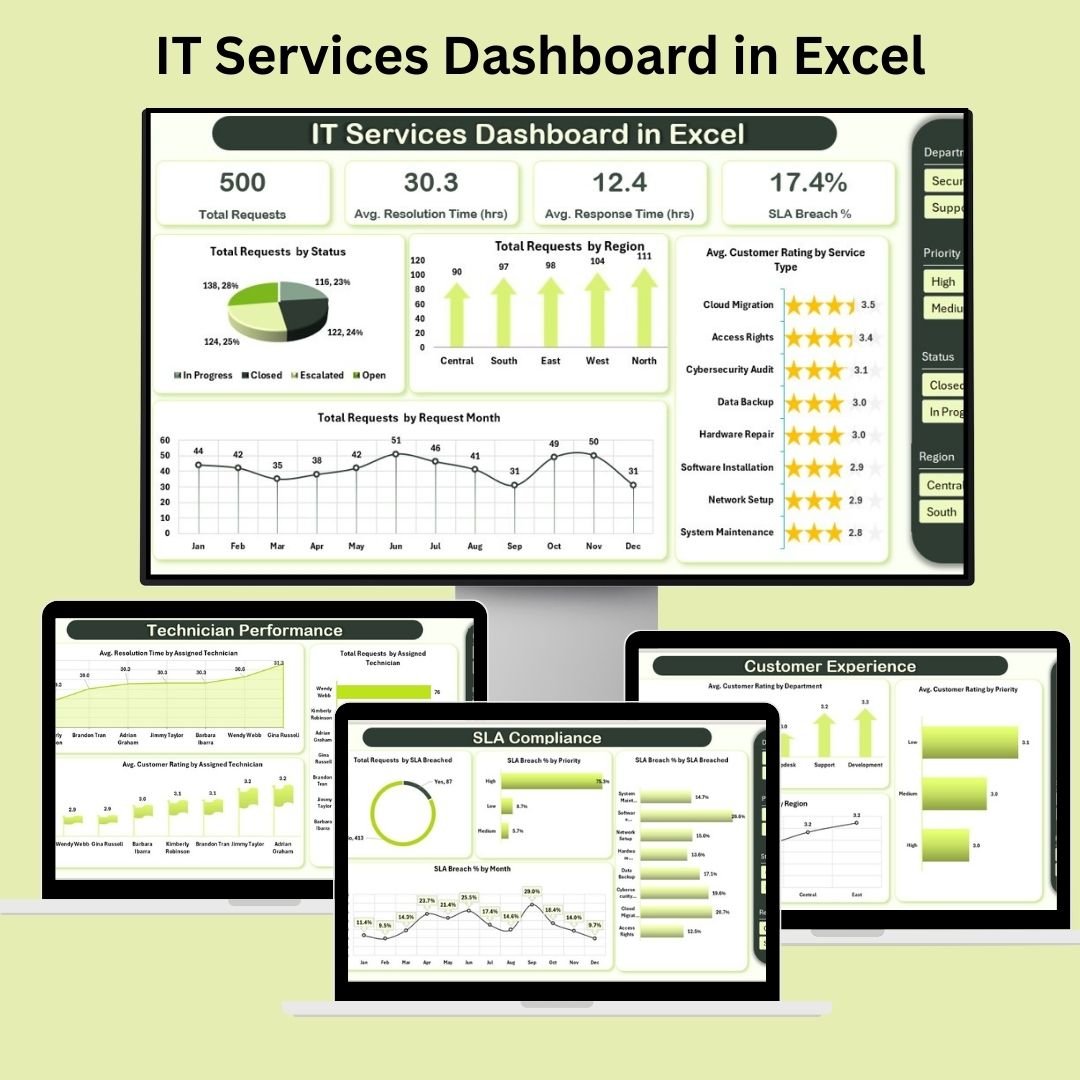
In the digital age, delivering consistent and efficient IT services is no longer optional — it’s essential. The IT Services Dashboard in Excel is a powerful, ready-to-use tracking tool built for IT managers, support teams, and operations leaders who need real-time insights, performance metrics, and visual analytics without relying on expensive software.
Designed with interactive visuals, slicers, KPIs, and categorized reporting sheets, this dashboard enables data-driven decision-making, SLA compliance tracking, and customer satisfaction monitoring — all within the familiar and flexible environment of Excel.
✨ Key Features of the IT Services Dashboard
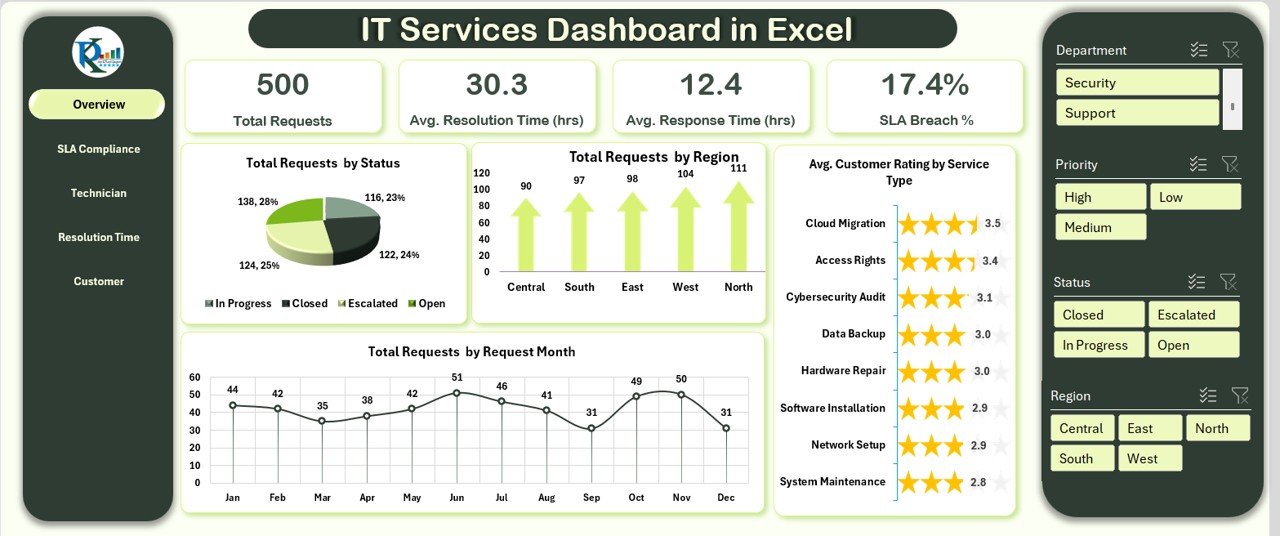
📊 Overview Sheet – At-a-Glance KPIs
-
Total Requests – Track service demand over time
-
Avg. Resolution Time – See how efficiently requests are handled
-
Avg. Response Time – Ensure SLA response time compliance
-
SLA Breach % – Monitor service failures in real-time
Included Charts:
-
📈 Line Chart: Requests by Month
-
📍 Pie Chart: Requests by Status
-
🧭 Arrow Chart: Requests by Region
-
🌟 Star Chart: Customer Ratings by Service Type
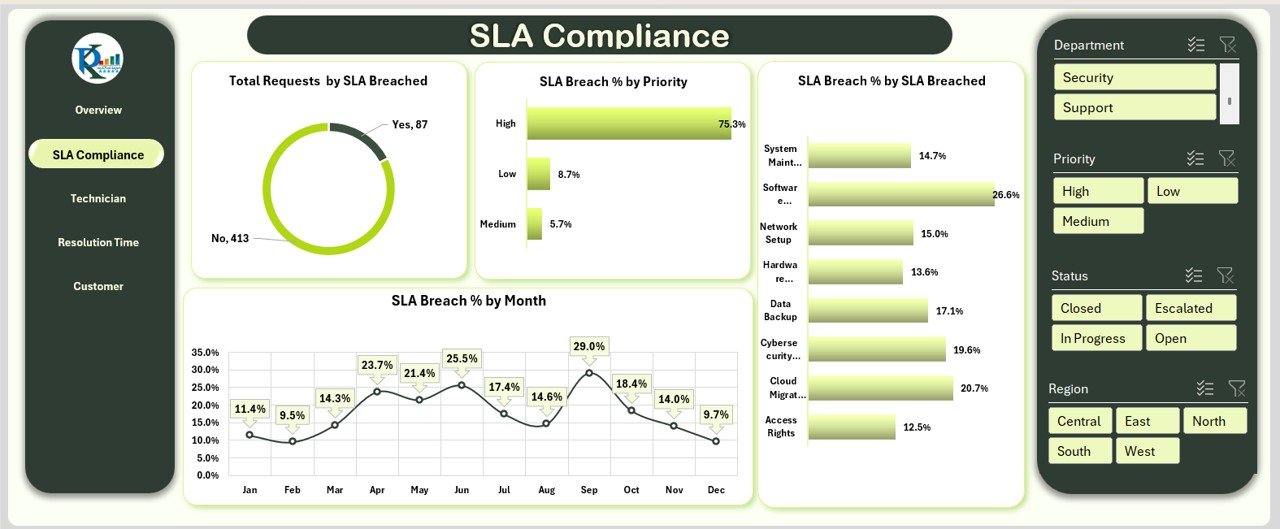
⚖️ SLA Compliance Sheet – Track Service Agreements
-
🎯 Donut Chart: Total Requests by SLA Breached
-
📊 Bar Chart: SLA Breach % by Priority
-
📅 Line Chart: SLA Breaches by Month
-
📍 Bar Chart: SLA Breach % by Type
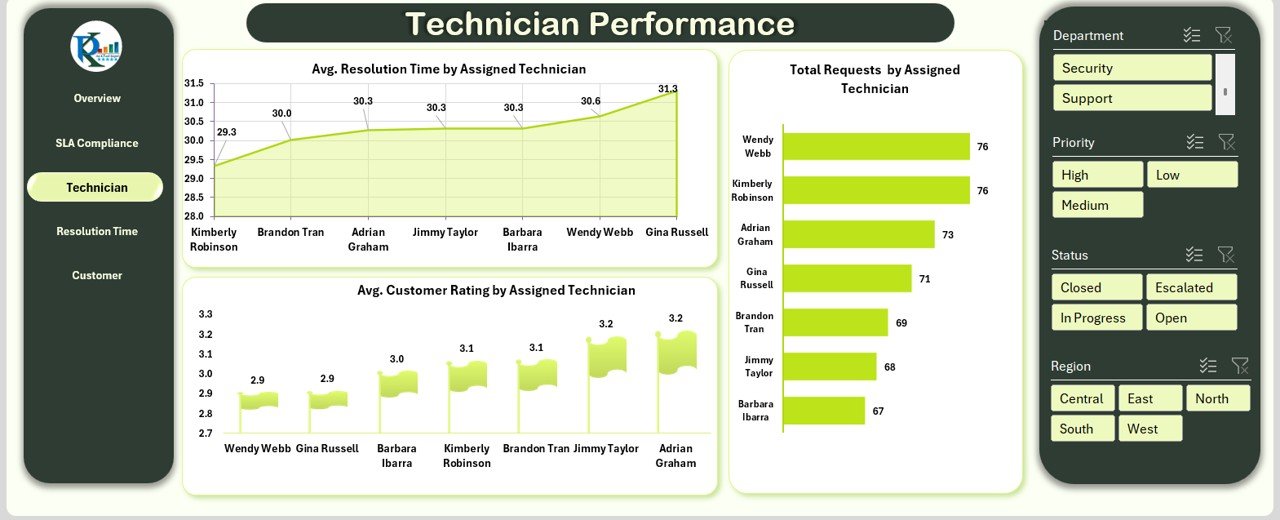
🧑🔧 Technician Performance Sheet – Evaluate Staff Productivity
-
⏱ Area Chart: Avg. Resolution Time by Technician
-
🧮 Bar Chart: Total Requests Handled
-
🏁 Flag Chart: Avg. Customer Ratings by Technician
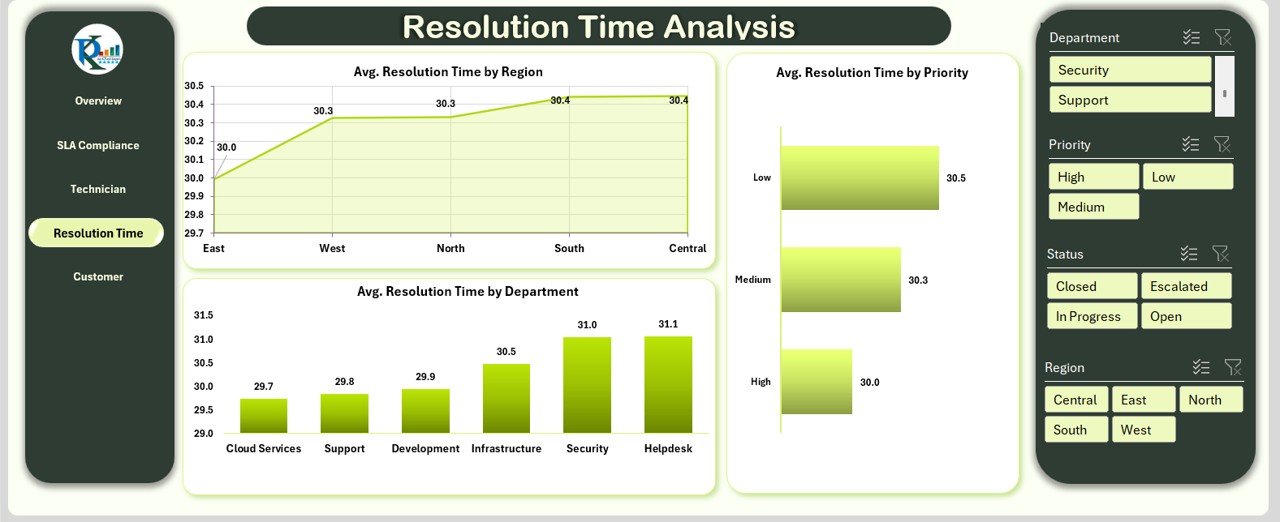
🕒 Resolution Time Analysis – Detailed Performance Breakdown
-
📍 Area Chart: Avg. Resolution Time by Region
-
📊 Bar Chart: By Priority
-
🏢 Column Chart: By Department
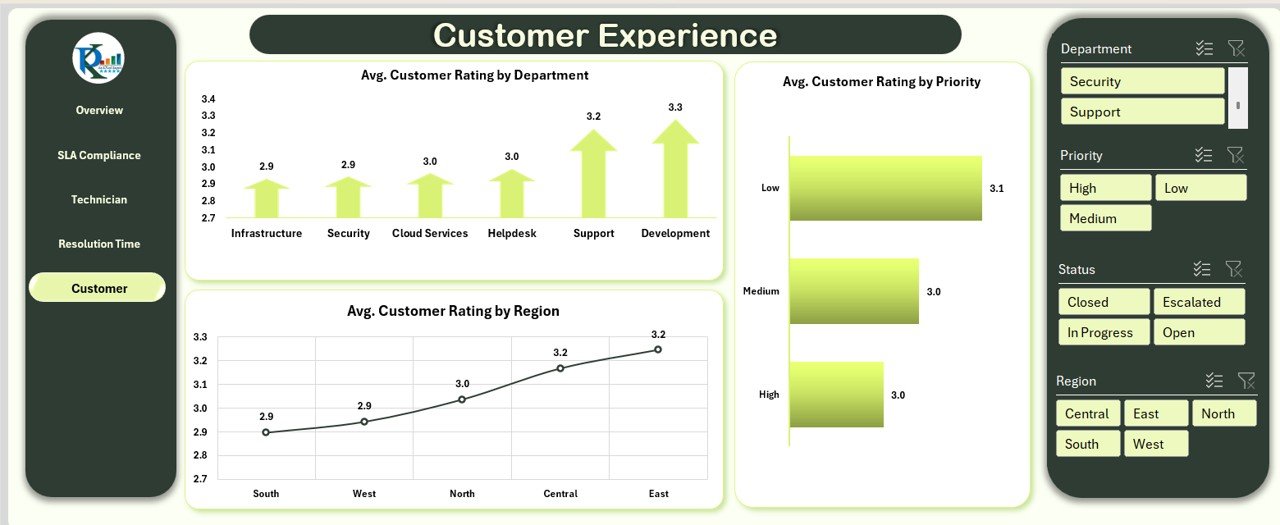
⭐ Customer Experience Sheet – Analyze Satisfaction
-
📈 Line Chart: Ratings by Region
-
📊 Bar Chart: Ratings by Priority
-
🧭 Arrow Chart: Ratings by Department
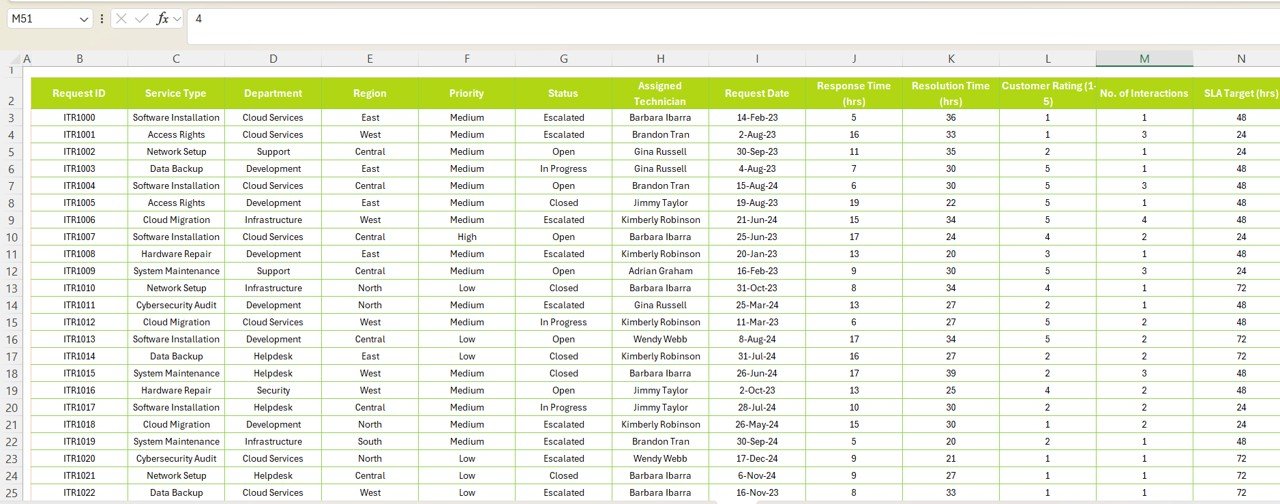
📥 Data Sheet – Centralized Raw Data Input
-
Manual or import-ready entry of all service request details
-
Supports integration and automation with Excel VBA
💼 Who Should Use This Dashboard?
This Excel dashboard is ideal for:
🧑💻 IT Service Managers – Monitor SLA compliance and resolution time
🏢 Support Team Leads – Track technician performance and ticket volumes
📊 Operations & QA Teams – Analyze trends and improve processes
🚀 Startups & Enterprises – Scale your IT performance tracking affordably
🚀 Advantages of the IT Services Dashboard
✅ Comprehensive IT Insights – View everything from requests to satisfaction in one file
📈 Interactive Slicers & Filters – Make analysis dynamic and insightful
📅 Track SLA Breaches Easily – Stay compliant and accountable
🧠 Improve Technician Output – Visualize who’s performing best
🛠 Customizable for Any Org – Add KPIs, regions, or priority levels as needed
💰 No Software Subscription – Save costs with an Excel-based solution
🔁 Reusability – Just update data monthly — dashboard updates automatically
💡 Best Practices for Maximum Impact
📅 Update Data Regularly – Weekly or monthly inputs ensure accurate metrics
📊 Use Slicers for Deep Insights – Drill down by technician, department, or region
🔐 Protect Sheets – Lock formulas to preserve data integrity
📤 Share via OneDrive – Enable collaboration across departments
📚 Train Users – Ensure stakeholders understand KPIs and visual cues
🔁 Click here to read the Detailed blog post
Watch the step-by-step video Demo:


Reviews
There are no reviews yet.