

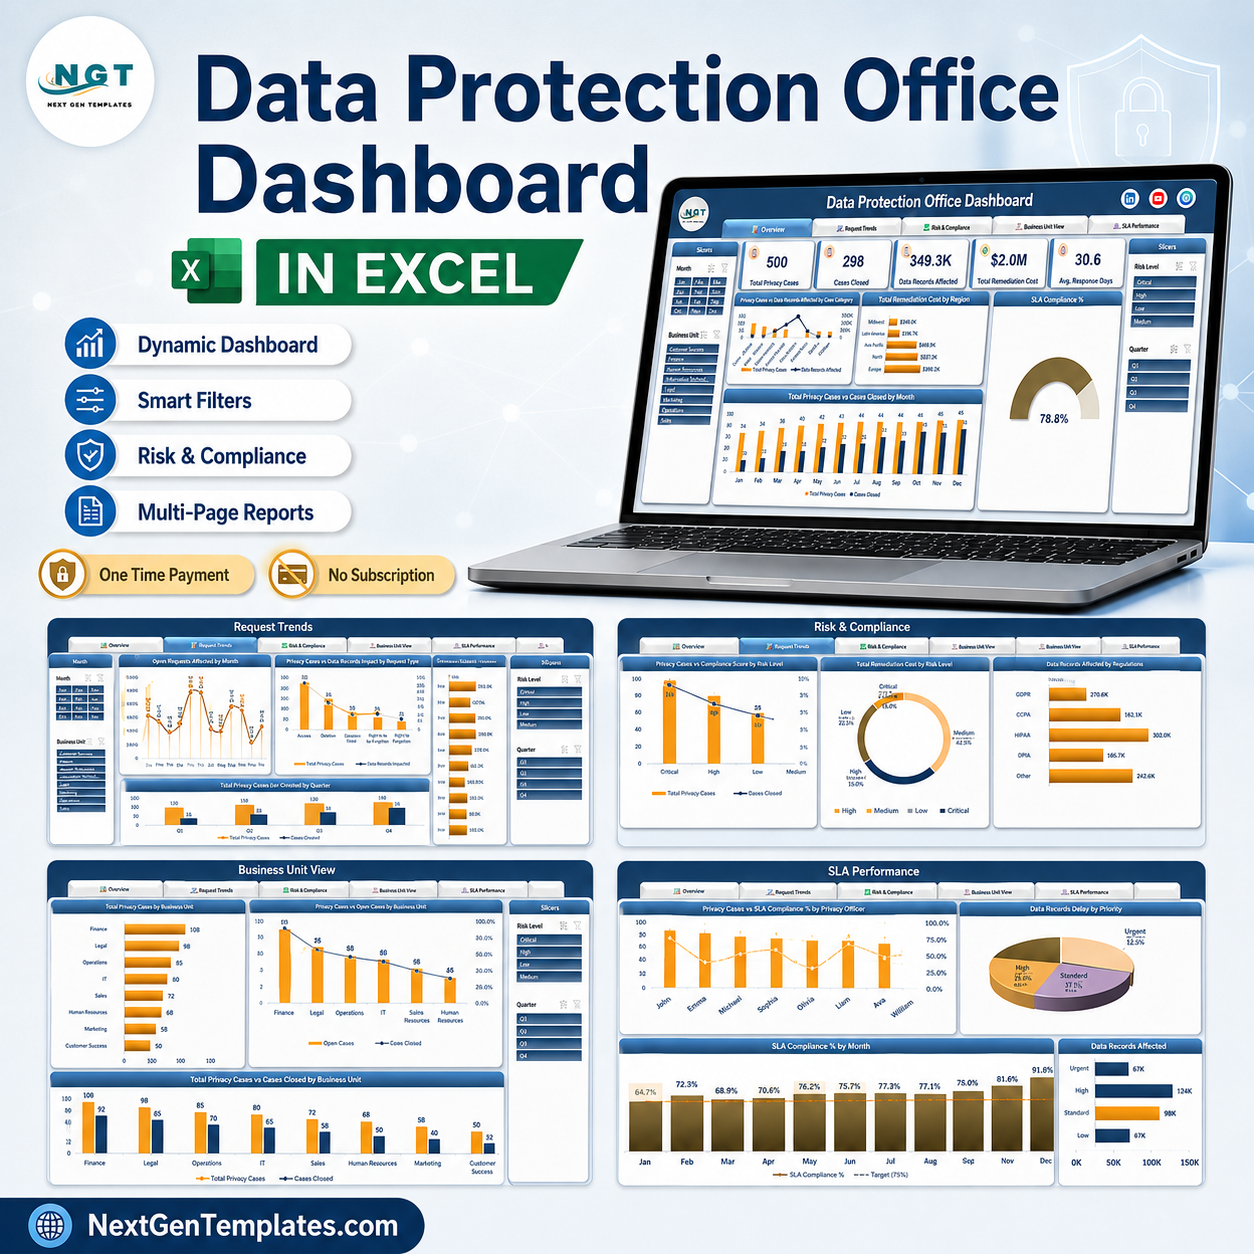

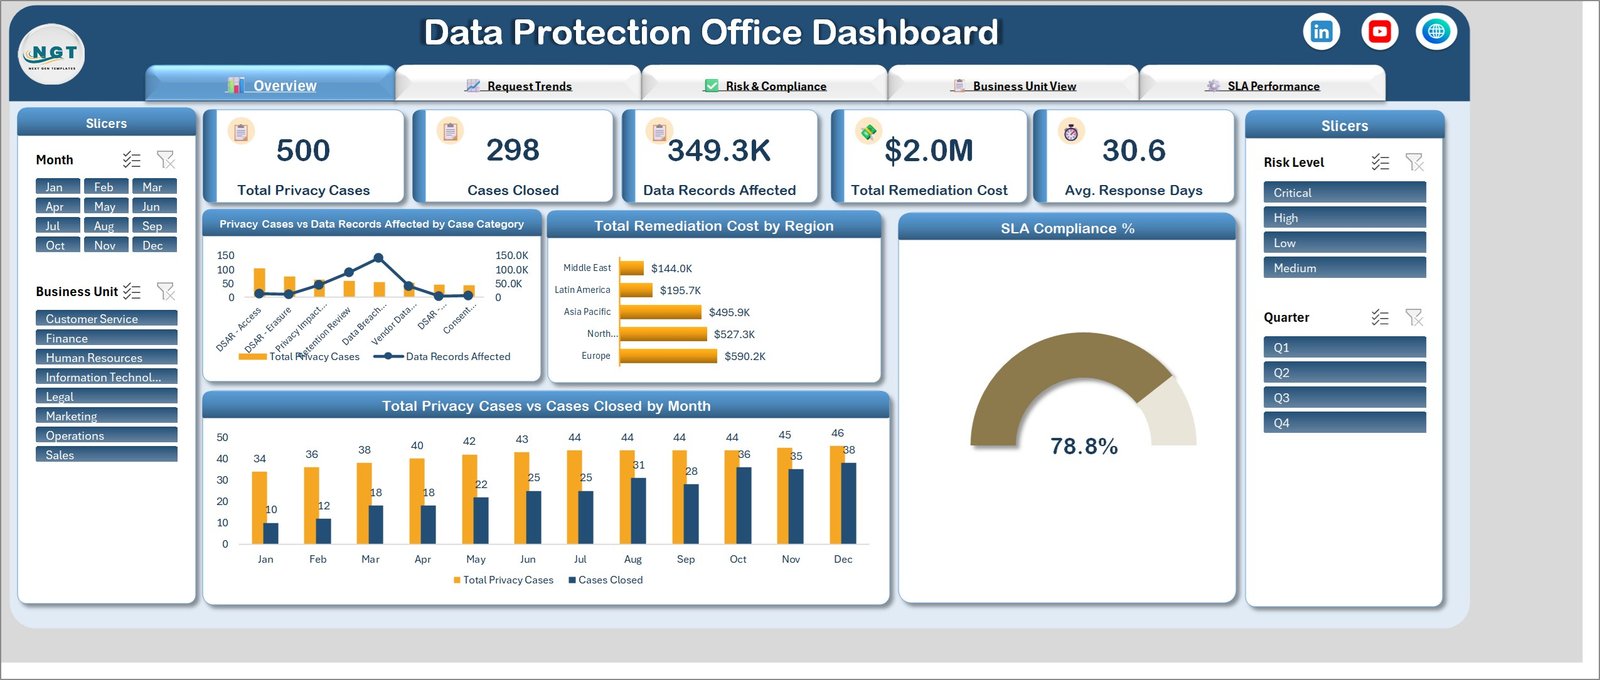
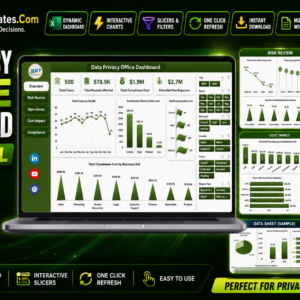
The Data Protection Office Dashboard in Excel turns a privacy team’s casework into a five-page management report. The sample workbook carries 500 privacy cases, 298 closed, 349.3K data records affected, $2.0M in remediation cost and an average response time of 30.6 days against an SLA compliance rate of 78.8%. Every figure is driven by a single data sheet: paste your own DSAR log over the sample rows and all five pages, four slicers and eighteen charts recalculate. No macros, no add-ins, no subscription. One file, one payment, yours to edit forever – and if it does not open and refresh on your machine, we refund it.
Key Features of the Data Protection Office Dashboard in Excel
- Five linked report pages – Overview, Request Trends, Risk & Compliance, Business Unit View and SLA Performance, reached from a tab strip at the top of every sheet.
- Five headline KPI cards – Total Privacy Cases, Cases Closed, Data Records Affected, Total Remediation Cost and Avg. Response Days, all responding to the slicers.
- Four slicers on every page – Month and Business Unit down the left rail, Risk Level and Quarter down the right, so a Q3 Legal view is two clicks away.
- An SLA compliance gauge reading 78.8% in the sample, sitting beside the monthly open-versus-closed column chart.
- Regulation-level reporting across GDPR, CCPA/CPRA, DPDP Act, PIPEDA and LGPD – records affected and average assessment score per regime.
- Intake channel analysis covering Privacy Web Portal, Email, Phone, Postal Mail and Regulator Referral.
- Per-officer caseload for eight named privacy officers, each with their own SLA compliance line.
- Cost analysis four ways – remediation cost by region, by month, by risk level and by business unit.
What’s Inside the Data Protection Office Dashboard in Excel
The Overview page opens with the five KPI cards, then Privacy Cases vs Data Records Affected by Case Category – a combo chart splitting DSAR Access, DSAR Erasure, Privacy Impact Review, Retention Review, Data Breach, Vendor Data and Consent work. Beside it, Total Remediation Cost by Region ranks Europe at $590.2K, North America at $527.3K, Asia Pacific at $495.9K, Latin America at $195.7K and the Middle East at $144.0K. A monthly Total Privacy Cases vs Cases Closed column chart runs along the bottom, showing intake climbing from 34 in January to 46 in December while closures climb faster, from 10 to 38.
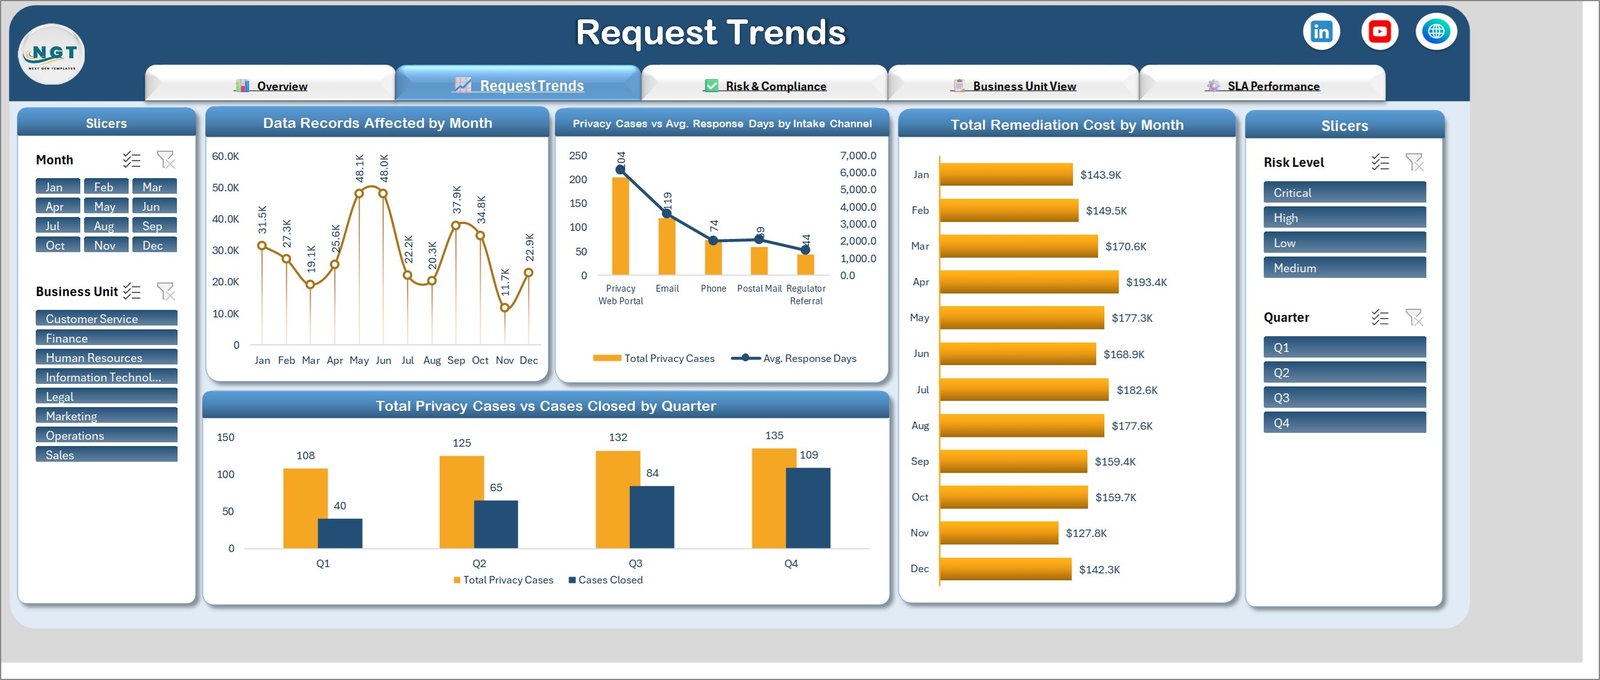
Request Trends plots Data Records Affected by Month, peaking at 48.1K in May, and Privacy Cases vs Avg. Response Days by Intake Channel, where the Privacy Web Portal carries 204 of the 500 cases against 119 from Email and 44 from Regulator Referral. Total Remediation Cost by Month and Total Privacy Cases vs Cases Closed by Quarter complete the page – the quarterly view is the one that shows the backlog closing, from 108 raised against 40 closed in Q1 to 135 against 109 in Q4.
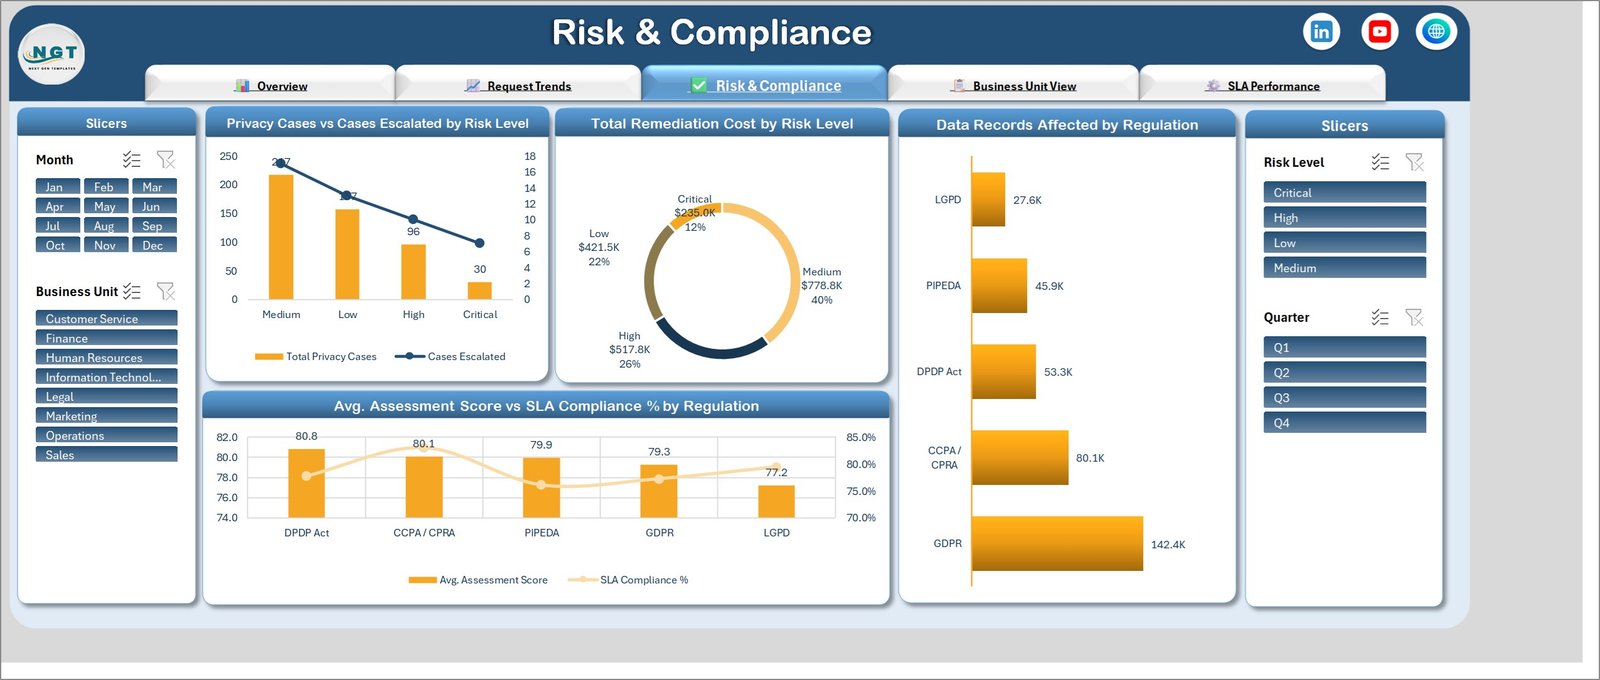
Risk & Compliance is the regulator-facing page. Privacy Cases vs Cases Escalated by Risk Level puts 217 cases at Medium, 157 at Low, 96 at High and 30 at Critical. A donut breaks the $2.0M remediation spend into Medium $778.8K (40%), High $517.8K (26%), Low $421.5K (22%) and Critical $235.0K (12%). Data Records Affected by Regulation shows GDPR dominating at 142.4K records, ahead of CCPA/CPRA at 80.1K, DPDP Act at 53.3K, PIPEDA at 45.9K and LGPD at 27.6K, and Avg. Assessment Score vs SLA Compliance % by Regulation pairs each regime’s score – 80.8 for DPDP Act down to 77.2 for LGPD – with its SLA rate.
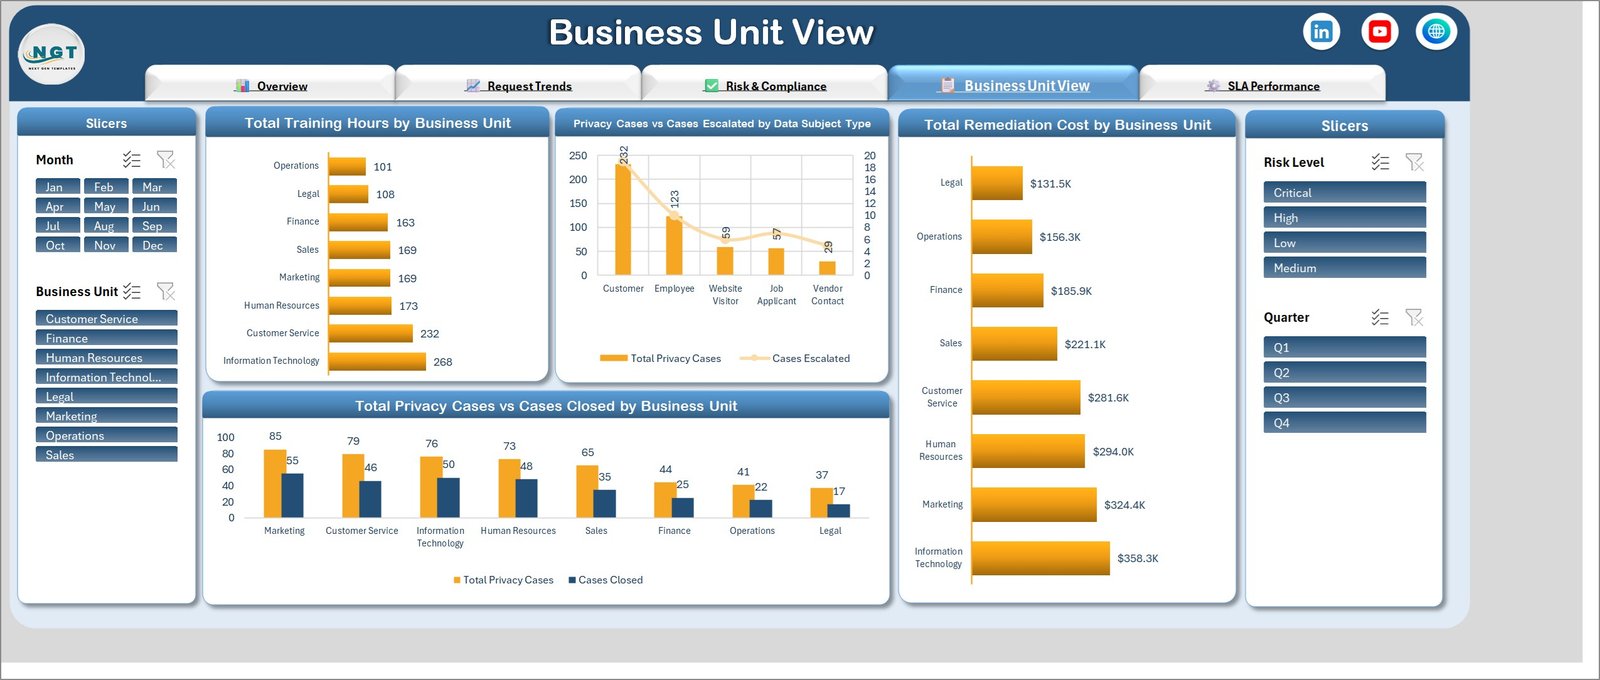
Business Unit View answers the awkward internal question. Total Training Hours by Business Unit runs from Information Technology at 268 hours down to Operations at 101. Privacy Cases vs Cases Escalated by Data Subject Type separates Customer (232), Employee (123), Website Visitor (59), Job Applicant (57) and Vendor Contact (29). Total Remediation Cost by Business Unit puts IT top at $358.3K and Legal bottom at $131.5K, while the closing chart pairs cases raised against cases closed per unit – Marketing 85 against 55, Legal 37 against 17.
SLA Performance closes the pack with per-officer caseload and compliance for eight privacy officers, an Avg. Response Days by Priority pie (Urgent 39.5 days, Standard 30.6, Low 29.0, High 28.4), a status view covering Closed, Pending Review, In Progress, Escalated and Withdrawn cases with average cost each, and SLA Compliance % by Month climbing from 64.7% in January to 97.8% in December.
Excel vs. Google Sheets vs. Paid Privacy Management SaaS – Where This Fits
| Criterion | This Excel Dashboard | Google Sheets equivalent | OneTrust / TrustArc |
|---|---|---|---|
| Cost | $17.99 once | $9.99-$16.99 once | $15,000+ per year |
| Platform | Excel 2016 or later, Microsoft 365 | Browser | Vendor cloud |
| Setup time | 15 minutes | 10 minutes | 6-12 week implementation |
| Real-time team collaboration | Via OneDrive or SharePoint co-authoring | Native | Native |
| Mobile access | Excel mobile app | Browser and app | Native app |
| Customisable fields | Full – it is your workbook | Full | Vendor-configured |
| Share with a link | OneDrive link | Sheet link | Seat-based login |
| Year-1 cost at 5 users | $17.99 | $16.99 | $15,000-$60,000 |
| Automated DSAR intake workflow | No – you log cases | No | Yes |
| Case data leaves your tenancy | No | Yes (Google) | Yes (vendor) |
Browse the rest of the Excel dashboard range or the wider MS Excel library if a different report shape suits you better.
Who This Template Is For – and Who It’s Not For
It is for a Data Protection Officer or privacy lead at a company handling a few hundred to a few thousand requests a year; a compliance manager who has to show a board or a supervisory authority that DSARs are being met on time; a consultant running the privacy function for several clients; an in-house legal team that already keeps a case log in a spreadsheet and needs it to report.
It is not for an organisation that needs automated DSAR intake with identity verification and consent capture – buy OneTrust. It is not a records-of-processing register, and it is not a breach-notification workflow with statutory clocks running against each case. It also will not help if your case log lives only inside a ticketing system nobody exports; the dashboard needs its rows pasted into the Data sheet.
How to Use the Data Protection Office Dashboard in Excel
- Unzip the download and open the workbook in Microsoft Excel. Enable editing.
- Open the Data sheet and study the sample rows – case category, intake channel, regulation, risk level, business unit, data subject type, privacy officer, status, priority, dates, records affected and remediation cost.
- Replace the sample rows with your own export. Keep the column order and the existing dropdown values.
- Press Ctrl+Alt+F5 to refresh, or right-click any pivot and choose Refresh.
- Click through the five page tabs and use the Month, Business Unit, Risk Level and Quarter slicers to reach the view you want.
- Print or export a page to PDF for your monthly privacy report.
Real-World Use Cases
Priya, DPO at a 900-person fintech. Her board asks one question every quarter: are we meeting the statutory response window? She filters to Q4, screenshots the SLA Compliance % by Month chart showing 97.8% in December, and the conversation ends in two minutes instead of twenty.
Marcus, privacy consultant. He keeps one copy of the workbook per client. The Business Unit View page is what he uses in the kick-off meeting – showing a client that Marketing raised 85 cases and closed 55 while Legal raised 37 and closed 17 makes the resourcing argument for him.
Anna, compliance manager at a retail group. She uses the regulation view to justify budget: GDPR touches 142.4K records against 27.6K for LGPD, so the European privacy programme gets the headcount.
Frequently Asked Questions
Which Excel versions does it work in?
Excel 2016, 2019, 2021 and Microsoft 365 on Windows. It uses pivot tables, slicers and standard chart types, so it opens on Excel for Mac too, though slicer styling can differ slightly.
Does it need macros?
No. It is a plain .xlsx workbook with no VBA, so it opens without security warnings and passes IT policies that block macro-enabled files.
Can I add my own case categories or regulations?
Yes. Add the value in the Data sheet, refresh, and it appears in the charts and slicers automatically – the same is true of new business units and privacy officers.
How many cases can it hold?
The sample carries 500. Excel’s pivot engine handles tens of thousands of rows comfortably; performance only becomes noticeable past roughly 100,000.
Can I rebrand it?
Yes – the header band, logo and colour scheme are ordinary Excel objects. Replace the logo and recolour the theme to match your company.
Is my case data sent anywhere?
No. The workbook has no external connections. It reads only its own Data sheet, which matters when the data is a privacy case log.
What exactly do I receive?
A zip file containing the Excel workbook with all five report pages, the sample data sheet and every chart already built.
About the Author
Built by PK – Microsoft Certified Professional with 15+ years of Excel, Google Sheets, and Power BI experience. Founder of NextGenTemplates, reaching 300K+ subscribers across YouTube channels. Every template is hand-built and tested before release.
Explore Related Templates
- Compliance Monitoring Dashboard in Excel – the wider control-testing view that sits above privacy casework.
- Corporate Ethics Office Dashboard in Excel – the same office-level reporting shape for whistleblowing and ethics cases.
- Risk Assessment Firms Dashboard in Power BI – if you would rather publish to the Power BI service.
- Cybersecurity Dashboard in Google Sheets – the security-incident counterpart, browser-based.
- IT Manager & CISO Toolkit – ten templates including this reporting family, at a bundle price.
Buy the Data Protection Office Dashboard in Excel once for $17.99 and stop rebuilding the same privacy report every month. Download instantly, edit freely, keep it forever.
Last updated: 27 August 2026.





















Reviews
There are no reviews yet.