

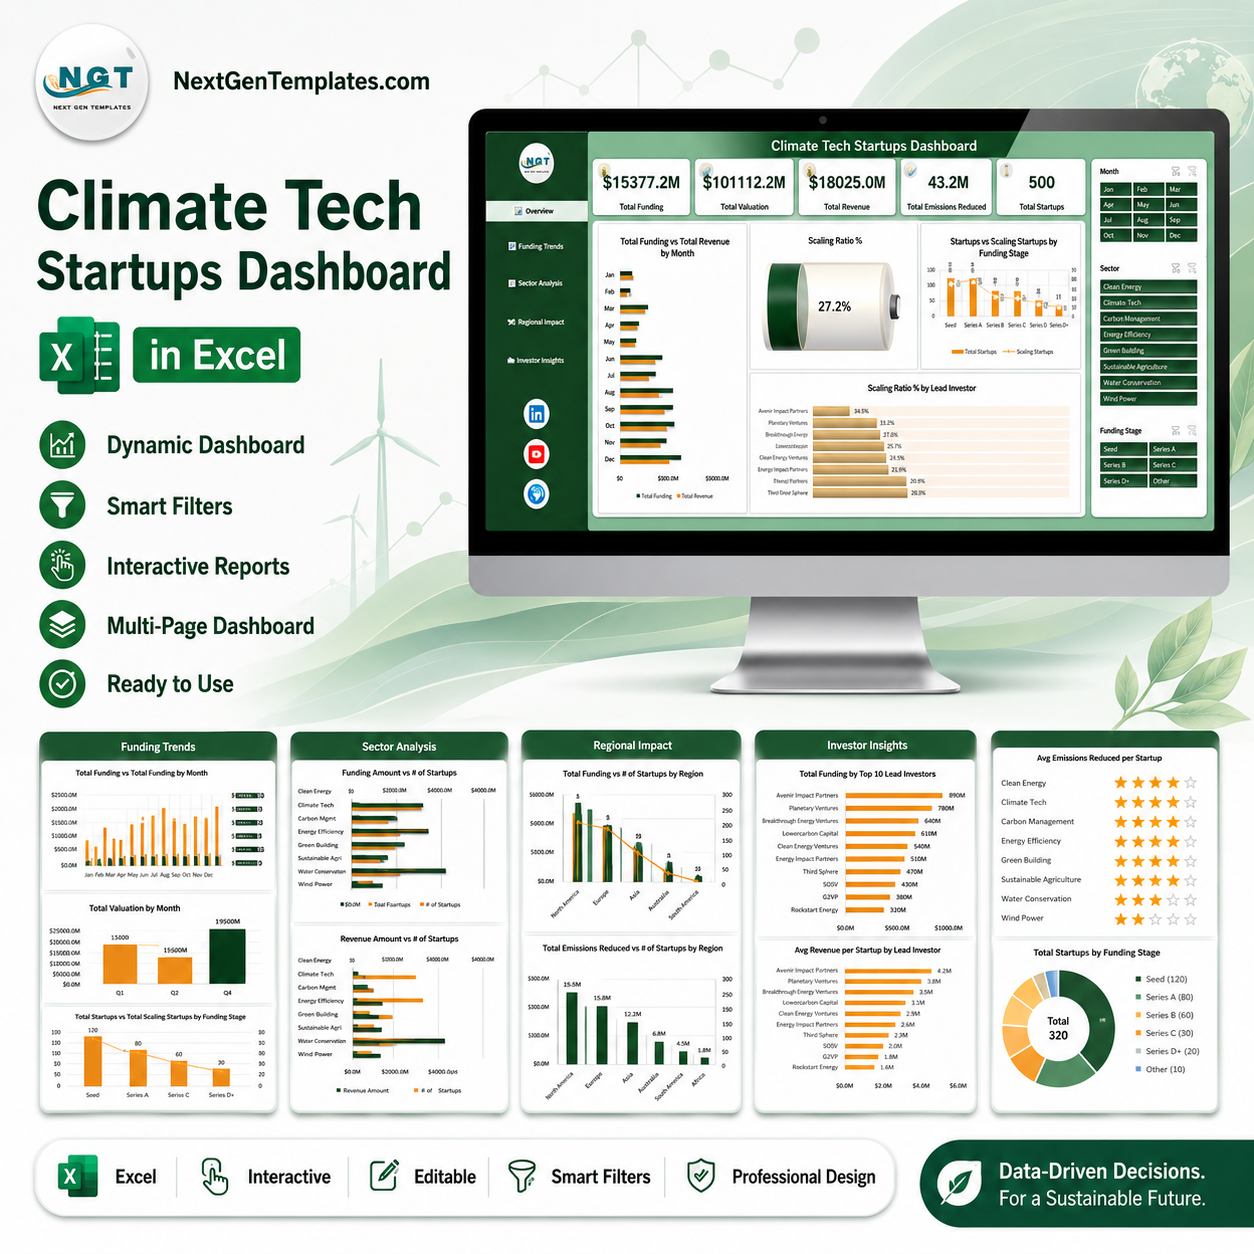
Climate Tech Startups Dashboard in Excel is a finished reporting workbook for anyone who keeps a list of climate tech or clean tech companies and has to report on it. Portfolio managers, accelerator and incubator programme leads, ecosystem and market researchers, and internal corporate venture teams all end up building the same spreadsheet from scratch every quarter. This template is that spreadsheet, already built.
You maintain one flat data table — one row per company record, with columns for sector, funding stage, region, country, lead investor, funding, valuation, revenue, operating cost, employees and the other fields the workbook charts. Everything else is downstream. Five dashboard pages, their KPI cards, their pivot tables and every chart refresh from that single table, so updating the report means pasting a new export and hitting refresh.
The download arrives populated with 500 rows of demo data. Those rows — including the investor names, company counts and every currency figure you see in the screenshots — are invented sample records supplied purely so the pages render on first open. Delete them and paste your own.
What this template is, and what it is not
This is a reporting and presentation tool for numbers you already hold. It is worth being precise about that, because the subject matter invites assumptions:
- The workbook does not measure, calculate, estimate, audit or verify emissions. The Total Emissions Reduced KPI and the charts built on it simply add up a column that you type in. If you enter a figure, the dashboard displays it; it has no idea whether that figure is right.
- It is not a carbon accounting tool and makes no claim of alignment with the GHG Protocol, SBTi, CSRD, TCFD, ISSB or any other framework, standard or reporting regime.
- It says nothing about carbon credits, offsets or their quality or validity.
- It does not evaluate an investment, score a company, or produce any form of investment advice or recommendation. The Avg. Investor Rating field is a label you assign yourself, not an assessment the workbook performs.
- It performs no environmental impact assessment of any kind.
What it does is take a company list and turn it into a clean, filterable, presentation-ready set of pages in Excel.
Key features
- Five linked dashboard pages — Overview, Funding Trends, Sector Analysis, Regional Impact and Investor Insights, each with a left navigation rail that jumps between them.
- Five KPI cards on the Overview page: Total Funding, Total Valuation, Total Revenue, Total Emissions Reduced and Total Startups, all recalculated live as slicers change.
- Page-synced slicers for Month, Sector and Funding Stage. Click Green Hydrogen on one page and every chart on every page follows.
- Pivot-driven charts throughout — combination column-and-line charts, clustered bars, a gauge, percentage bars and a star-rating panel. No volatile array formulas, no hand-maintained helper ranges.
- One data table drives everything. Add rows, refresh, done.
- Eight sector categories pre-wired: Battery Storage, Carbon Capture, Circular Economy, EV Infrastructure, Green Hydrogen, Solar Energy, Sustainable Agriculture and Wind Power. All are editable text — rename them to your own taxonomy.
- Six funding stages (Pre-Seed, Seed, Series A, Series B, Series C, Growth), five regions, four business models (B2B, B2G, B2B2C, B2C) and three funding bands, all defined in the data rather than hard-coded.
- No macros and no add-ins. A plain .xlsx workbook that opens in Excel 2016, 2019, 2021, 2024 and Microsoft 365 on Windows or Mac.
- Unlimited re-use for your own reporting, and a fully editable layout — colours, titles, KPI labels and chart types are all yours to change.
The five pages, one by one
1. Overview
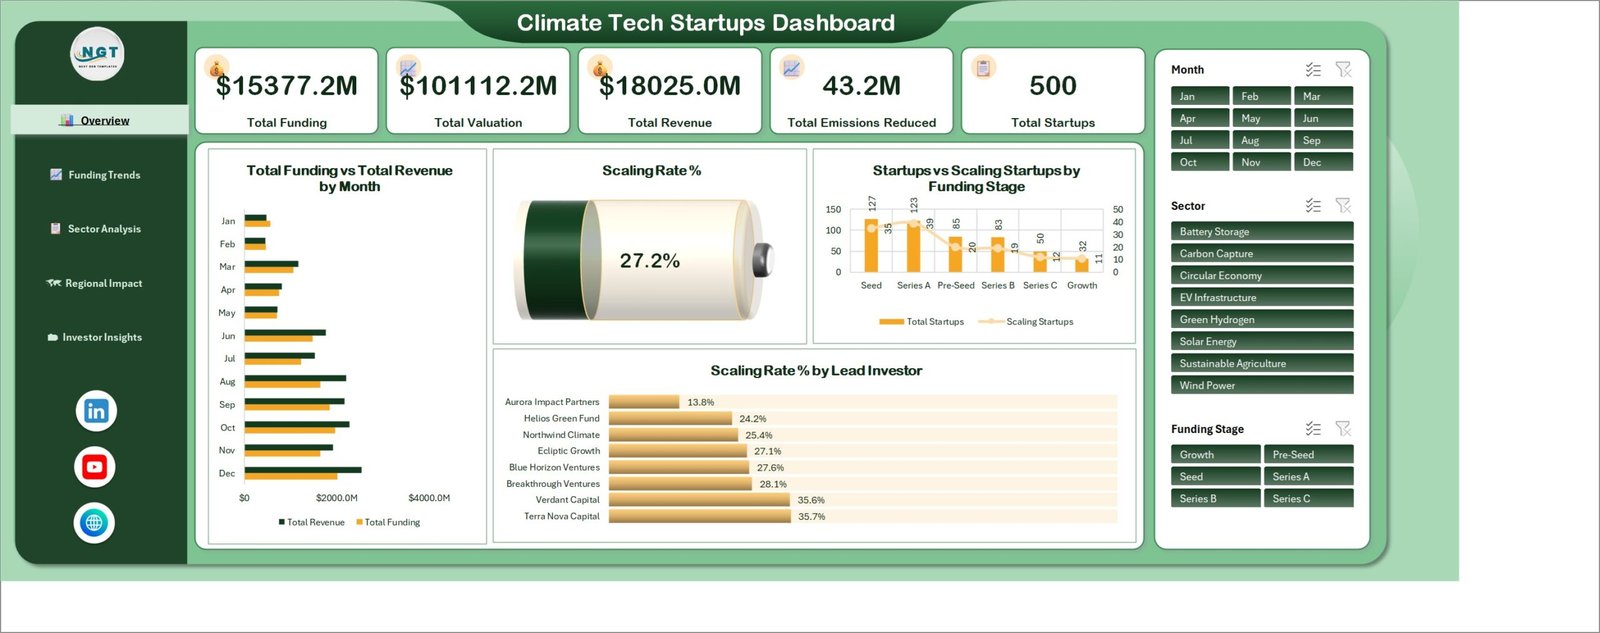
The summary page a stakeholder sees first. Five KPI cards run across the top, followed by Total Funding vs Total Revenue by Month as a paired horizontal bar chart, a gauge showing the overall Scaling Rate %, Startups vs Scaling Startups by Funding Stage as a column-and-line combination, and Scaling Rate % by Lead Investor as a ranked percentage bar. In the demo data the overall scaling rate reads 27.2% across 500 sample companies.
2. Funding Trends
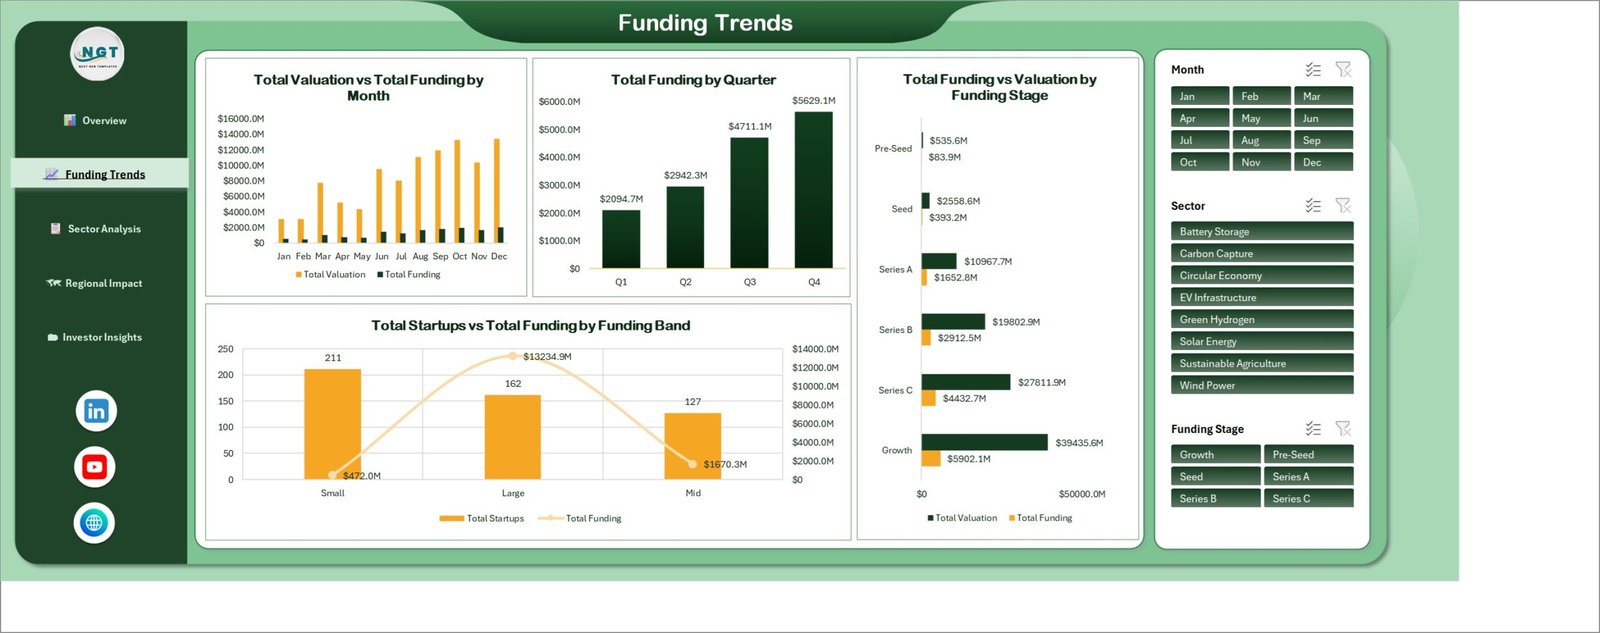
Where the money moved. Total Valuation vs Total Funding by Month puts the two side by side across the year, Total Funding by Quarter reduces that to four columns for a board slide, Total Funding vs Valuation by Funding Stage compares the two measures from Pre-Seed through Growth, and Total Startups vs Total Funding by Funding Band pairs company counts against total funding for Small, Mid and Large bands.
3. Sector Analysis
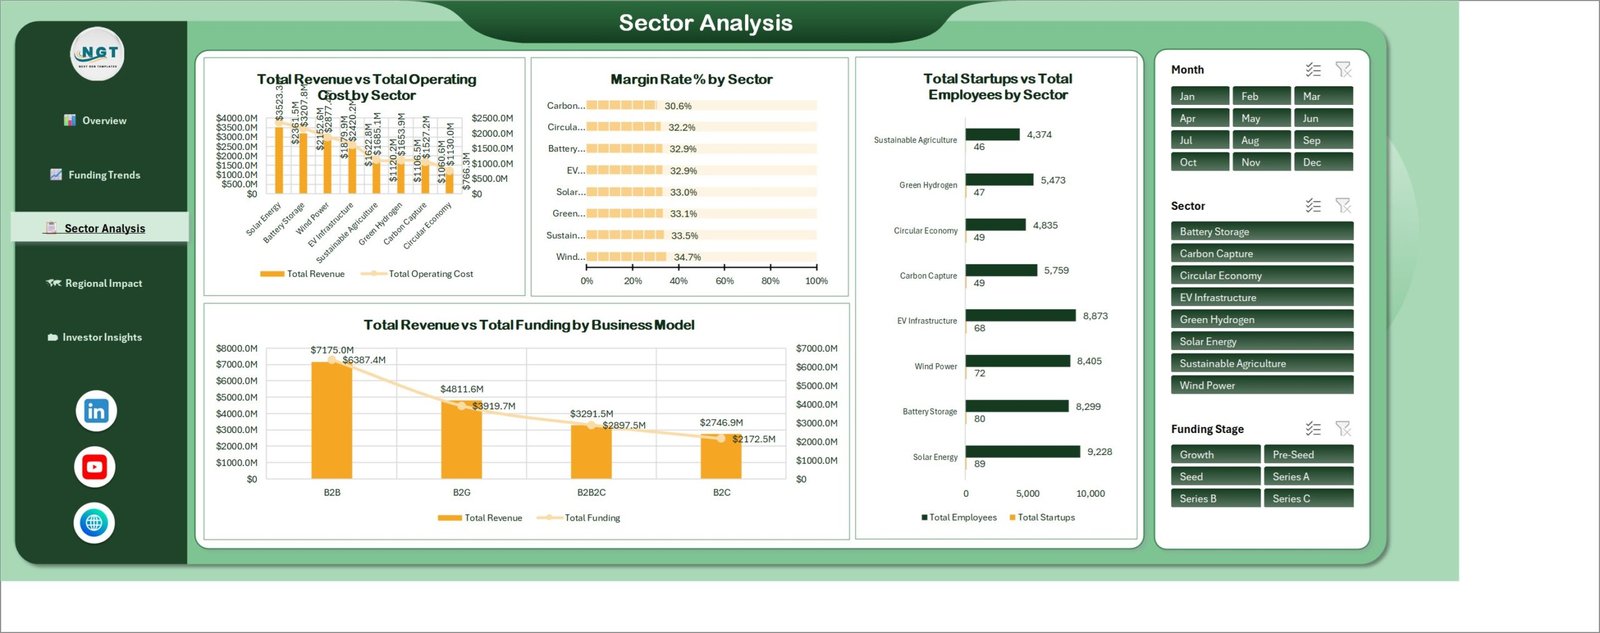
Which parts of the portfolio carry the weight. Total Revenue vs Total Operating Cost by Sector pairs the two measures across all eight sectors, Margin Rate % by Sector ranks them as percentage bars, Total Startups vs Total Employees by Sector shows headcount against company count, and Total Revenue vs Total Funding by Business Model splits the same numbers by B2B, B2G, B2B2C and B2C.
4. Regional Impact
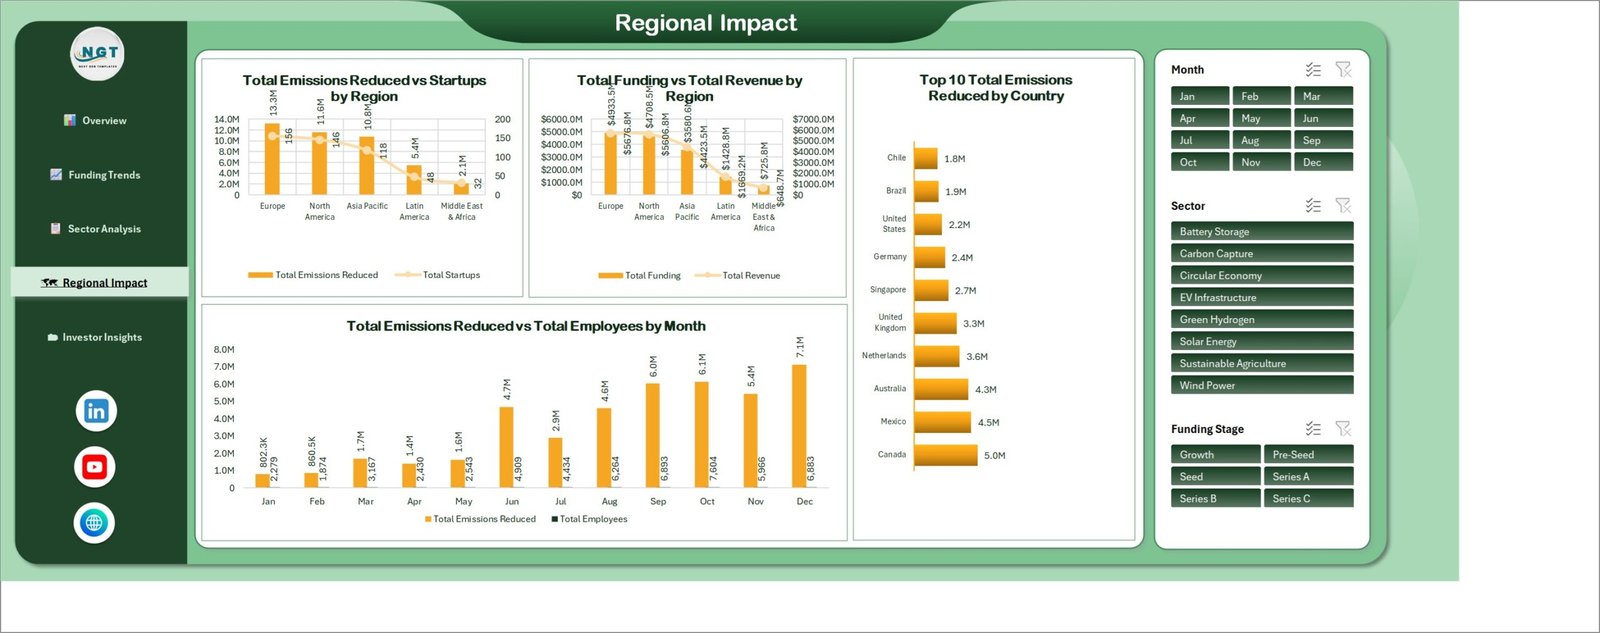
The geographic cut. Total Emissions Reduced vs Startups by Region and Total Funding vs Total Revenue by Region cover the five regions, Top 10 Total Emissions Reduced by Country ranks countries as a horizontal bar, and Total Emissions Reduced vs Total Employees by Month tracks the same measure through the year.
Read the emissions figures on this page for what they are: totals of a number entered in the data table. The workbook does not derive, model or verify them, and it applies no emissions methodology whatsoever. If the column is empty in your data, these charts sit empty.
5. Investor Insights
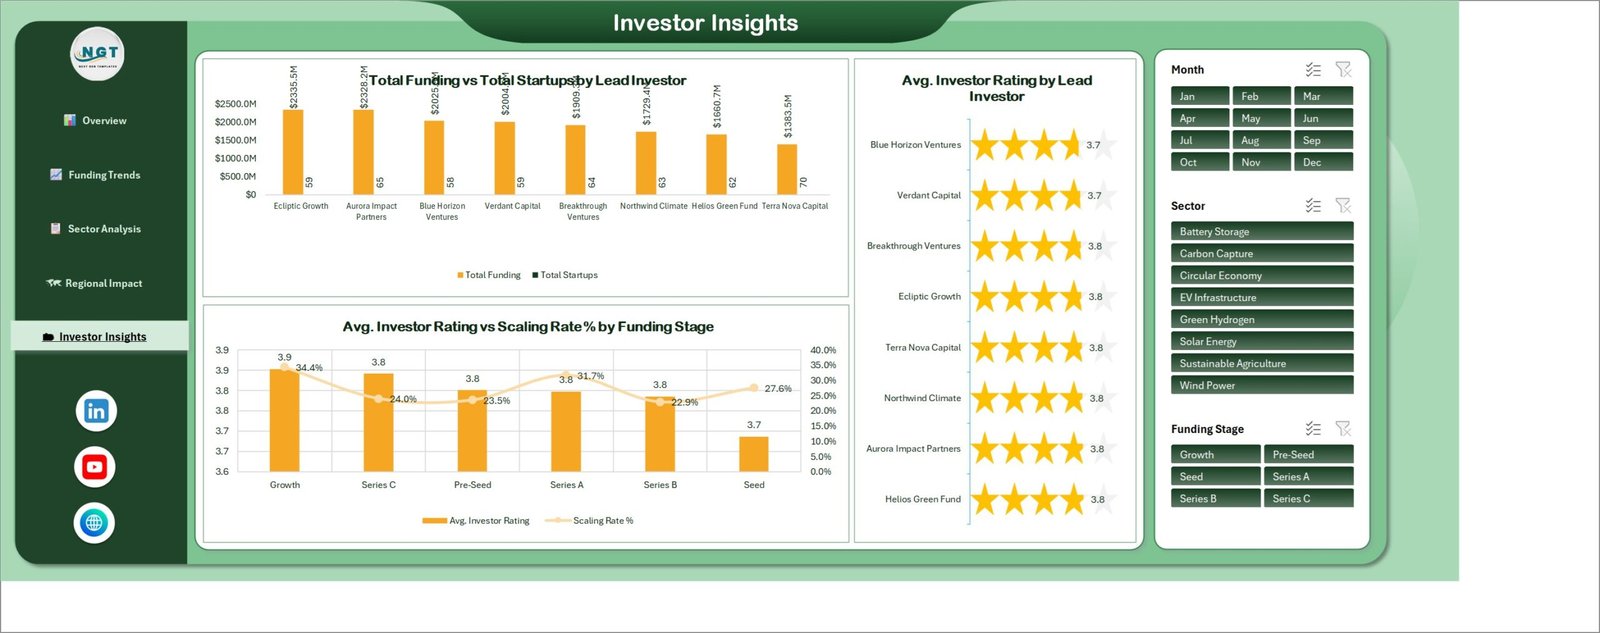
The lead-investor view. Total Funding vs Total Startups by Lead Investor ranks investors by funding with company counts alongside, a star panel shows Avg. Investor Rating by Lead Investor, and Avg. Investor Rating vs Scaling Rate % by Funding Stage puts the rating next to the scaling rate from Pre-Seed to Growth. The rating is a score you enter yourself — the workbook averages whatever you typed and does not assess any investor. The eight investor names in the demo data are fictional.
How it compares to the alternatives
| This template | Building it yourself | A portfolio SaaS platform | |
|---|---|---|---|
| Time to a first report | Minutes — paste and refresh | Days of layout, pivots and chart formatting | Weeks of onboarding and data mapping |
| Cost | One-off purchase | Your time | Recurring per-seat subscription |
| Where the data lives | Your own file, on your own machine | Your own file | A vendor’s servers |
| Editable layout | Fully — it is a plain workbook | Fully | Only what the vendor exposes |
| Software needed | Excel 2016 or later. No add-ins, no macros | Excel | Browser plus an account |
| Sharing a snapshot | Send the file, or print any page to PDF | Same | Usually needs a licensed viewer |
How to use it
- Unzip and open the workbook. Every page is already populated with the 500 demo rows, so you can click through the navigation and the slicers before touching anything.
- Go to the data sheet and look at the column headers. Those names are what the pivots reference, so keep them as they are.
- Delete the demo rows and paste your own records underneath the header row, matching column for column. Leave any column blank that you do not track — the charts built on it will simply show nothing.
- Rename the categories if your taxonomy differs. Sector, funding stage, region, business model and funding band are all plain text read from the data, so typing Marine Energy instead of Wind Power is enough to make it appear on the charts.
- Refresh all (Data → Refresh All, or Ctrl+Alt+F5). Every KPI card and chart on all five pages updates.
- Filter and present. Use the Month, Sector and Funding Stage slicers to cut the story down, then print to PDF or screenshot the page for your deck.
Who it is for
- Climate and clean tech fund teams producing a recurring portfolio report.
- Accelerator and incubator programme managers tracking a cohort’s funding, headcount and stage progression.
- Corporate venture and innovation teams reporting an internal investment list upward.
- Ecosystem builders, market researchers and analysts summarising a sector landscape.
- Consultants who need a presentable deliverable without spending two days on chart formatting.
- Anyone learning dashboard building in Excel who wants a working pivot-and-slicer model to take apart.
Frequently asked questions
Does this dashboard measure or verify emissions?
No. It totals a column you fill in yourself. The workbook applies no emissions methodology, performs no calculation from activity data, and does not audit, verify or validate anything you enter. It is not a carbon accounting tool and makes no claim of alignment with the GHG Protocol, SBTi, CSRD, TCFD, ISSB or any other framework.
Does it tell me whether a company is a good investment?
No. It does not score, rank or evaluate companies or investors, and nothing in it constitutes investment advice or a recommendation. It presents figures you supply. The Avg. Investor Rating is a value you type in, averaged.
Are the numbers in the screenshots real?
No. All 500 rows are invented demo data, including the company counts, currency amounts, country names and the eight lead investor names. They exist so the pages are populated when you first open the file. Replace them with your own.
Do I need macros or an add-in?
No. It is a plain .xlsx workbook built on native pivot tables, pivot charts and slicers. There is no VBA, so no macro security prompt and no add-in to install.
Which versions of Excel does it work in?
Excel 2016, 2019, 2021, 2024 and Microsoft 365, on Windows or Mac. Slicers and pivot charts need the desktop application — Excel for the web can open and view the file but its slicer behaviour is limited.
Can I add my own charts, sectors or KPIs?
Yes. Nothing is locked. Add a column to the data table, build a pivot from it and drop a chart wherever you want. Colours, fonts, titles and KPI labels are all editable.
How many rows can I load?
The demo file uses 500. Pivot tables handle far more comfortably; tens of thousands of rows are fine on ordinary hardware. Refresh time grows with row count, not dashboard complexity.
Is it a one-time purchase?
Yes. One payment, instant download, no subscription and no per-seat licence.
What you get
- One .xlsx workbook containing all five dashboard pages, the data table, the supporting pivot tables and every chart.
- 500 rows of demo data, ready to delete.
- Instant download after checkout, with no expiry and no download limit.
Browse more Excel dashboard templates at NextGenTemplates.




















Reviews
There are no reviews yet.