



Managing Private Equity Dashboard investments requires clarity, speed, and confidence. However, many private equity firms still depend on scattered spreadsheets, static MIS reports, and delayed updates. As a result, partners and analysts struggle to track portfolio performance, identify risks early, and communicate insights clearly to investors.
That is exactly where a Private Equity Dashboard in Power BI becomes a game-changer.
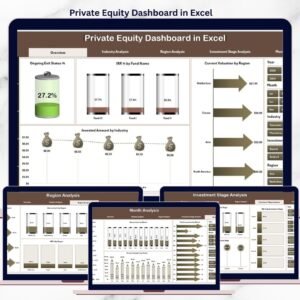
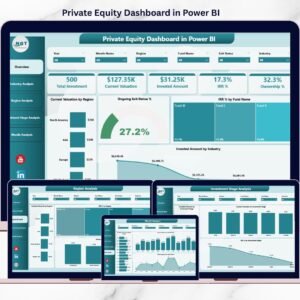
This ready-to-use Power BI dashboard transforms complex private equity data into interactive, visual, and decision-ready insights. It helps firms track valuation, invested capital, IRR, ownership, exit status, and trends across funds, industries, regions, investment stages, and time periods—all in one centralized dashboard.
Instead of spending hours compiling reports, your team can focus on strategic analysis, faster decisions, and stronger investor confidence.
🚀 Key Features of Private Equity Dashboard in Power BI
📊 Centralized Portfolio View
Monitor all critical private equity KPIs in one professional Power BI dashboard.
📈 Real-Time Interactive Analytics
Use slicers to analyze performance by fund, region, industry, investment stage, and month.
💰 Valuation & Capital Tracking
Track current valuation, invested amount, and capital deployment trends clearly.
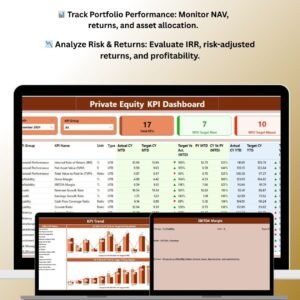
📉 IRR & Performance Analysis
Compare IRR across funds, industries, regions, and investment stages.
📍 Exit Status & Ownership Insights
Understand exit progress and ownership exposure at a glance.
⚡ High-Performance Power BI Visuals
Fast loading, scalable visuals suitable for growing portfolios.
🔐 Enterprise-Ready & Secure
Built on Power BI with support for role-based access and secure data models.
📦 What’s Inside the Private Equity Dashboard in Power BI
This dashboard includes 5 professionally designed analytical pages, each answering a critical investment question.
🧭 1️⃣ Overview Page – Portfolio Health at a Glance

The Overview Page acts as the command center for partners and leadership.
✔ Interactive slicers for quick filtering
✔ KPI cards for instant performance snapshot
✔ High-level visuals for strategic review
Key Insights Shown
Current Valuation by Region
Ongoing Exit Status %
IRR % by Fund Name
Invested Amount by Industry
This page enables leadership to identify risks and opportunities within seconds.
🏭 2️⃣ Industry Analysis Page – Sector-Wise Performance
The Industry Analysis Page focuses on understanding returns and exposure across industries.
✔ Invested Amount by Industry
✔ IRR % by Industry
✔ Ownership % by Industry
This page helps firms rebalance portfolios and prioritize high-performing sectors.
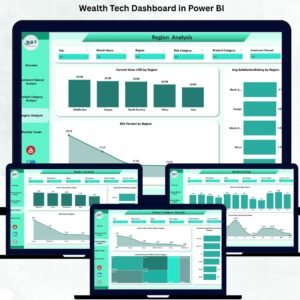
🌍 3️⃣ Region Analysis Page – Geographic Performance Insights
The Region Analysis Page provides a clear view of geographic exposure and returns.
✔ Invested Amount by Region
✔ IRR % by Region
✔ Ownership % by Region
Ideal for managing location-based risk and growth strategies.
🚀 4️⃣ Investment Stage Analysis Page – Risk vs Return View
The Investment Stage Analysis Page evaluates performance across stages.
✔ Invested Amount by Investment Stage
✔ IRR % by Investment Stage
✔ Current Valuation by Investment Stage
This page supports capital allocation decisions across early, growth, and mature stages.
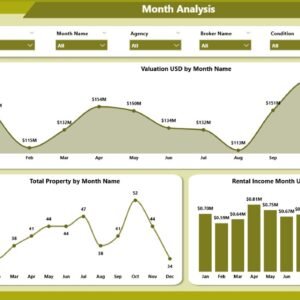
📆 5️⃣ Month Analysis Page – Trend & Timing Analysis
The Month Analysis Page tracks investment activity and valuation trends over time.
✔ Invested Amount by Month
✔ Total Investment by Month
✔ Current Valuation by Month
Helps firms identify investment cycles, momentum, and seasonality.
🛠️ How to Use the Private Equity Dashboard in Power BI
1️⃣ Maintain structured private equity data in Excel or a database
2️⃣ Connect the data source to Power BI
3️⃣ Refresh the dataset
4️⃣ Use slicers to filter by fund, region, industry, stage, or month
5️⃣ Analyze KPIs and trends instantly
No manual reporting. No complex recalculations.
👥 Who Can Benefit from This Private Equity Dashboard
💼 General Partners
📊 Investment Managers
📈 Private Equity Analysts
💰 Finance & Valuation Teams
🤝 Investor Relations Teams
🏦 Boutique & Large PE Firms
If you manage or analyze private equity investments, this dashboard is built for you.
### 👉 Click here to read the Detailed blog post
🎥 Visit our YouTube channel to learn step-by-step video tutorials
👉 Youtube.com/@PKAnExcelExpert
Watch the step-by-step video tutorial:
Compatibility and Requirements
- Works in Power BI Desktop, which is free to download. Microsoft explains the install in Get Power BI Desktop.
- Your private equity data can be kept in Excel or a database and connected to the dashboard.
Frequently Asked Questions
How many pages does the dashboard have?
Five pages: Overview, Industry Analysis, Region Analysis, Investment Stage Analysis and Month Analysis.
Which metrics can I track?
Current valuation, invested amount, IRR %, ownership % and ongoing exit status. You can view them by fund, industry, region, investment stage and month.
Where does the data come from?
You keep structured private equity data in Excel or a database and connect it to Power BI. After you refresh the dataset, the visuals update.
Can I filter the results?
Yes. Slicers let you filter by fund, region, industry, investment stage or month.
Is there an Excel or Google Sheets version?
Yes. See the Private Equity Dashboard in Excel and the Private Equity Dashboard in Google Sheets.
Related Private Equity Templates
- Private Equity Dashboard in Excel: the same dashboard in Excel
- Private Equity Dashboard in Google Sheets: the Google Sheets edition
- Private Equity KPI Dashboard in Power BI: a KPI-focused view in Power BI
- Private Equity KPI Scorecard in Excel: a scorecard view of your metrics
- Power BI Dashboard Mega Collection: 15 Power BI dashboards in one download
Browse all Power BI dashboards.





















Reviews
There are no reviews yet.