

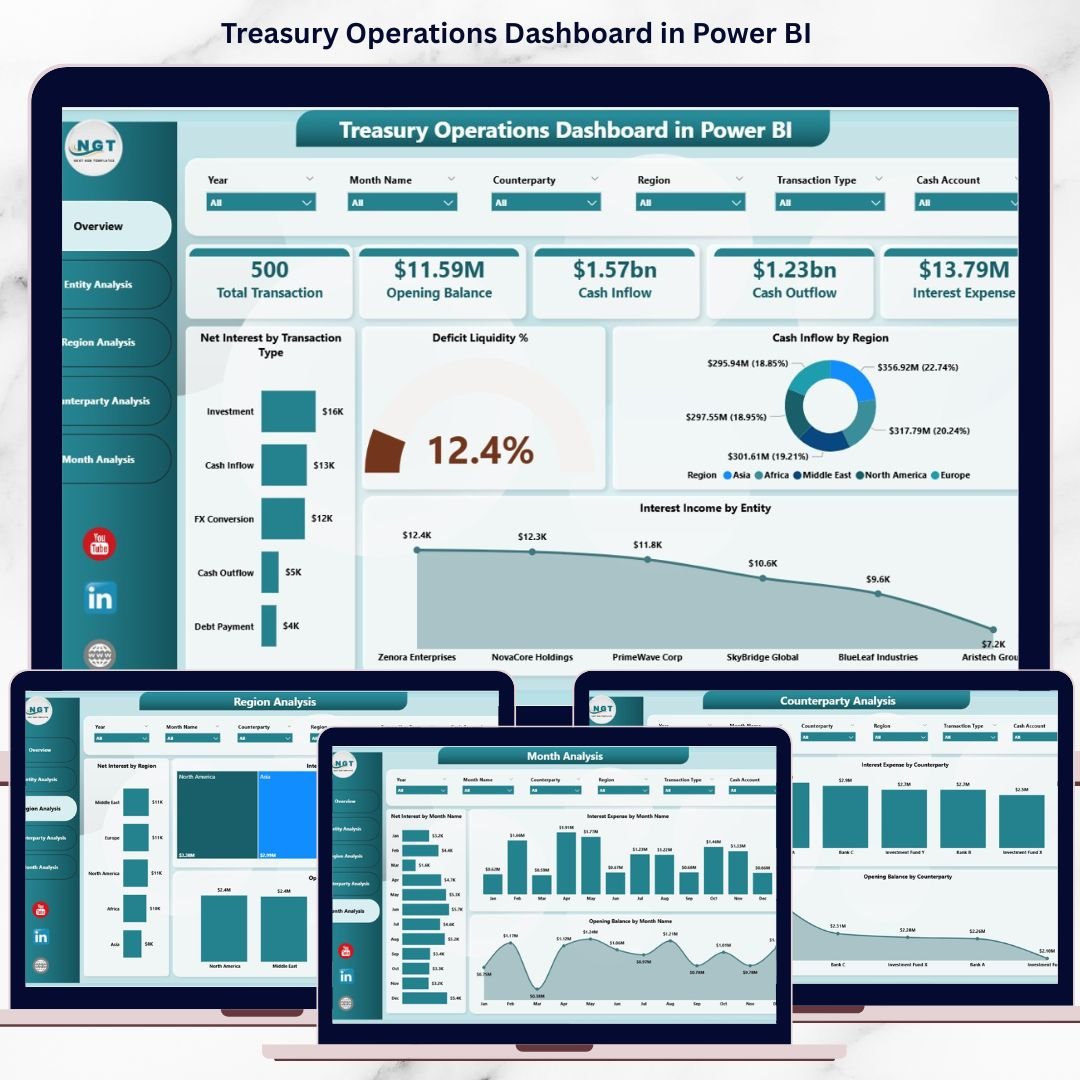

Treasury Operations Dashboard sit at the heart of every organization’s financial health. From managing cash and liquidity to controlling debt, investments, and financial risk, treasury teams make decisions that directly impact stability and growth. However, many treasury departments still rely on static Excel files, manual reconciliations, and delayed reports. As a result, insights arrive too late, risks remain hidden, and opportunities get missed.
That is exactly why the Treasury Operations Dashboard in Power BI becomes an essential solution for modern finance teams 🚀.
This ready-to-use dashboard transforms raw treasury data into real-time, interactive, and decision-ready insights. Instead of reviewing multiple spreadsheets for entities, regions, counterparties, and months, you get a single Power BI dashboard that brings everything together. Because Power BI updates visuals dynamically through slicers and filters, treasury managers gain immediate visibility into liquidity positions, interest performance, and exposure levels.
Whether your goal is better cash flow management, stronger risk control, or executive-level reporting, this dashboard helps treasury teams move from reactive reporting to proactive financial intelligence.
🔑 Key Features of Treasury Operations Dashboard in Power BI
💰 Centralized Treasury Visibility – Track cash flow, interest income, and balances in one dashboard
🎯 Dynamic Slicers & Filters – Analyze data by entity, region, counterparty, transaction type, and period
📊 Executive KPI Cards – Instantly view critical treasury metrics at a glance
📈 Multi-Dimensional Analysis – Compare performance across entities, regions, and counterparties
⚡ Real-Time Power BI Refresh – Always work with the latest treasury data
🔍 Clear & Professional Visuals – Easy interpretation for finance and leadership teams
🧩 Scalable & Flexible Design – Adapt the dashboard as treasury needs evolve
📂 What’s Inside the Treasury Operations Dashboard in Power BI
This digital product includes five structured analytical pages, each designed to support a specific treasury decision:
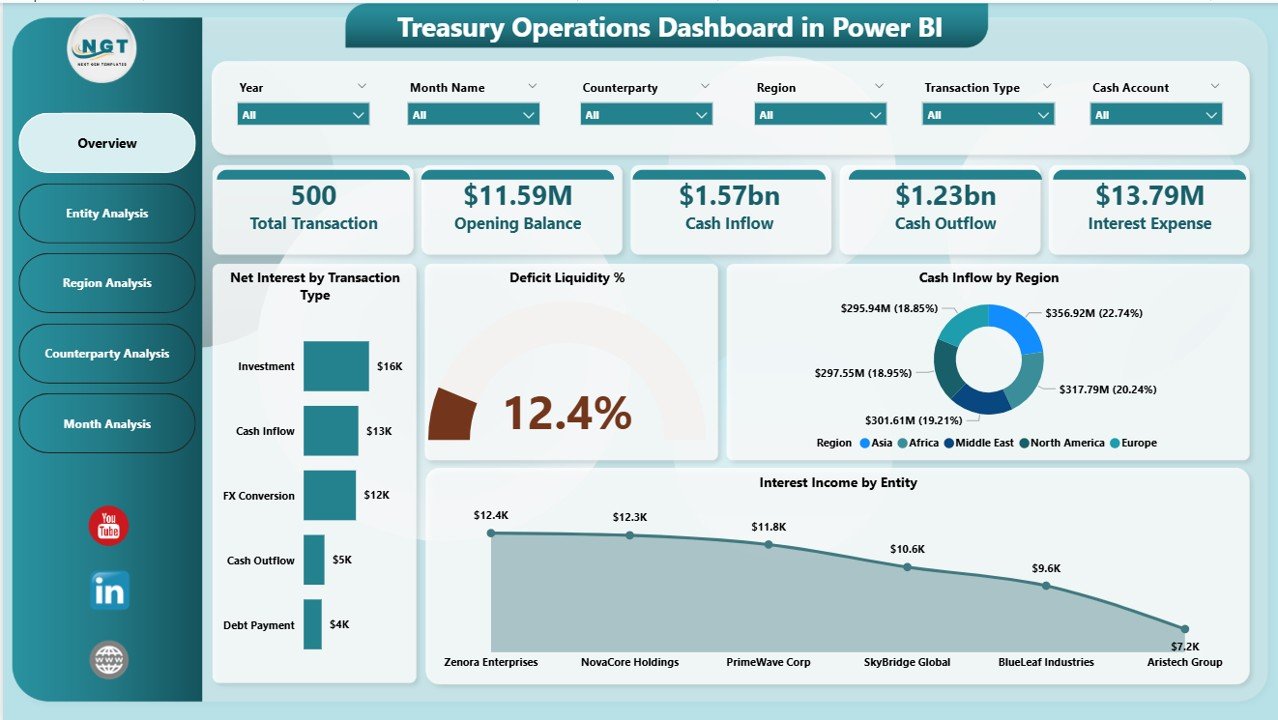
📌 Overview Page – Executive snapshot with KPI cards and charts showing overall treasury performance
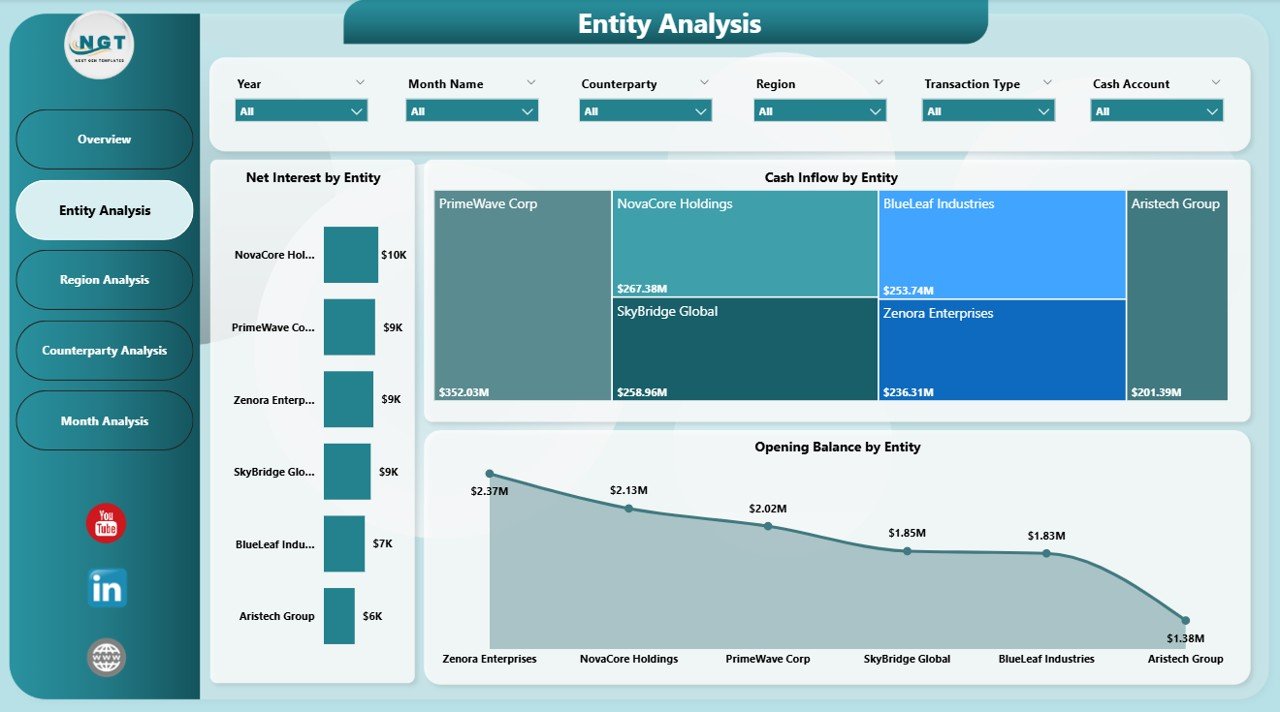
📌 Entity Analysis Page – Compare net interest, cash inflow, and opening balances across entities
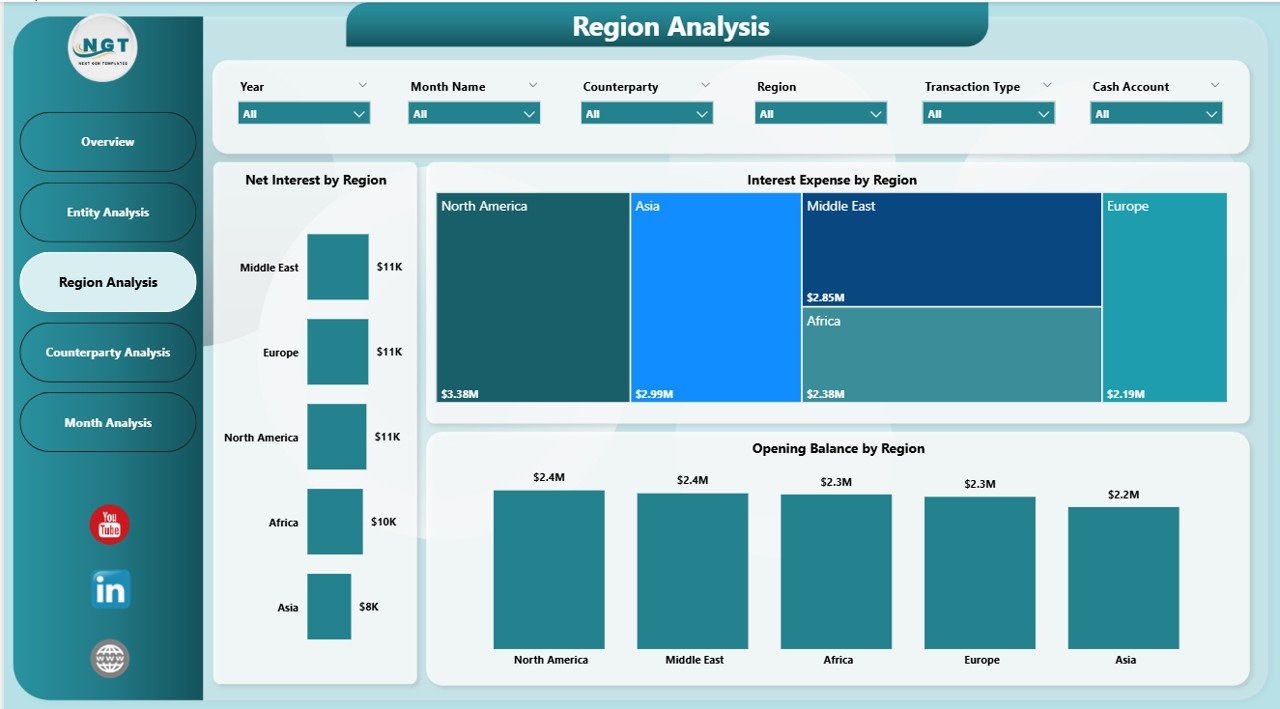
📌 Region Analysis Page – Monitor treasury performance by geographic region
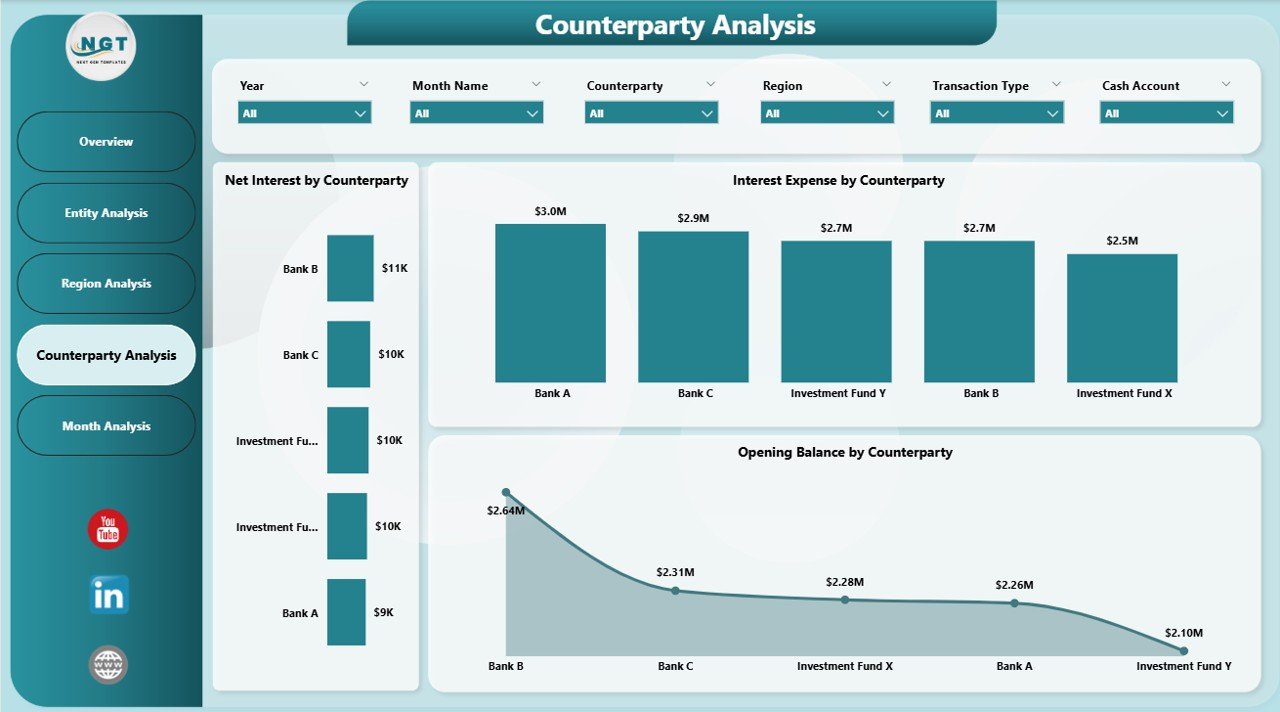
📌 Counterparty Analysis Page – Track exposure, interest, and balances by counterparty
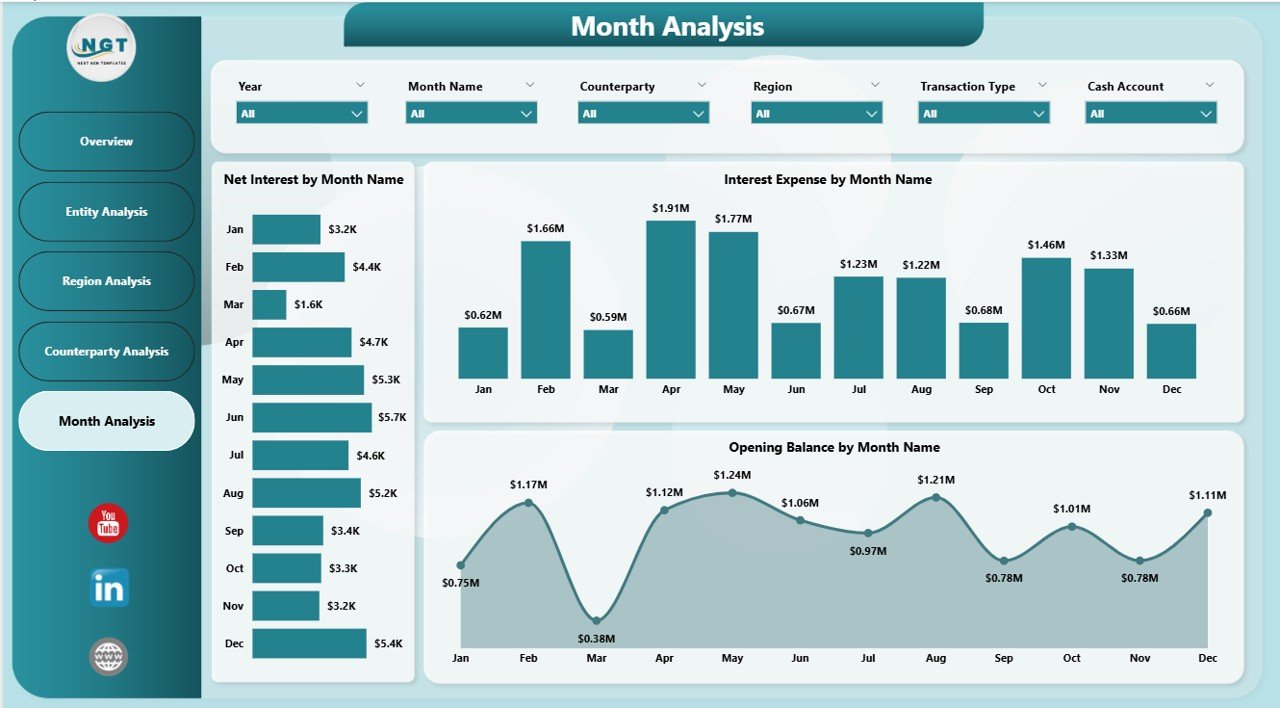
📌 Monthly Trends Page – Analyze time-based trends for interest, balances, and liquidity
Each page is fully interactive and responds instantly to slicer selections, allowing deep analysis without rebuilding reports.
🛠️ How to Use the Treasury Operations Dashboard in Power BI
Using this dashboard is simple and intuitive:
1️⃣ Connect your treasury data from Excel, ERP, or treasury systems
2️⃣ Refresh the Power BI dashboard
3️⃣ Use slicers to filter by entity, region, counterparty, or month
4️⃣ Start with the Overview Page for instant clarity
5️⃣ Drill down into entity, region, or counterparty analysis
6️⃣ Review monthly trends to forecast liquidity needs
7️⃣ Share insights with finance leadership using one professional dashboard
No complex setup. No manual reconciliation. Just fast, reliable treasury insights.
👥 Who Can Benefit from This Treasury Operations Dashboard in Power BI
This dashboard is ideal for:
💼 Treasury Managers – Improve liquidity planning and cash visibility
📊 CFOs & Finance Directors – Gain executive-level treasury insights
🏦 Corporate Finance Teams – Monitor interest income and expenses
🛡️ Risk Management Teams – Reduce counterparty and liquidity risk
📈 Financial Controllers – Support accurate reporting and forecasting
🏢 Multi-Entity Organizations – Standardize treasury reporting across units
Because the dashboard is flexible, it works for organizations of all sizes.
📘 Click here to read the detailed blog post
▶️ Visit our YouTube channel to learn step-by-step video tutorials
Watch the step-by-step video tutorial:
Compatibility and Requirements
- Works in Power BI Desktop, which is free to download. Microsoft explains how to get it in Get Power BI Desktop.
- Your treasury data can come from Excel, an ERP or a treasury system, as described on this page.
Frequently Asked Questions
Which pages does the dashboard include?
Five pages: Overview, Entity Analysis, Region Analysis, Counterparty Analysis and Monthly Trends.
Where does the data come from?
You connect your treasury data from Excel, an ERP or a treasury system, then refresh the dashboard in Power BI.
Can I filter the numbers by entity, region or counterparty?
Yes. Slicers let you filter by entity, region, counterparty, transaction type and month, and every page responds to your selection.
What does the Overview page show?
It shows executive KPI cards and charts with overall treasury performance, including cash flow, interest income and balances.
Is there an Excel version of this dashboard?
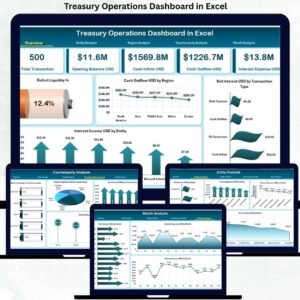
Yes. See the Treasury Operations Dashboard in Excel.
Related Treasury Templates
- Treasury Operations Dashboard in Excel: the same dashboard for Excel users
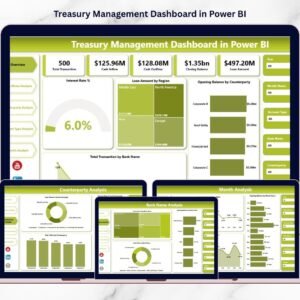
- Treasury Management Dashboard in Power BI: another treasury dashboard in Power BI
- Treasury Operations KPI Dashboard in Power BI: a KPI-focused view of treasury operations
- Treasury Management KPI Dashboard in Power BI: treasury management KPIs in Power BI
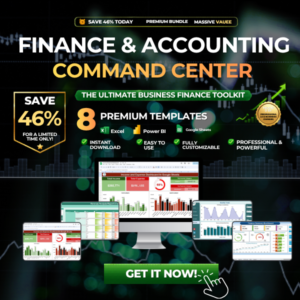
- Finance & Accounting Command Center: 8 finance templates in one download
Browse all Power BI dashboards.



























Reviews
There are no reviews yet.