

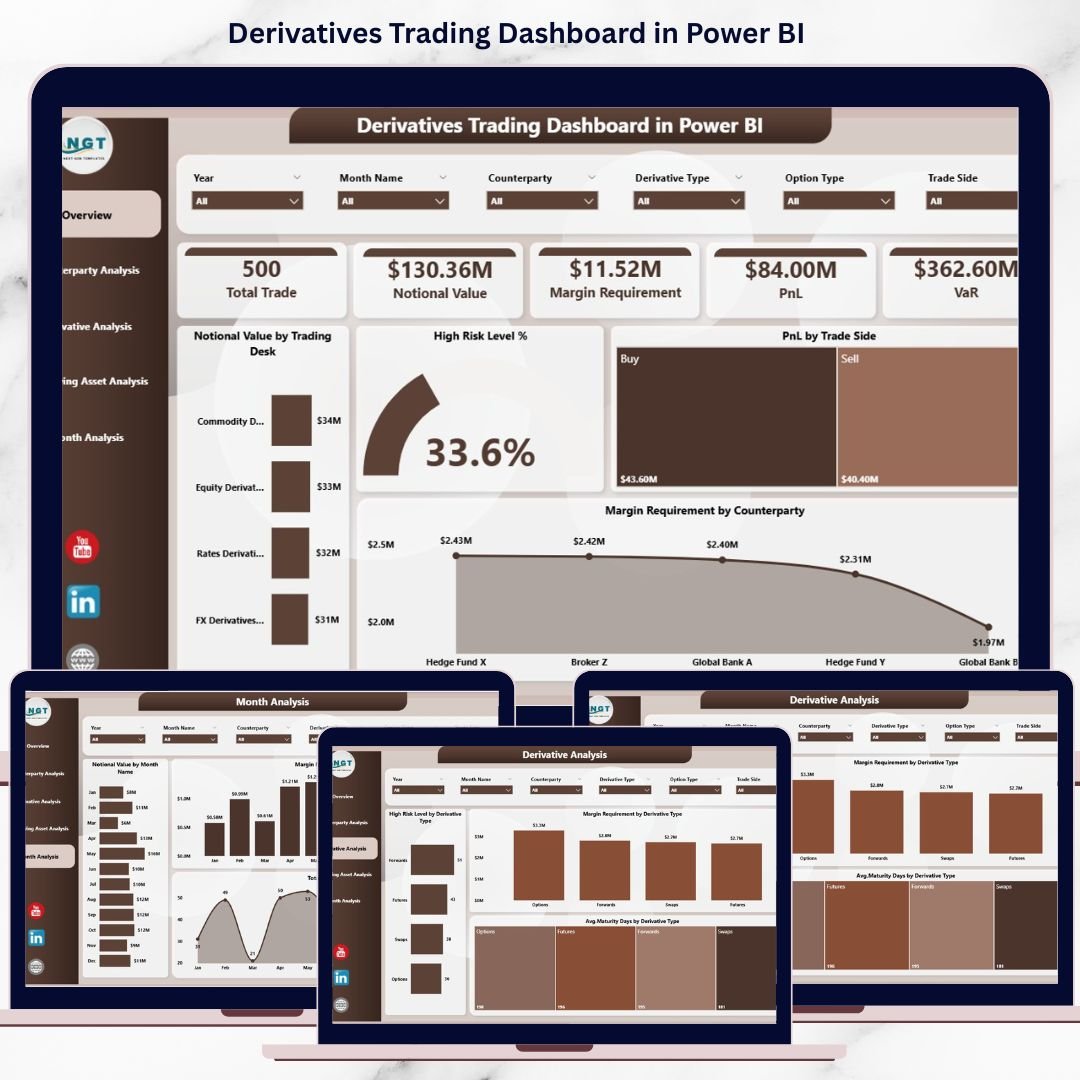

Derivatives Trading Dashboard has become a core component of modern financial markets. With rising trading volumes, leverage, and market volatility, organizations must closely monitor exposure, margin requirements, and profitability. However, many trading desks and risk teams still rely on scattered Excel files, delayed reports, and manual reconciliations. As a result, risks remain hidden, decisions slow down, and opportunities are missed.
That is exactly why the Derivatives Trading Dashboard in Power BI becomes a game-changing solution 🚀.
This ready-to-use Power BI dashboard transforms complex derivatives trading data into clear, interactive, and actionable insights. Instead of tracking notional values, margins, PnL, and risk levels across multiple spreadsheets, you get a single centralized dashboard that updates dynamically. Because Power BI enables slicers, drill-downs, and visual analytics, decision-makers can respond faster and with greater confidence.
Whether your focus is trading performance, risk control, liquidity planning, or compliance, this dashboard helps you move from reactive reporting to proactive trading management.
🔑 Key Features of Derivatives Trading Dashboard in Power BI
📊 Centralized Trading Analytics – View notional value, PnL, margin, and risk in one dashboard
🎯 Dynamic Slicers & Filters – Analyze data by trading desk, counterparty, derivative type, asset, and time
🚦 Risk Visibility – Instantly identify high-risk positions and concentration exposure
💰 Margin Requirement Tracking – Monitor margin obligations accurately across counterparties
📈 Profit & Loss Analysis – Evaluate trading performance by buy/sell side and asset class
🔍 Drill-Down Capability – Explore detailed insights without rebuilding reports
⚡ Fast Power BI Performance – Handle large trading datasets efficiently
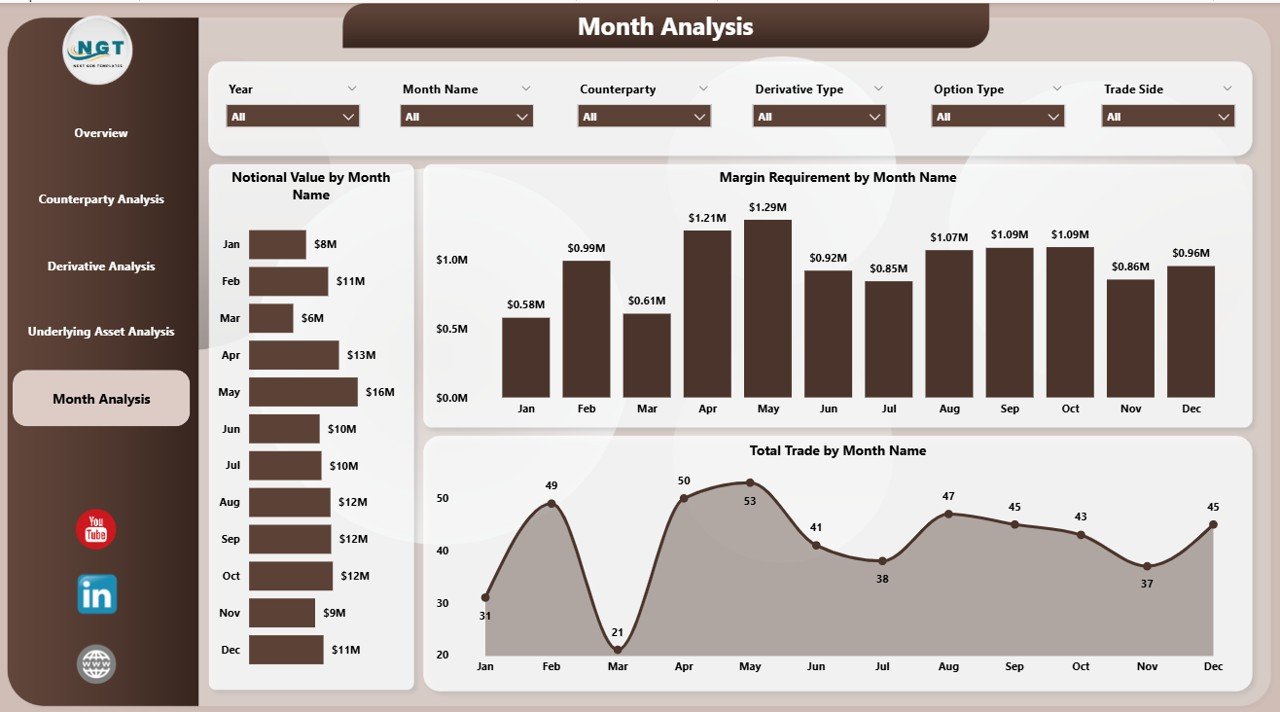
📅 Trend Monitoring – Track exposure, margin, and activity over time
📂 What’s Inside the Derivatives Trading Dashboard in Power BI
This digital product includes five structured analytical pages, each designed to support a specific trading or risk question:
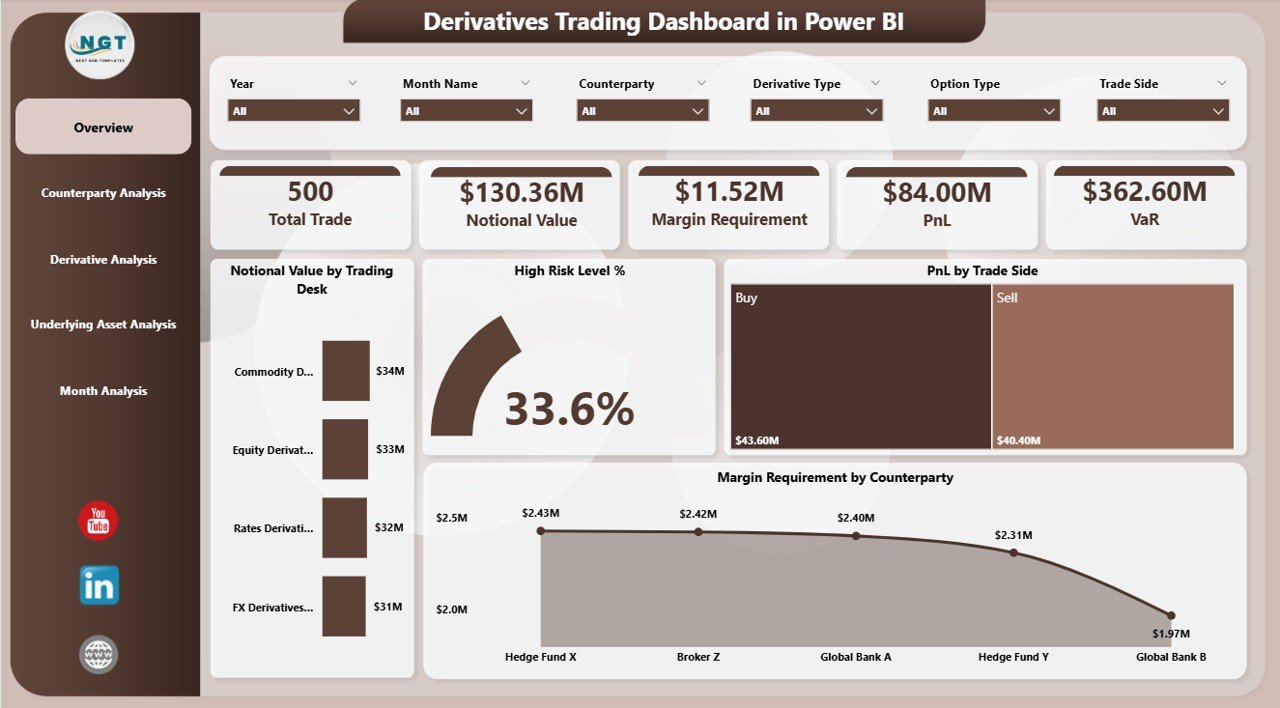
📌 Overview Page – Executive snapshot with KPI cards for total notional value, high-risk %, total PnL, and margin requirement
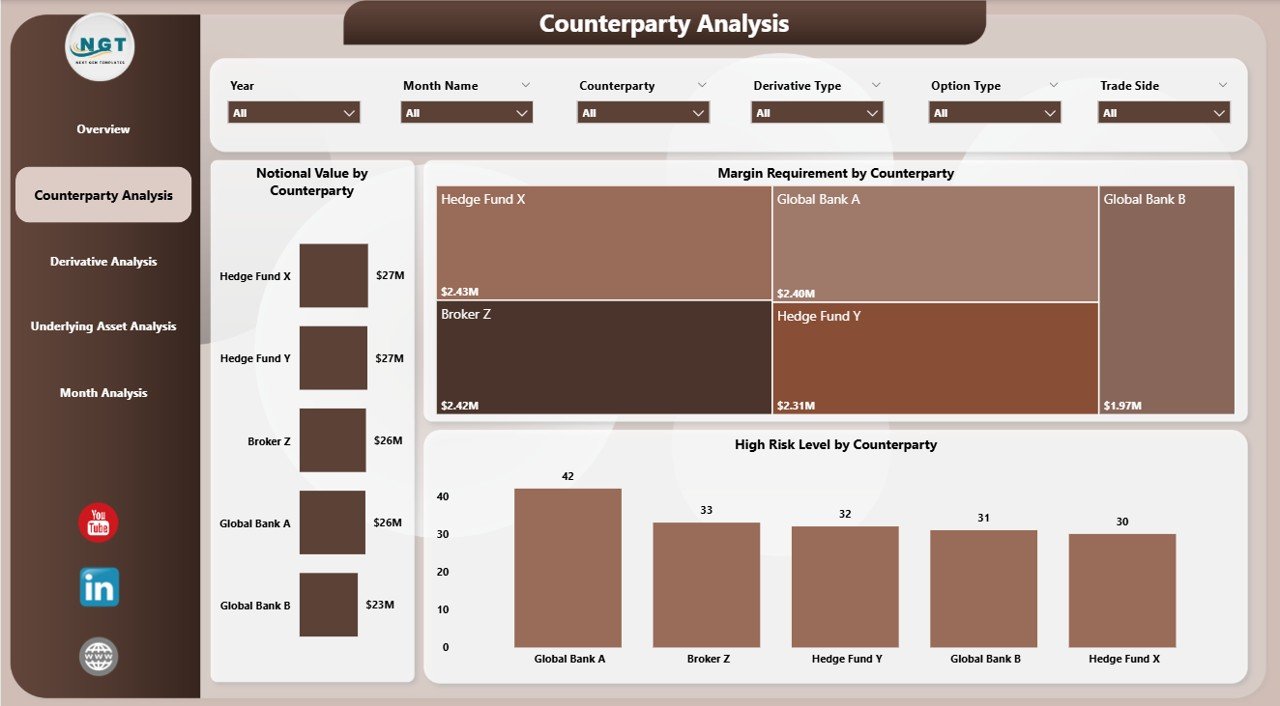
📌 Counterparty Analysis Page – Exposure, margin, and risk visibility by counterparty
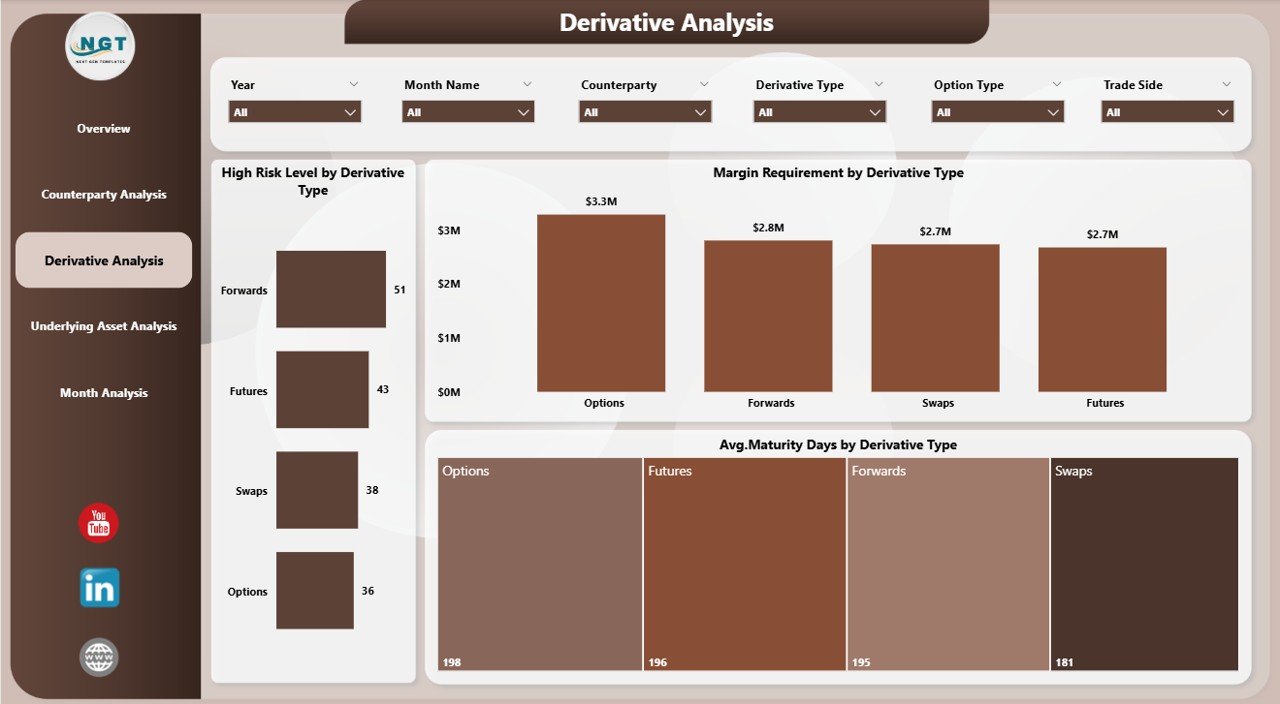
📌 Derivative Analysis Page – Risk level, margin requirement, and maturity analysis by derivative type
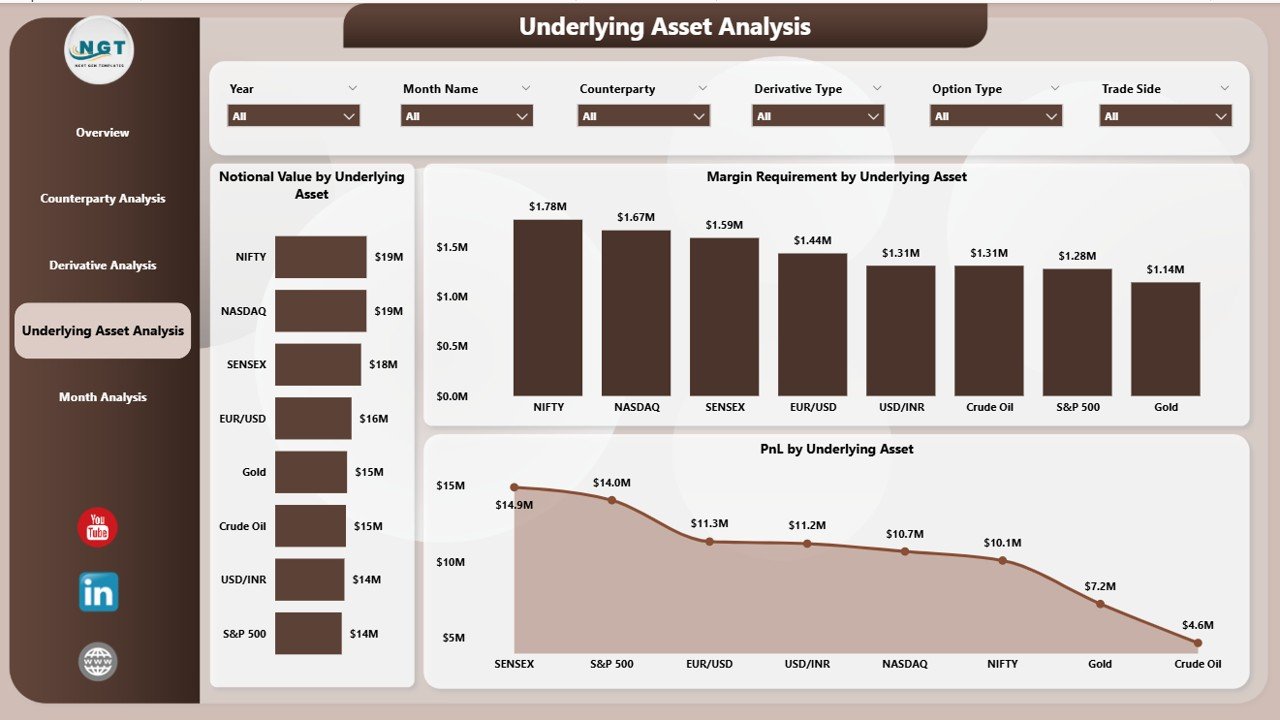
📌 Underlying Asset Analysis Page – Exposure, margin, and PnL insights by asset class
📌 Monthly Trends Page – Time-based analysis of notional value, margin, and trading activity
All pages are fully interactive and respond instantly to slicer selections.
🛠️ How to Use the Derivatives Trading Dashboard in Power BI
Using this dashboard is simple and intuitive:
1️⃣ Connect your trading data (Excel, database, or system feed)
2️⃣ Refresh the Power BI dashboard
3️⃣ Use slicers to filter by desk, counterparty, derivative type, or period
4️⃣ Start with the Overview Page for instant performance clarity
5️⃣ Drill down into analysis pages for deeper insights
6️⃣ Monitor trends to anticipate risk and liquidity needs
7️⃣ Share insights with trading, risk, and leadership teams
No complex setup. No manual reconciliations. Just fast, reliable trading intelligence.
👥 Who Can Benefit from This Derivatives Trading Dashboard in Power BI
This dashboard is ideal for:
📈 Trading Desks – Monitor exposure, PnL, and performance in real time
🛡️ Risk Managers – Identify high-risk positions early
💼 Treasury Teams – Track margin requirements and liquidity impact
📊 Compliance & Audit Teams – Support regulatory reporting and governance
🏦 Investment & Finance Leaders – Gain strategic oversight of derivatives portfolios
📉 Analytics & BI Teams – Deliver insights without repetitive reporting
Because it is flexible, the dashboard adapts easily across asset classes and trading strategies.
📘 Click here to read the detailed blog post
▶️ Visit our YouTube channel to learn step-by-step video tutorials
Watch the step-by-step video tutorial:
Compatibility and Requirements
- Open the dashboard in Power BI Desktop, which is free. Microsoft explains how to get Power BI Desktop.
Frequently Asked Questions
How many pages are in the Derivatives Trading Dashboard?
Five: Overview, Counterparty Analysis, Derivative Analysis, Underlying Asset Analysis and Monthly Trends.
Which KPI cards are on the Overview page?
Total notional value, high-risk %, total PnL and margin requirement.
What can I filter by?
The slicers filter by trading desk, counterparty, derivative type, underlying asset and time period. All pages respond to the slicer selections.
How do I load my own trading data?
Connect your trading data in Power BI, for example from Excel, a database or a system feed, and refresh the dashboard.
Can I track margin by counterparty?
Yes. The Counterparty Analysis page shows exposure, margin and risk for each counterparty.
Related Derivatives and Trading Templates
- Derivatives Trading Dashboard in Excel: the same topic in Excel
- Derivatives Trading KPI Dashboard in Power BI: MTD and YTD trading KPIs against targets
- Derivatives Trading KPI Dashboard in Excel: trading KPIs in Excel
- Commodities Trading Dashboard in Power BI: for commodity trading desks
- Finance & Accounting Command Center: 8 finance templates in one bundle
Browse all Power BI dashboards or the Power BI KPI dashboards.




























Reviews
There are no reviews yet.