

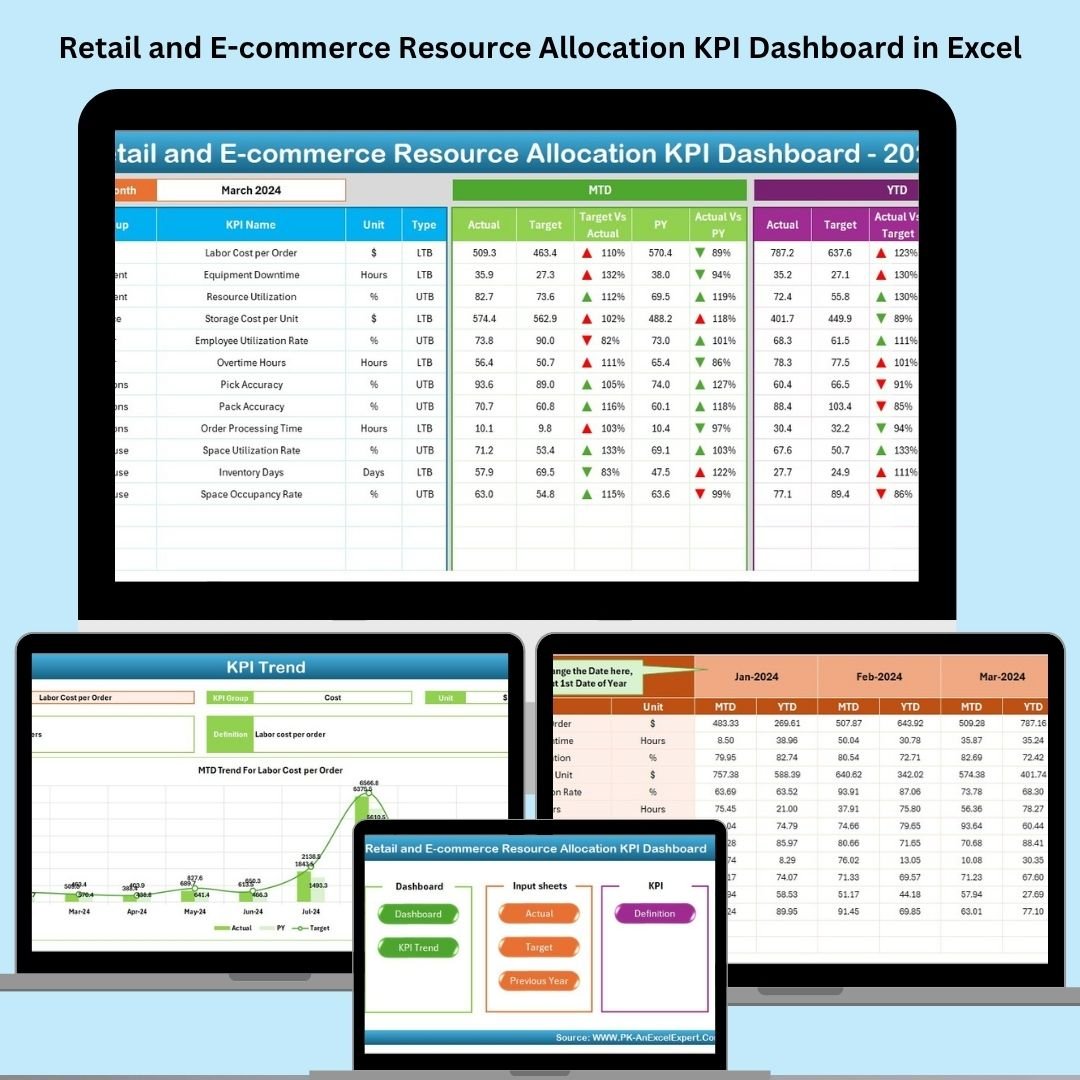
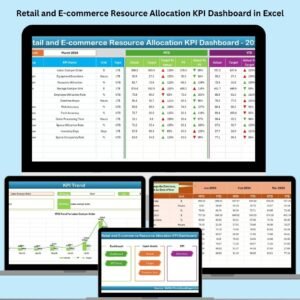
Maximize your resource efficiency and unlock real-time performance insights with our Retail and E-commerce Resource Allocation KPI Dashboard — a powerful, ready-to-use Excel template designed for retail managers, ecommerce analysts, and business leaders.
Whether you’re overseeing in-store sales, digital campaigns, inventory levels, or workforce planning, this Excel dashboard gives you the clarity to make fast, data-driven decisions. No subscriptions. No steep learning curve. Just streamlined analysis that adapts to your strategy.
🧩 What’s Included in the Dashboard?
1️⃣ Home Sheet – Navigation Hub
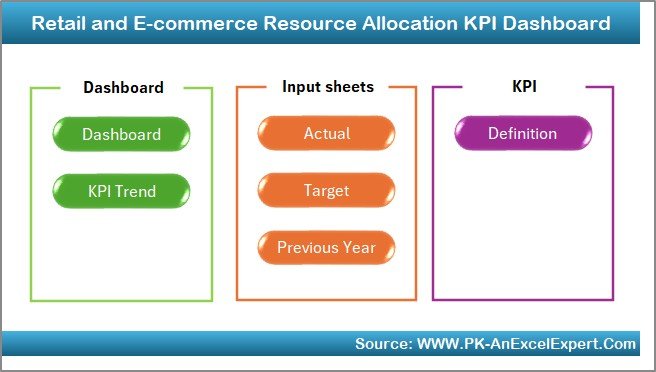
Central landing page with 6 quick-access buttons to all major tabs
Helps users navigate the workbook without searching through sheets
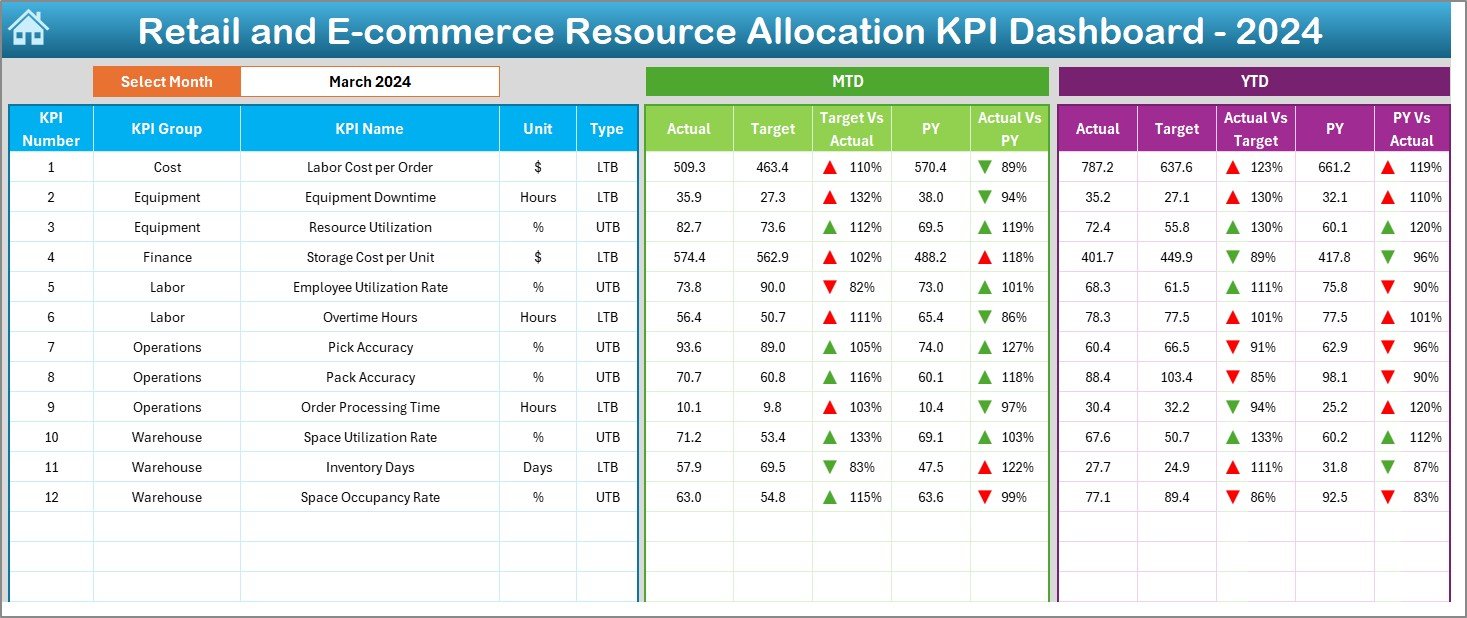
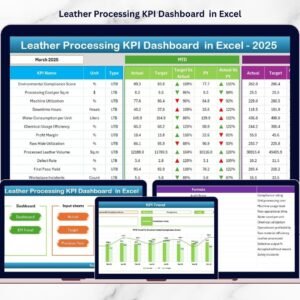
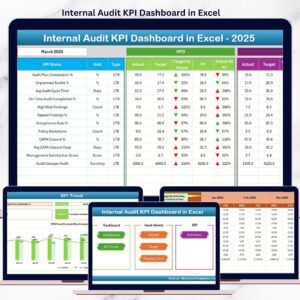
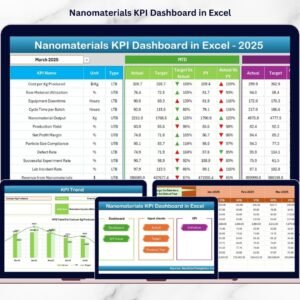
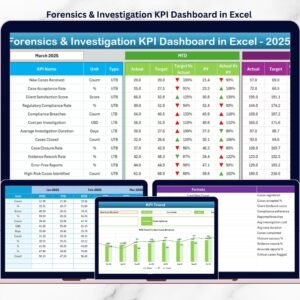
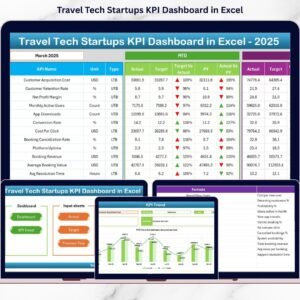
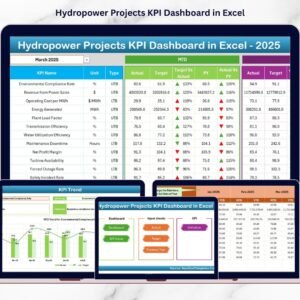
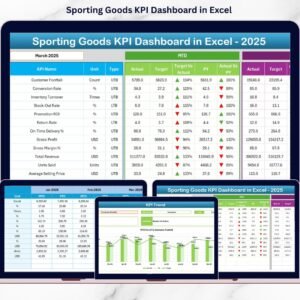
2️⃣ Dashboard Sheet – Month-to-Date & YTD Overview
Drop-down month selector (Cell D3): Instantly updates all metrics
Tracks:
MTD Actual vs. Target vs. PY
YTD Actual vs. Target vs. PY
Green/red arrow indicators show performance trends
Ideal for spotting real-time gaps and wins
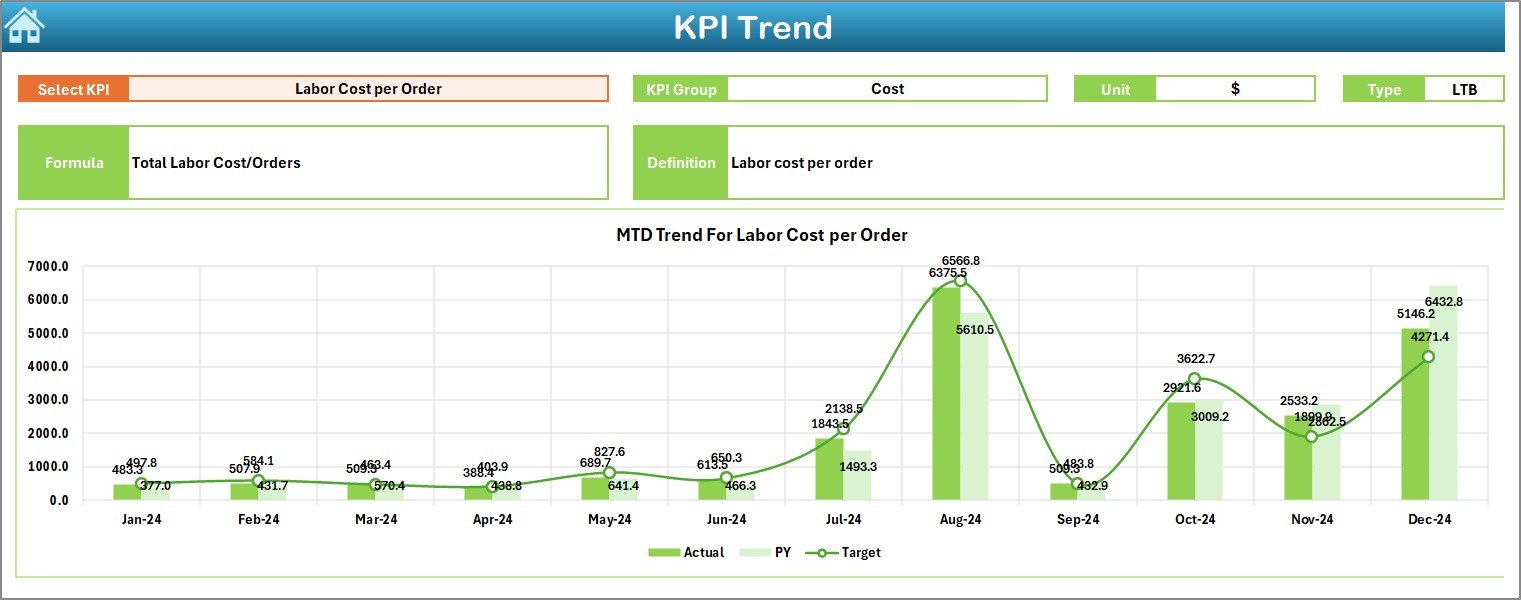
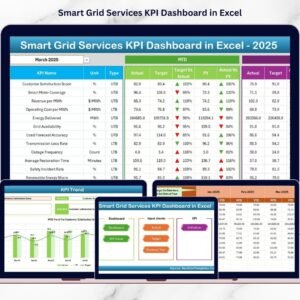
3️⃣ KPI Trend Sheet – Visual Trends Over Time
Choose any KPI (Cell C3) and see:
KPI Type (LTB or UTB)
Group (e.g., Inventory, Labor)
Unit, Formula & Definition
Dual line charts: MTD + YTD actual vs. target vs. PY
Clean, isolated visualization for each KPI
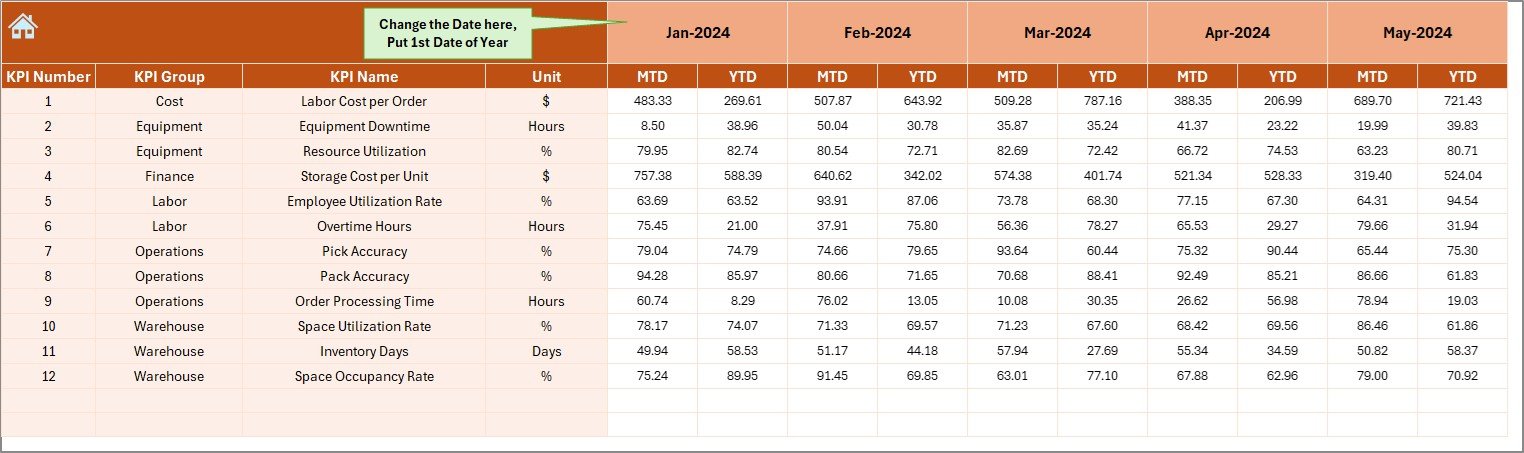
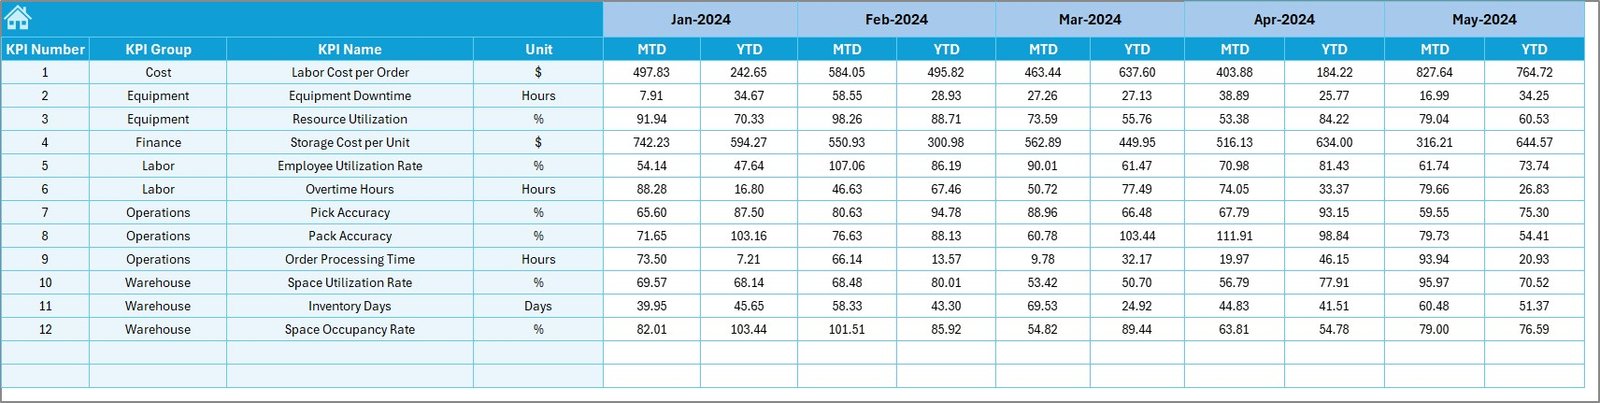
4️⃣ Actual Numbers Input Sheet
Set Fiscal Start Month (Cell E1)
Record monthly MTD and YTD values per KPI
Clean separation of data and formulas
5️⃣ Target Sheet
Enter monthly and YTD targets for each KPI
Easily track progress toward defined goals
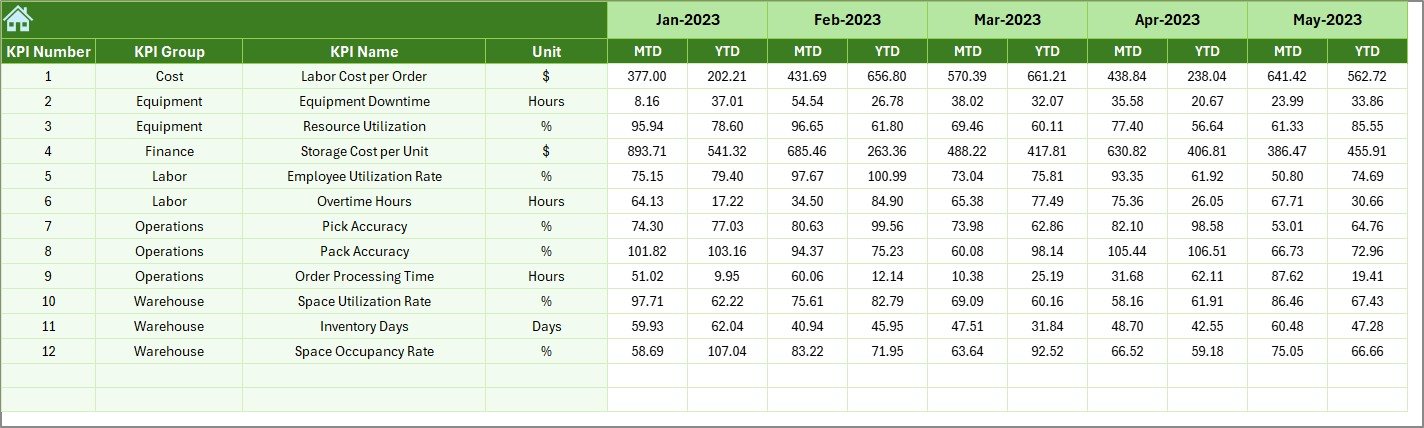
6️⃣ Previous Year Numbers Sheet
Record historical data from the previous year
Enables YoY performance comparisons
Great for benchmarking trends and seasonal shifts
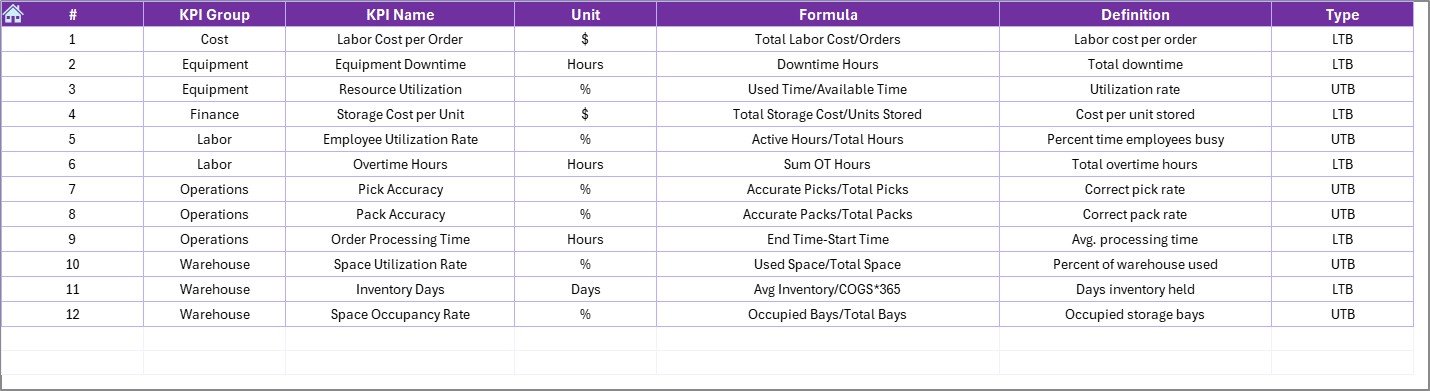
7️⃣ KPI Definition Sheet
Maintain clarity across teams with:
KPI Name
Group (e.g., Fulfillment, Marketing)
Unit
Formula
Short Definition
Keeps your dashboard consistent and transparent
💼 Who Should Use This?
Retail & E-commerce Business Owners
Operations Managers
Marketing Teams
Financial Analysts
Supply Chain Managers
🔍 What Can You Track?
📦 Inventory Utilization
📈 Marketing ROI
👨💼 Staff Allocation Efficiency
🕒 Order Fulfillment Time
💵 Channel Cost Per Acquisition
🎯 Sales per Resource Unit
And many more…
⚙️ Key Benefits
✅ Real-Time Visibility
Quickly compare actual performance against targets and previous year’s figures.
✅ Excel-Native Solution
No add-ins or external software required. Works seamlessly with Excel 2016 and above.
✅ Customizable & Scalable
Easily add KPIs, adjust chart styles, or integrate with Power Query / Power BI.
✅ Drop-Down Driven Navigation
Interactive selectors let users drill down without technical skills.
✅ Collaborative Ready
Use via OneDrive, SharePoint, or Excel Web for team-wide access and updates.
🛠️ Best Practices for Use
Set realistic targets based on past performance and upcoming goals
Assign ownership for data inputs—ensure accuracy and timeliness
Lock formula cells and use data validation to prevent errors
Save a snapshot each month for long-term performance tracking
Use conditional alerts for quick attention to critical metrics (e.g., low conversions)
📈 How to Customize the Dashboard
Add New KPI – Update KPI Definition sheet and input sheets
Change Fiscal Start – Adjust E1 in Actual Numbers sheet
Modify Visuals – Use Excel’s Chart Design tab
Automate Inputs – Connect your ERP or CRM via Power Query
Filter by Channel – Add slicers or segment KPIs by in-store vs. online
🎥 Need Help Getting Started?
📺 Visit our YouTube channel for tutorials, demos, and Excel tips
👉 youtube.com/@PKAnExcelExpert









Reviews
There are no reviews yet.