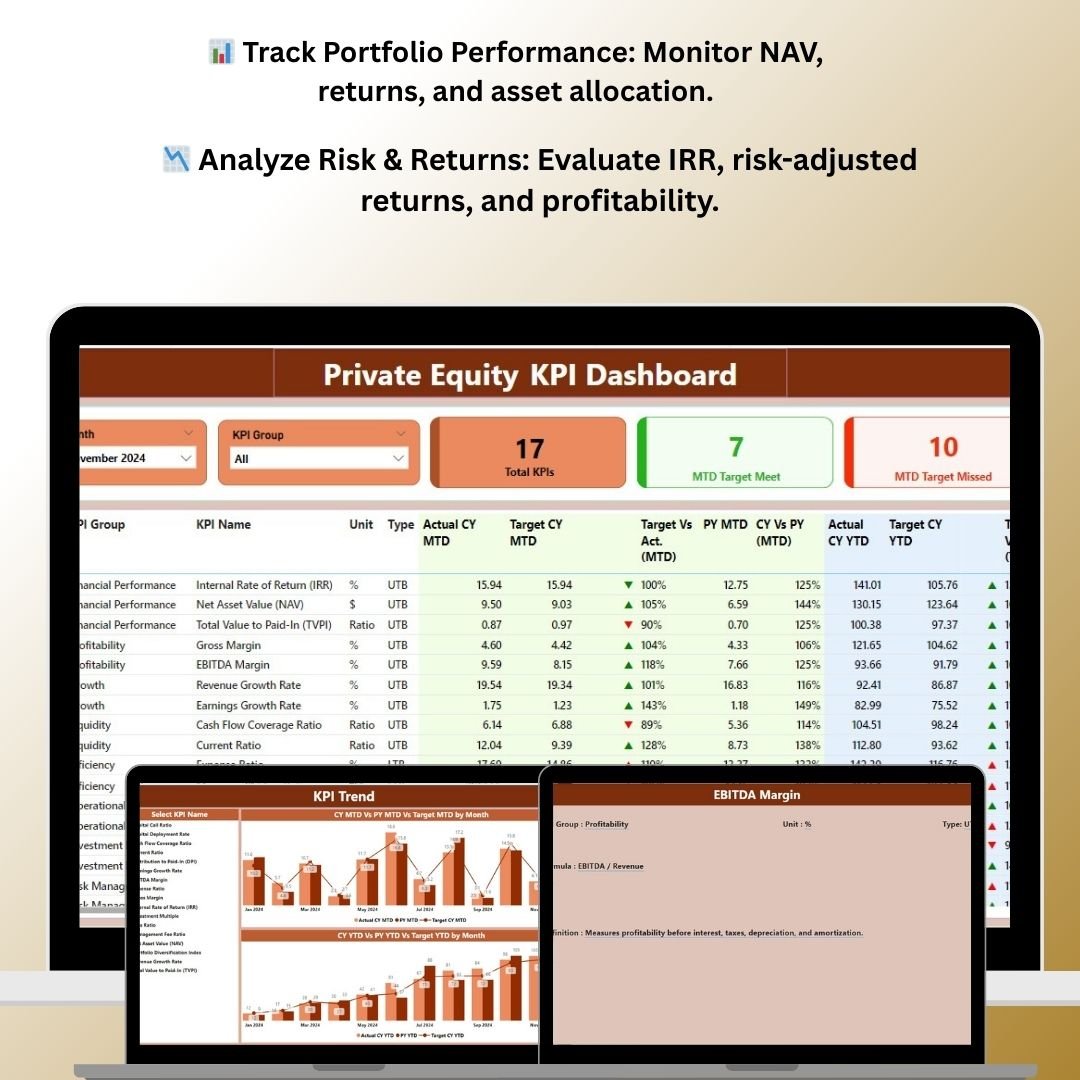
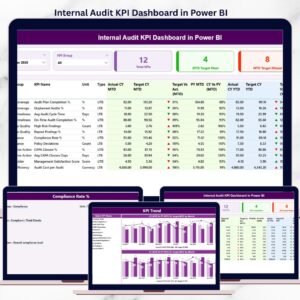
The Private Equity KPI Dashboard in Power BI is a sophisticated tool designed for private equity firms, investment managers, and financial analysts to track and analyze key performance indicators (KPIs) for their investments. This Power BI-based dashboard provides comprehensive insights into the performance of your private equity portfolio, including fund performance, asset allocation, returns, and risk metrics.
With this powerful tool, you can visualize complex financial data in an intuitive way, monitor portfolio performance, and assess the effectiveness of your investment strategies. Whether you manage a small portfolio or oversee multi-billion-dollar investments, this dashboard helps streamline decision-making, identify growth opportunities, and mitigate risks in the private equity space.
Key Features of the Private Equity KPI Dashboard in Power BI
📊 Comprehensive Portfolio Analysis
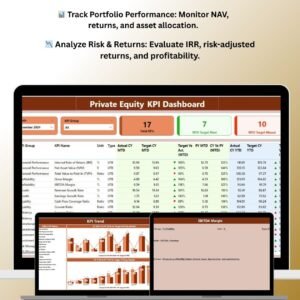
Track the overall performance of your private equity portfolio with key metrics such as fund performance, asset allocation, net asset value (NAV), and returns on investments. Gain real-time insights into how your portfolio is performing across various sectors and asset classes.
📉 Risk & Return Metrics
Monitor essential risk and return metrics such as internal rate of return (IRR), cash-on-cash return, and risk-adjusted returns. This allows you to evaluate how well your investments are performing relative to the risks involved.
💼 Investment & Fund Allocation Tracking
Track how your capital is allocated across different sectors, industries, and asset classes. Make informed decisions about where to reallocate funds and which sectors show the most promise for growth.
📅 Deal Flow & Investment Activity
Track investment activities and deal flow, including investment dates, capital invested, and current status of each investment. Maintain a complete record of past and current investments to assess their performance and profitability.
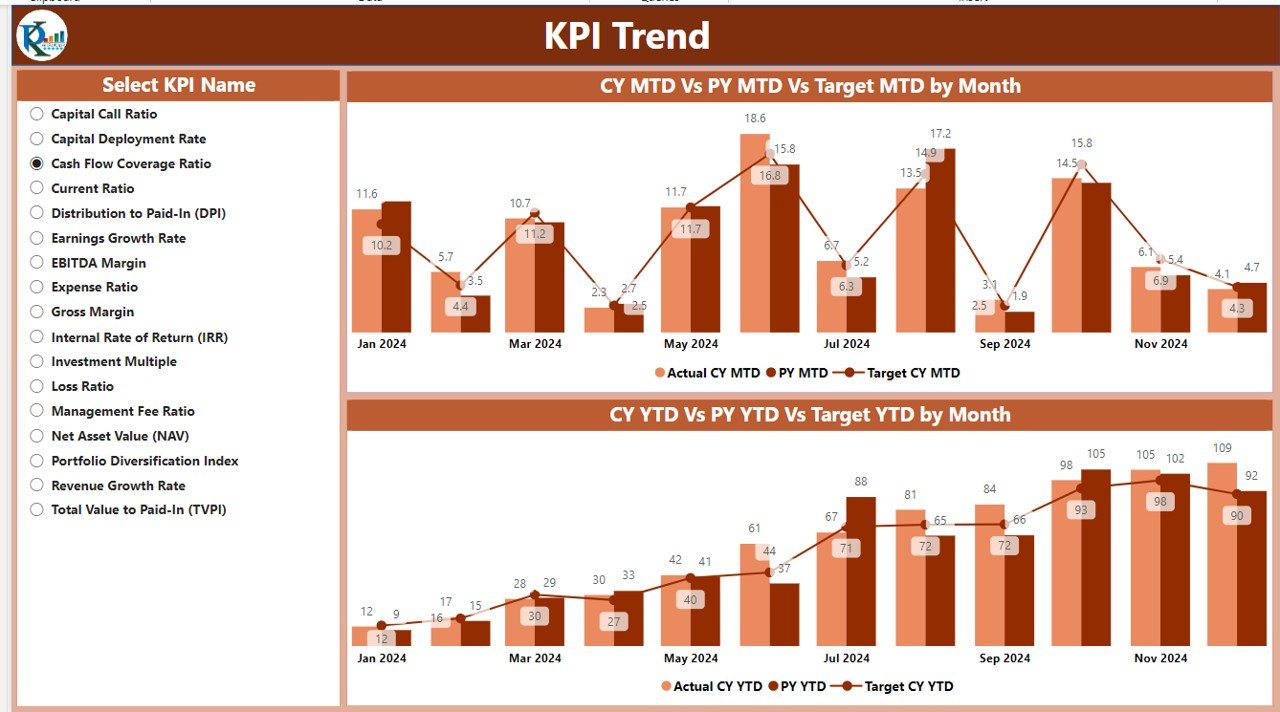
📈 Real-Time Data & Interactive Dashboards
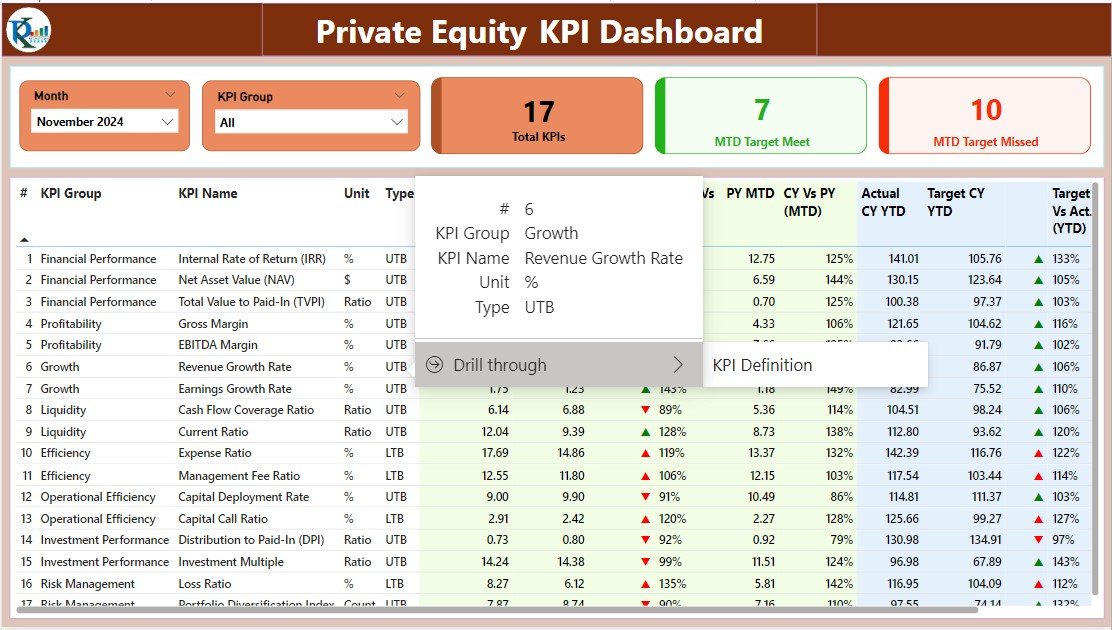
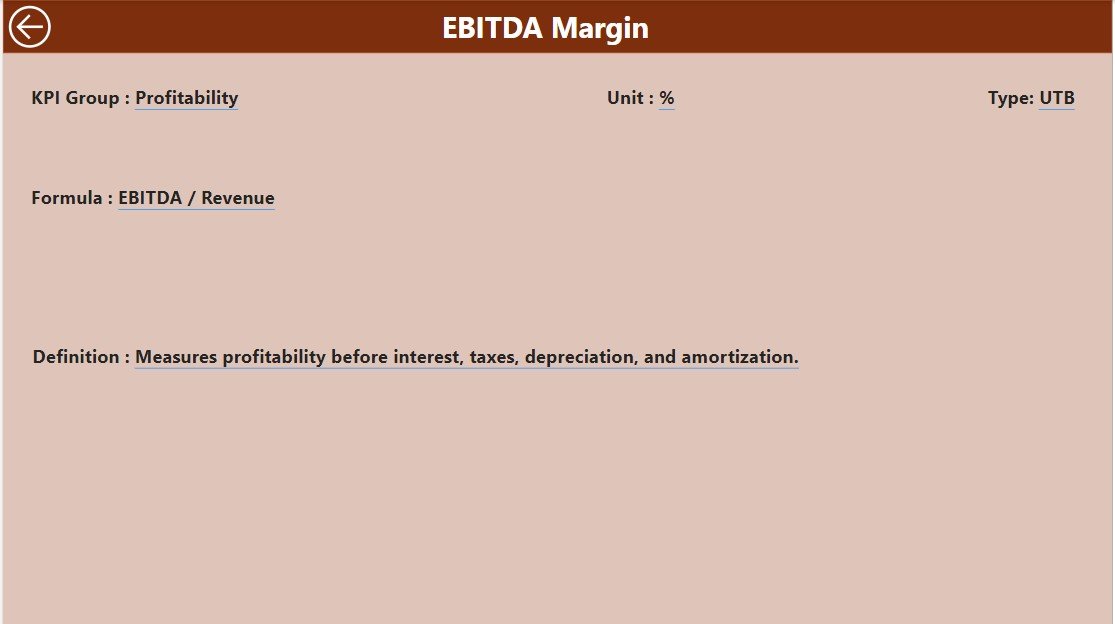
Stay up-to-date with real-time data tracking and dynamic visualizations. This Power BI dashboard allows you to interact with data, drill down into specific metrics, and gain deeper insights into portfolio performance.
📉 Customizable & Scalable
The dashboard is fully customizable to meet the specific needs of your private equity firm. Add, remove, or modify KPIs, data sources, and reports to match your unique business requirements.
Why You’ll Love the Private Equity KPI Dashboard in Power BI

✅ Optimize Portfolio Performance
Track key metrics and performance indicators to ensure your portfolio is optimized for growth. Identify underperforming assets and make data-driven decisions to improve returns.
✅ Evaluate Risk & Return Effectiveness
Evaluate risk-adjusted returns, internal rate of return (IRR), and other key risk metrics to ensure that your investments are providing the desired returns while managing risks effectively.
✅ Improve Investment Strategies
Use insights from deal flow, portfolio performance, and allocation metrics to adjust your investment strategies and allocate resources to the most profitable opportunities.
✅ Streamline Reporting & Analytics
Visualize complex financial data in an easy-to-understand format. Save time and improve accuracy by using interactive dashboards to generate performance reports and track KPIs in real time.
✅ Customizable for Your Needs
Whether you are a small investment firm or managing a large private equity portfolio, this Power BI dashboard is scalable and customizable to meet the specific needs of your business.
What’s Inside the Private Equity KPI Dashboard in Power BI?
- Portfolio Performance Tracker: Track fund performance, NAV, returns, and key asset allocation metrics.
- Risk & Return Metrics: Monitor IRR, cash-on-cash return, and risk-adjusted returns for each investment.
- Investment Activity Tracker: Keep track of investments, capital allocation, and deal flow for each investment.
- Real-Time Data & Interactive Visualizations: Access real-time data and dynamic, interactive dashboards to analyze portfolio performance.
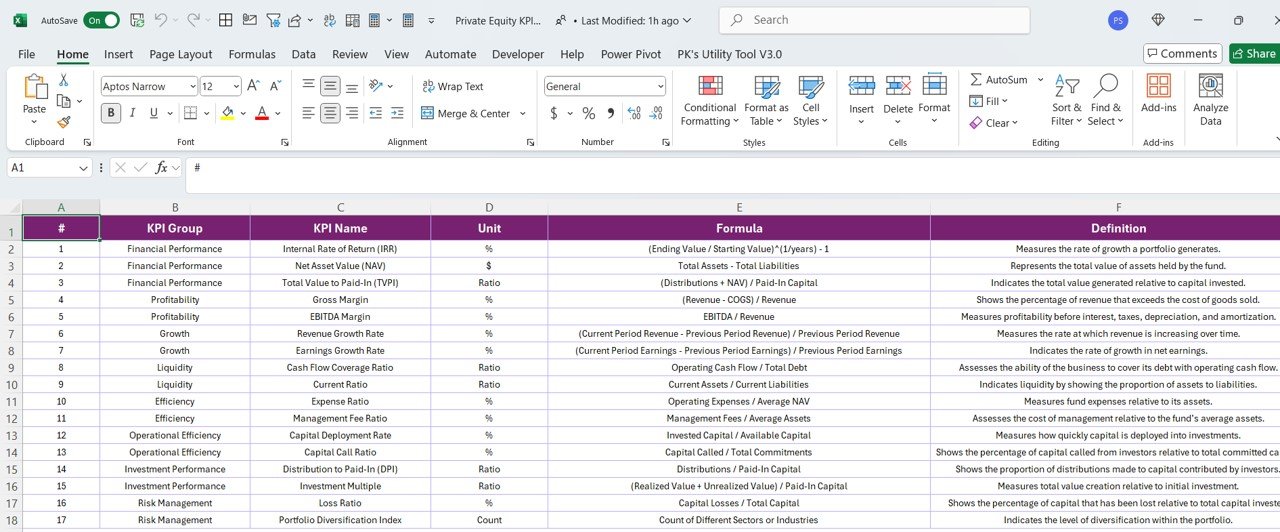
- Customizable KPIs & Reports: Modify KPIs and reports to fit your private equity firm’s specific needs.
- Visual Insights & Reporting: Use visualizations like charts and graphs to easily track and analyze portfolio performance.
How to Use the Private Equity KPI Dashboard in Power BI
1️⃣ Download the Template: Instantly access the Private Equity KPI Dashboard in Power BI.
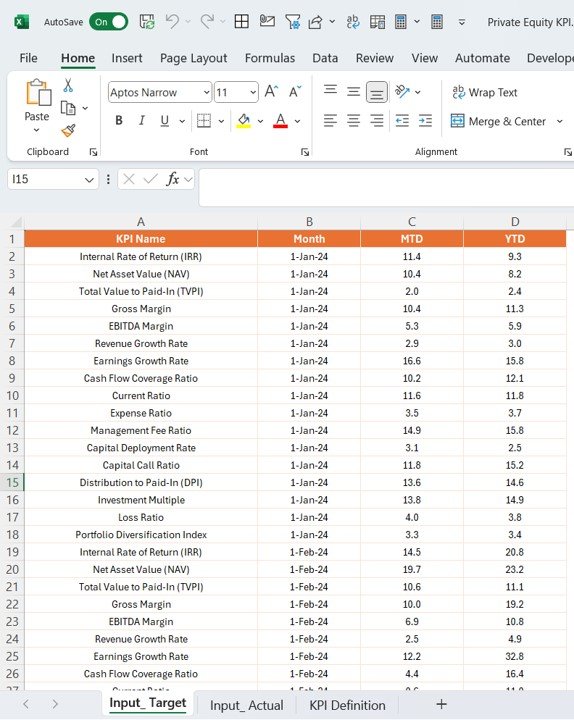
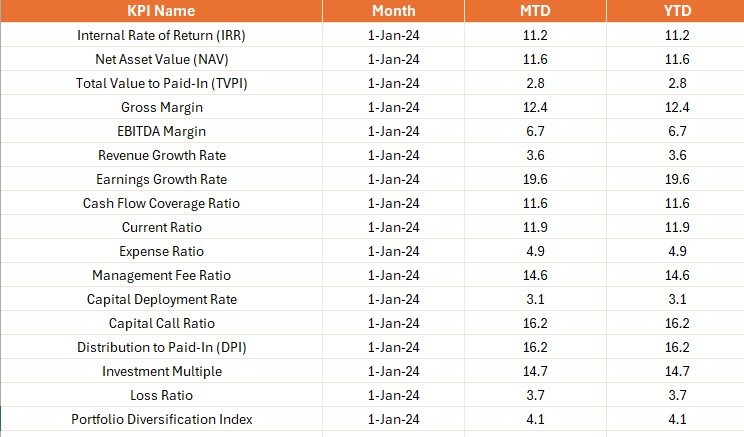
2️⃣ Input Your Investment Data: Enter key investment data such as fund performance, returns, and portfolio details.
3️⃣ Track Portfolio Performance: Monitor performance, asset allocation, and deal flow to keep your portfolio optimized.
4️⃣ Analyze Risk & Return: Use the risk and return metrics to evaluate the profitability of your investments.
5️⃣ Generate Reports & Insights: Visualize performance and generate reports to make informed investment decisions.
Who Can Benefit from the Private Equity KPI Dashboard in Power BI?
🔹 Private Equity Firms
🔹 Investment Managers & Analysts
🔹 Financial Consultants & Advisors
🔹 Portfolio Managers
🔹 Venture Capital Firms
🔹 Fund Managers & Financial Institutions
Optimize your private equity portfolio, track performance, and make informed investment decisions with the Private Equity KPI Dashboard in Power BI. Use real-time data to manage risk, assess returns, and maximize profitability.
Click here to read the Detailed blog post
Visit our YouTube channel to learn step-by-step video tutorials
Youtube.com/@PKAnExcelExpert


Reviews
There are no reviews yet.