
Managing financial performance should not feel complicated. Yet many businesses still depend on disconnected spreadsheets, manual calculations, and time-consuming reports. Every day, organizations generate revenue data, expense records, budgets, and profit figures — but without proper visualization, this information fails to deliver real value.
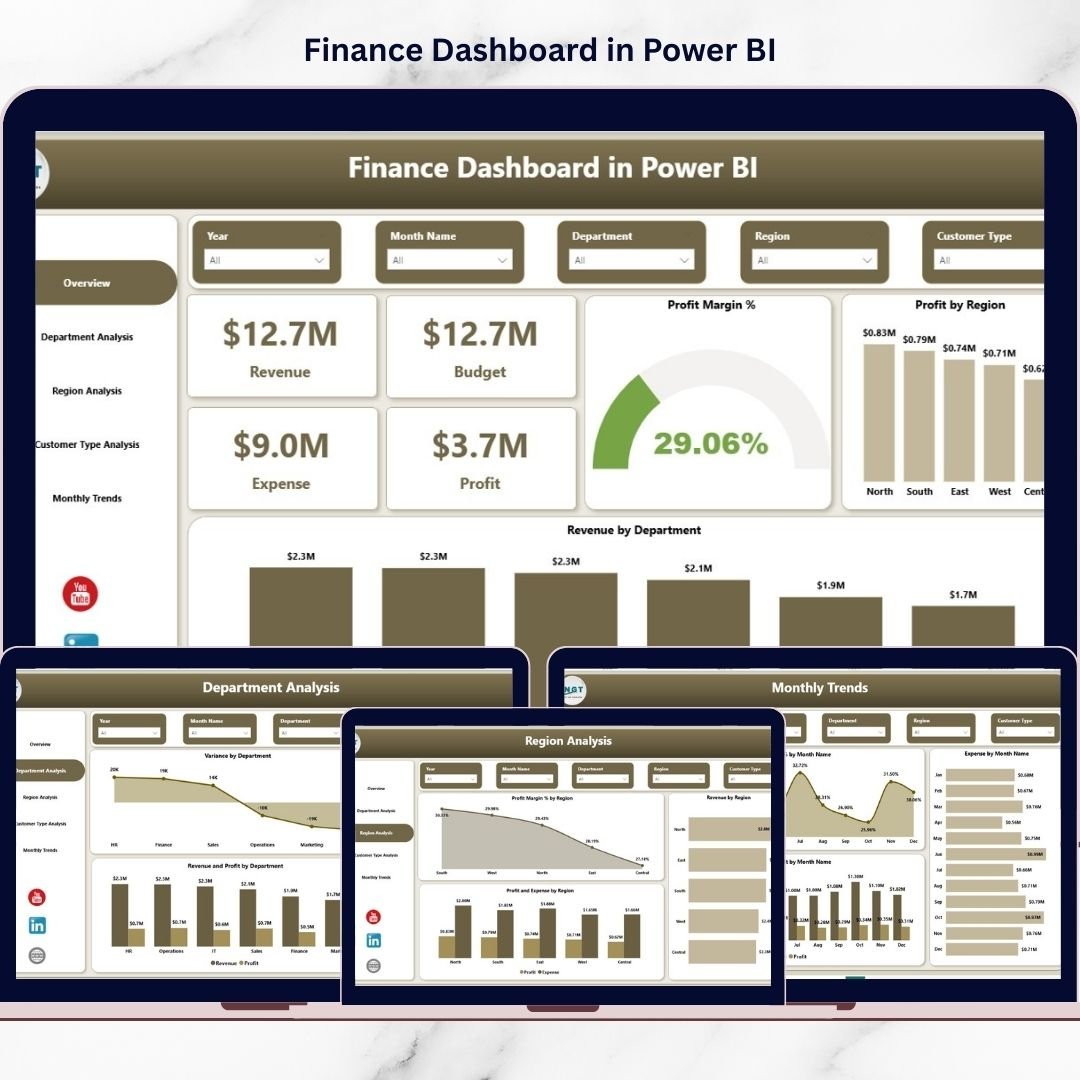
The Finance Dashboard in Power BI transforms complex financial data into clear, interactive insights that help businesses monitor performance instantly. Instead of spending hours preparing financial reports, decision-makers can analyze profitability, track budgets, and evaluate trends using dynamic visuals and automated analytics.
Designed for modern organizations, this ready-to-use dashboard provides a centralized financial monitoring system that improves visibility, speeds up decision-making, and enhances strategic planning.
🚀 Key Feature of Finance Dashboard in Power BI
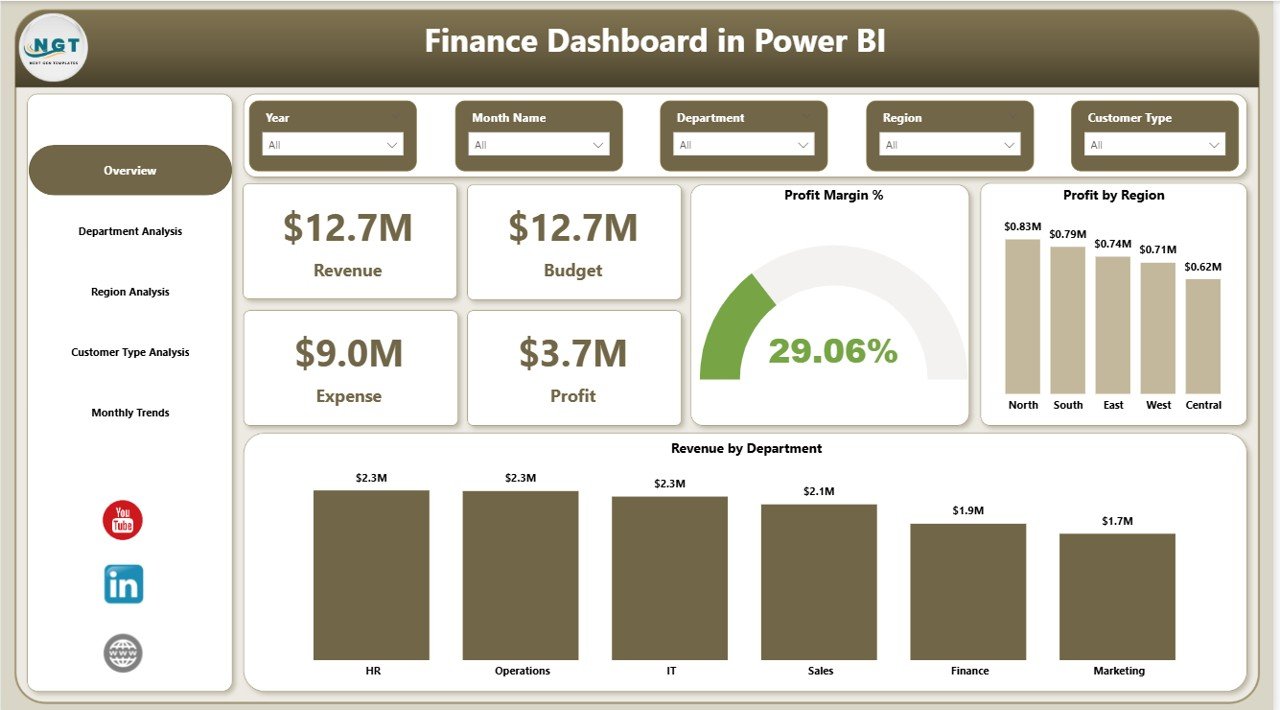
📊 Interactive Financial Overview
Monitor Revenue, Budget, Expense, and Profit through KPI cards that instantly display financial performance.
🌍 Region Performance Analysis
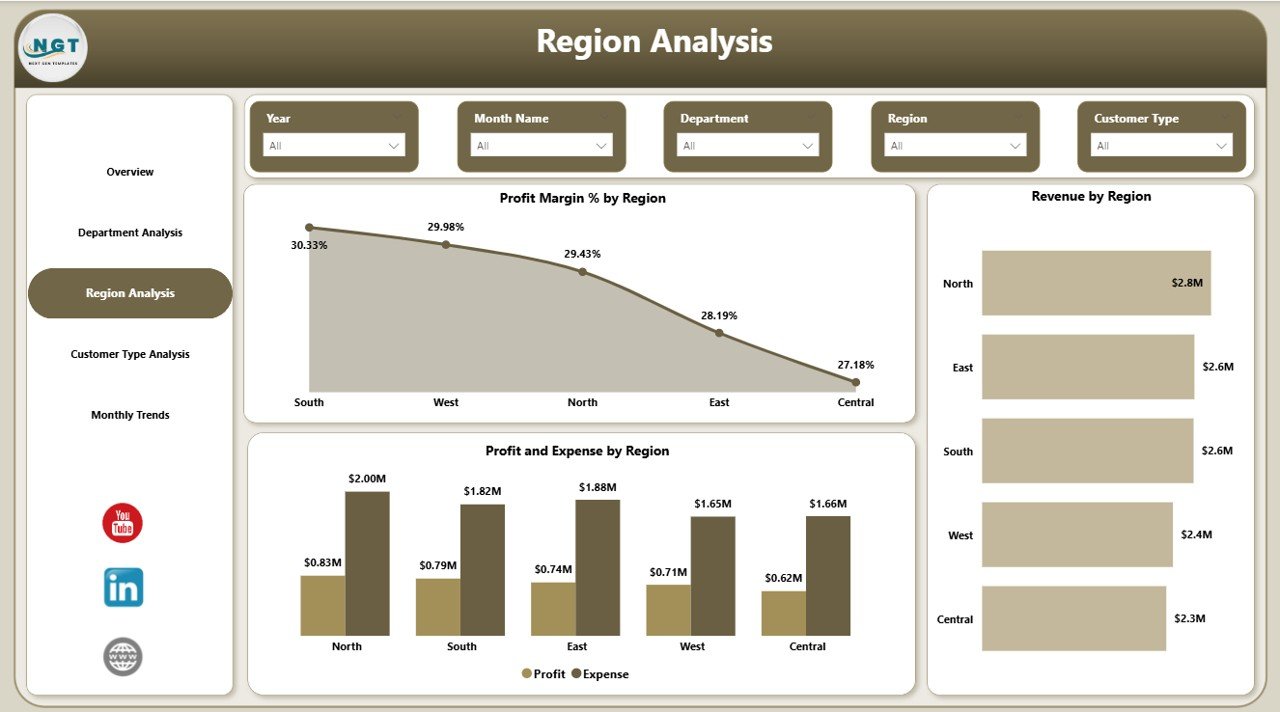
Identify profitable markets and control regional spending using detailed financial comparisons.
🏢 Department-Level Insights
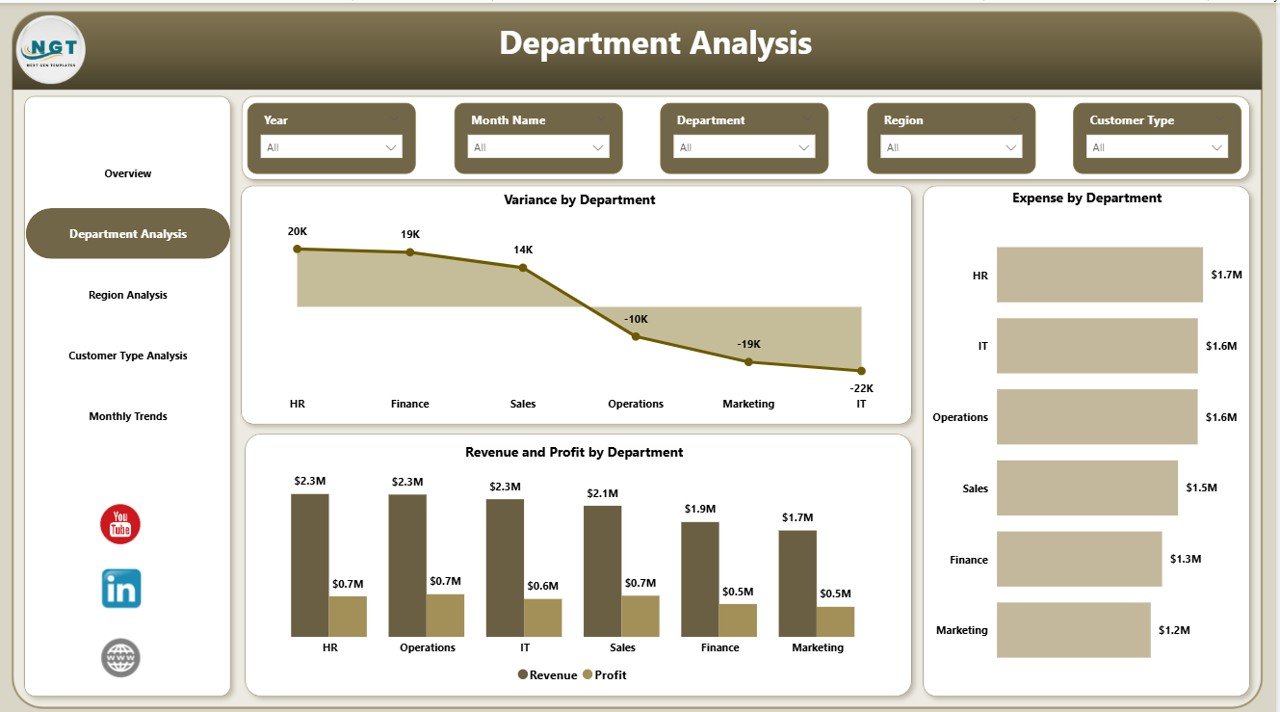
Analyze revenue contribution, expenses, and variance by department to improve operational efficiency.
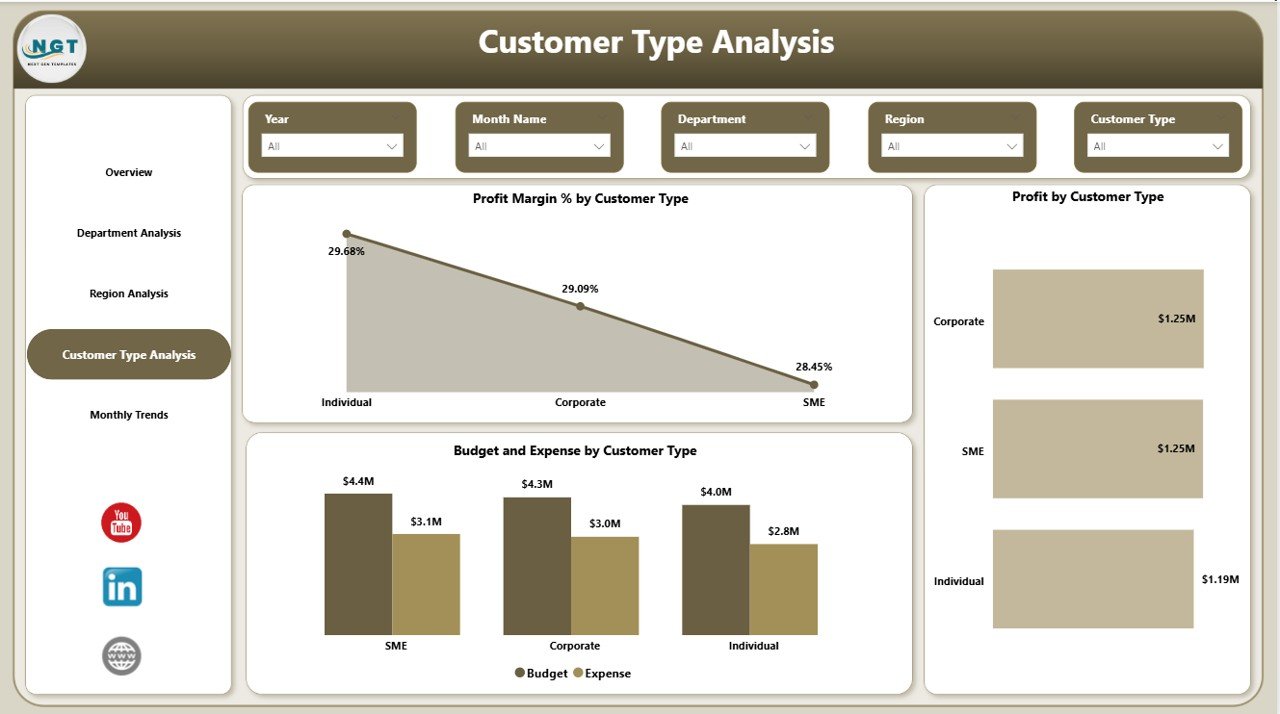
👥 Customer Type Profitability Tracking
Understand which customer segments generate the highest value and optimize business strategies.
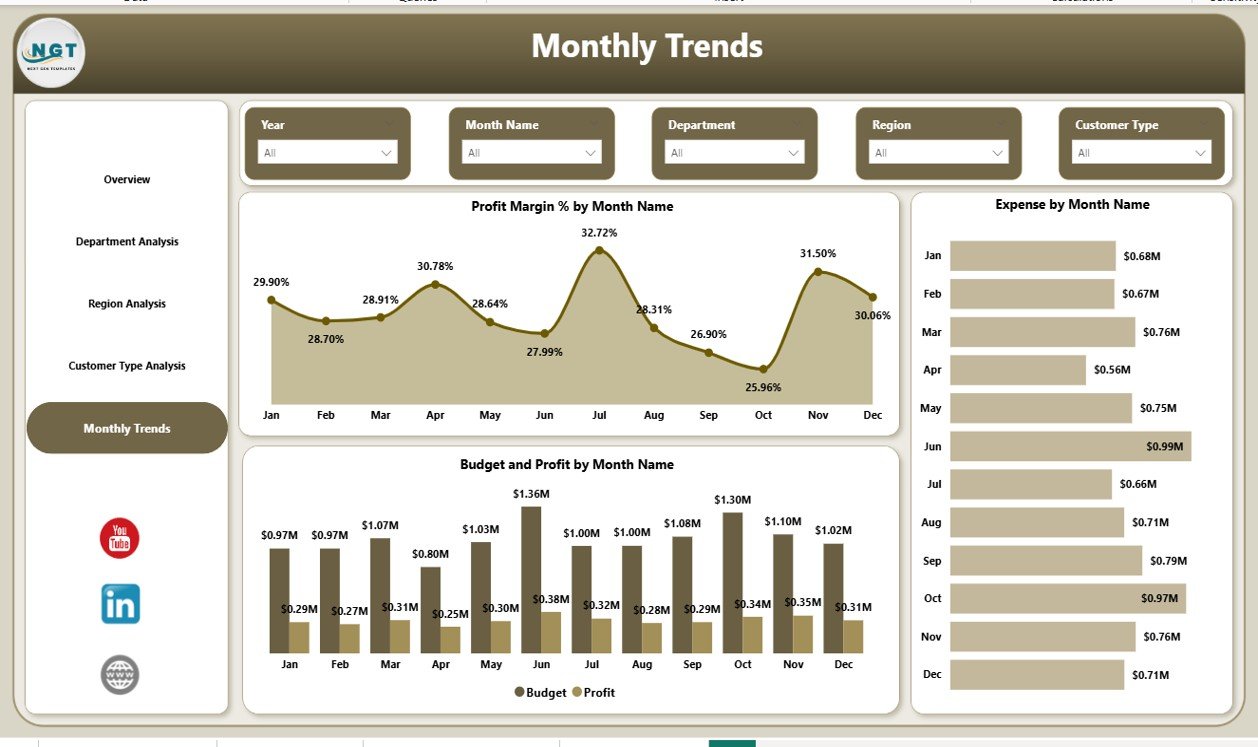
📅 Monthly Financial Trend Analysis
Track profit margins, expenses, and budget performance over time for accurate forecasting.
⚡ Dynamic Filters & Slicers
Explore data interactively and drill down into details without technical expertise.
📈 Automated Financial Reporting
Eliminate manual reporting and gain real-time insights powered by Power BI analytics.
📦 What’s Inside the Finance Dashboard in Power BI
When you download this product, you receive a professionally designed Power BI dashboard file structured into five powerful analytical pages:
✅ Overview Page – High-level financial snapshot with KPI cards and performance charts.
✅ Department Analysis – Compare revenue, profit, and expenses across departments.
✅ Region Analysis – Evaluate financial growth and profitability by region.
✅ Customer Type Analysis – Measure customer profitability and budget efficiency.
✅ Monthly Trends Page – Analyze financial performance patterns over time.
Each page is carefully designed to answer specific business questions and support faster executive decisions.
🛠️ How to Use the Finance Dashboard in Power BI
Using this dashboard is simple and user-friendly:
1️⃣ Import your financial data into Power BI.
2️⃣ Connect datasets such as revenue, expenses, budgets, and departments.
3️⃣ Refresh the dashboard to update visuals automatically.
4️⃣ Use slicers and filters to explore performance insights.
5️⃣ Present interactive financial reports to stakeholders instantly.
No advanced technical knowledge is required — the dashboard is designed for business users, managers, and analysts alike.
🎯 Who Can Benefit from This Finance Dashboard in Power BI
💼 Finance Teams – Monitor budgets, expenses, and profitability efficiently.
👔 Executives & Business Leaders – Gain real-time visibility into financial health.
🏢 Department Managers – Control costs and evaluate operational performance.
📊 Business Analysts – Discover trends and support data-driven decisions.
🚀 Startups & Growing Businesses – Build structured financial monitoring systems quickly.
Whether you run a small business or a large enterprise, this dashboard helps convert financial data into actionable intelligence.
A well-designed finance dashboard does more than show numbers — it tells the story behind your business performance. By combining automation, visualization, and interactive analytics, this Power BI solution enables smarter planning, improved budget control, and stronger profitability analysis.
Stop relying on static reports and start making confident financial decisions backed by real-time insights.
Click here to read the Detailed blog post
Watch the step-by-step video tutorial:
Visit our YouTube channel to learn step-by-step video tutorials
https://youtube.com/@PKAnExcelExpert
Compatibility and Requirements
- Works in Power BI Desktop, which is free to download. You open the dashboard file there and connect your own financial data.
- Microsoft explains the setup in Get Power BI Desktop.
Frequently Asked Questions
Which pages are included?
Five pages: Overview, Department Analysis, Region Analysis, Customer Type Analysis and Monthly Trends.
What does the Overview page show?
KPI cards for Revenue, Budget, Expense and Profit, plus performance charts.
How do I use my own data?
Import your revenue, expense, budget and department data into Power BI, then refresh the dashboard so the visuals update.
Can I filter the data?
Yes. The dashboard has slicers and filters, so you can drill into details by department, region, customer type and month.
Is there an Excel version?
Yes. See the Finance Dashboard in Excel.
Related Finance Templates
- Finance KPI Dashboard in Power BI: a KPI-focused finance view in Power BI
- Finance Dashboard in Excel: the same topic in Excel
- Finance KPI Dashboard in Google Sheets: a Google Sheets option
- Personal Finance Dashboard in Power BI: for personal income and spending
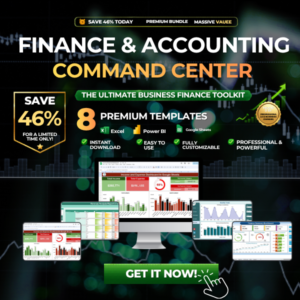
- Finance & Accounting Command Center: 8 templates for Excel, Power BI and Google Sheets in one download
Browse all Power BI dashboards.