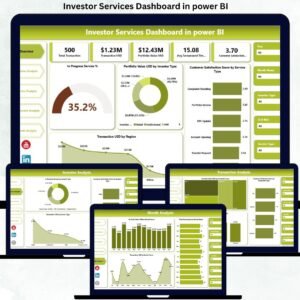
Managing investor services without real-time visibility often leads to delayed responses, operational inefficiencies, and dissatisfied investors. In today’s fast-moving financial landscape, investment firms, asset managers, and wealth management companies must deliver accurate, timely, and transparent investor services. That is exactly where the Investor Services Dashboard in Power BI becomes a game-changing solution.
This ready-to-use Investor Services Dashboard in Power BI transforms scattered operational and financial data into clear, interactive, and actionable insights. Instead of relying on multiple Excel sheets, emails, or static reports, organizations gain a single centralized dashboard to monitor service performance, transaction values, profitability, portfolio movement, and investor satisfaction.
Built using Power BI for visualization and analytics, this dashboard helps teams respond faster, improve service quality, and strengthen investor relationships—without complex tools or heavy manual effort.
⭐ Key Features of Investor Services Dashboard in Power BI
This dashboard is designed specifically for real-world investor servicing operations.
📊 Centralized Investor Services Monitoring – All KPIs in one dashboard
👥 Investor-Type Analysis – Retail, Institutional, HNI performance tracking
🔧 Service-Level Performance Visibility – Identify service bottlenecks quickly
💰 Transaction & Portfolio Value Tracking – Financial clarity at all times
😊 Customer Satisfaction Monitoring – Improve investor experience
📈 Monthly Trend Analysis – Track growth and seasonality
🎛️ Interactive Power BI Slicers – Instant drill-down by region, service, or investor
⚡ Faster Decision-Making – Replace static reports with live insights
📦 Dashboard Structure – Page-Wise Explanation
The Investor Services Dashboard in Power BI includes five structured analytical pages, each answering critical business questions.
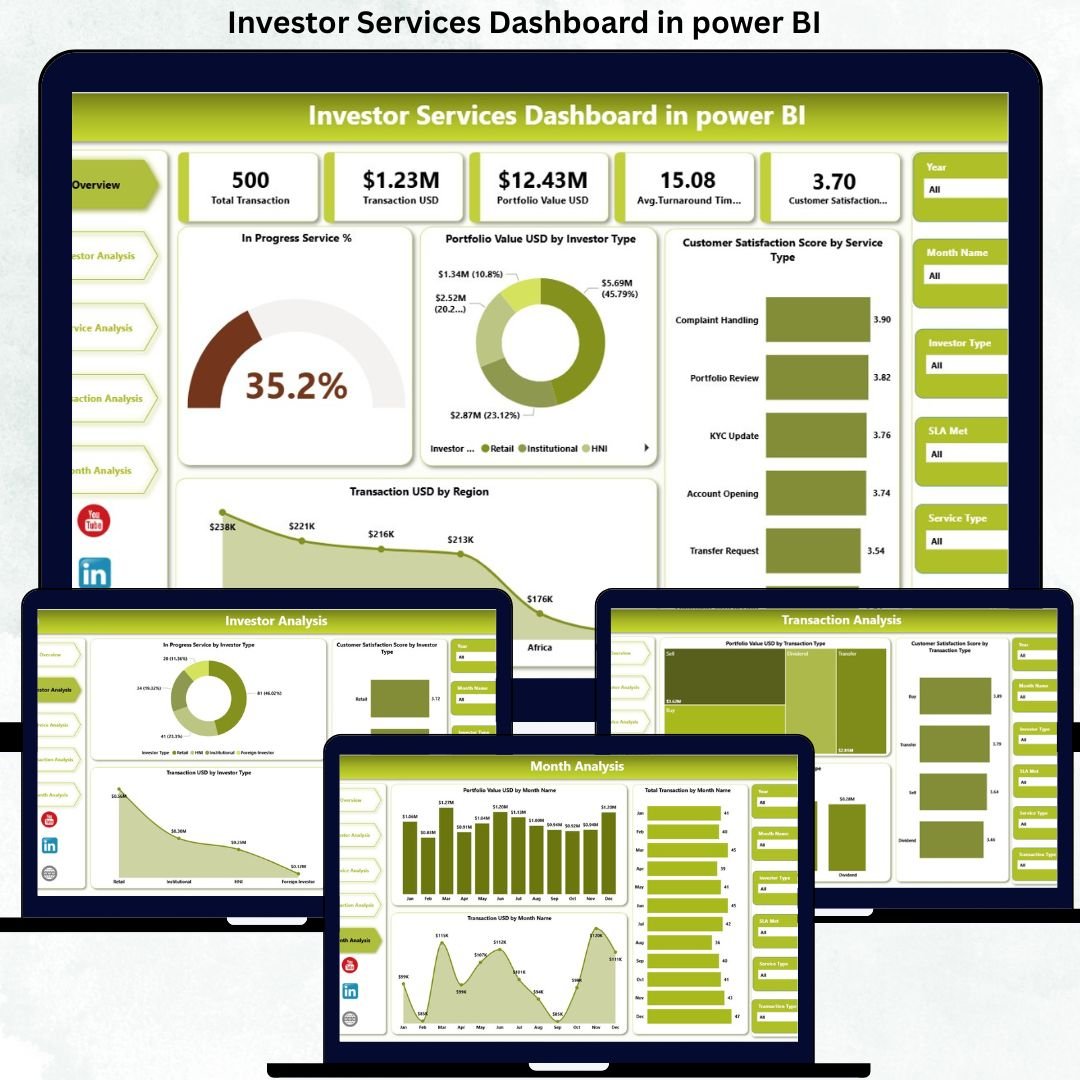
🏠 Overview Page – Complete Investor Services Snapshot
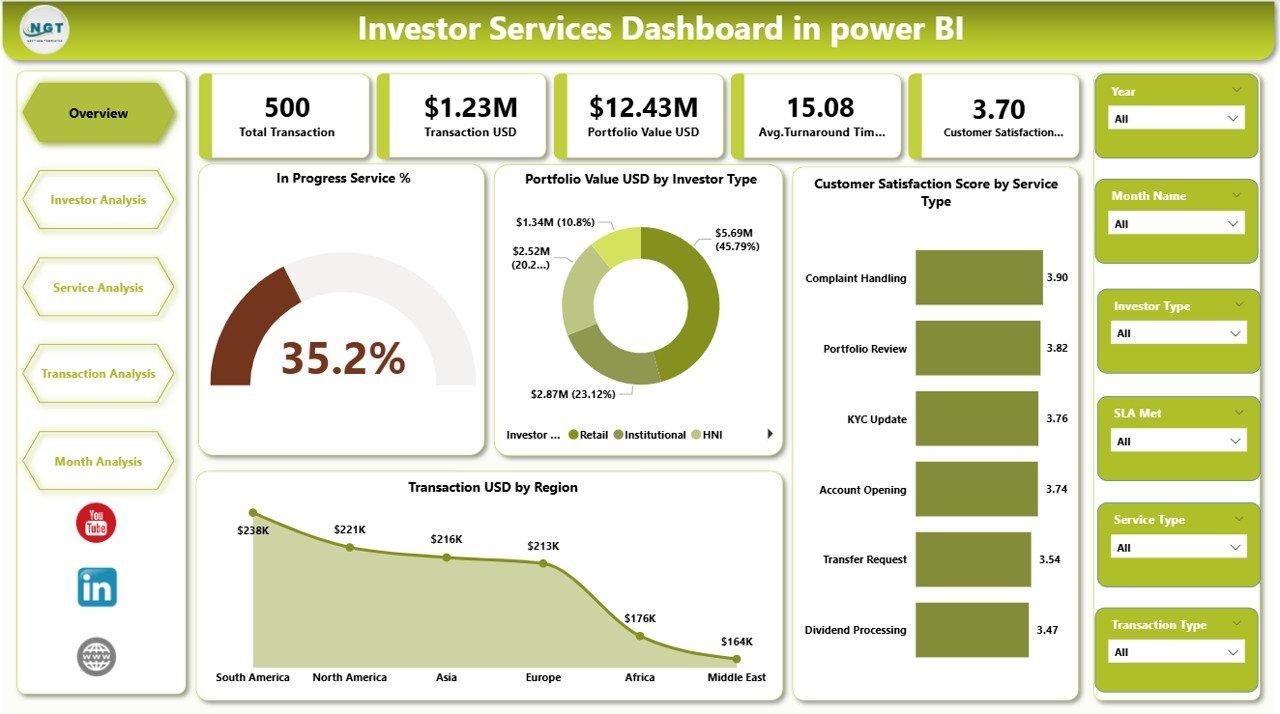
The Overview Page acts as the command center of the dashboard.
🎛️ Slicers
Month
Investor Type
Service Type
Region
📌 KPI Cards
In Progress Service %
Profit Value (USD)
Customer Satisfaction Score
Total Transaction Value (USD)
📊 Key Charts
In Progress Service % by Service Type
Profit Value USD by Investor Type
Customer Satisfaction Score by Service Type
Transaction USD by Region
This page enables leadership to instantly understand workload, profitability, satisfaction, and regional performance.
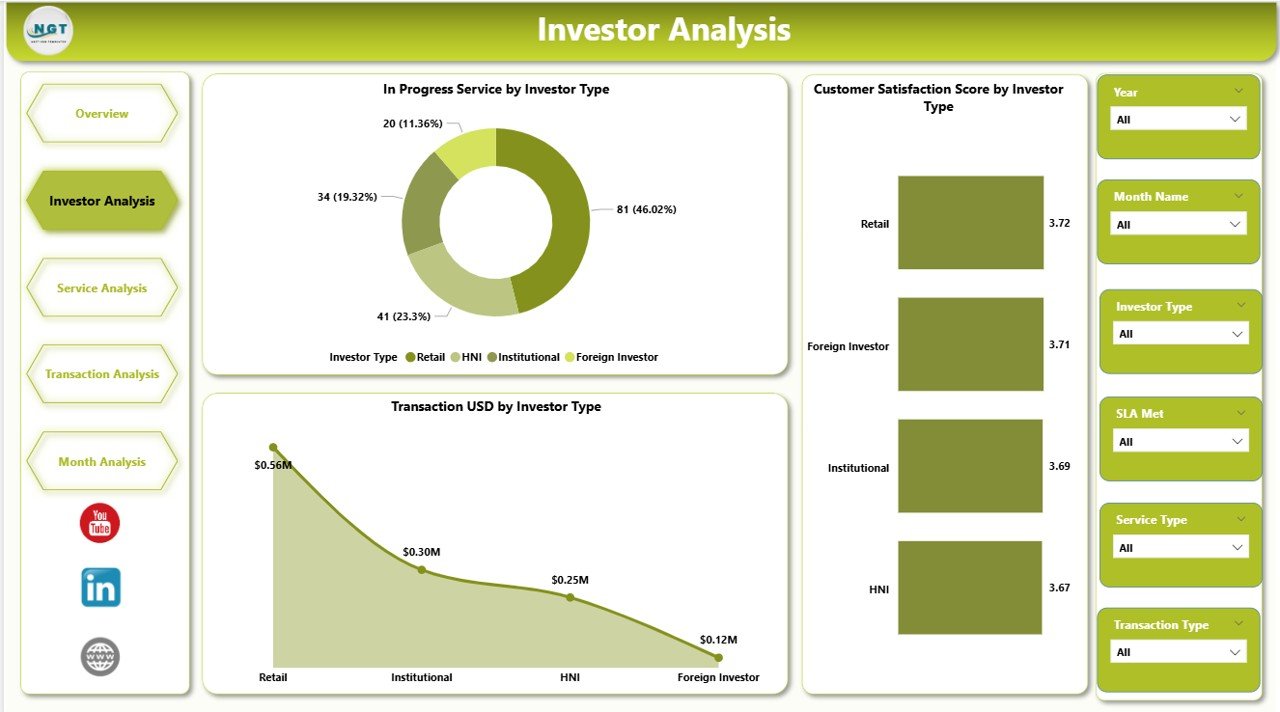
👥 Investor Analysis Page – Segment-Wise Performance
This page analyzes investor services across different investor categories.
📊 Charts Included
In Progress Service by Investor Type
Customer Satisfaction Score by Investor Type
Transaction Value (USD) by Investor Type
🎯 Business Value
Identify high-value investor segments
Detect service delays by investor type
Improve targeted service strategies
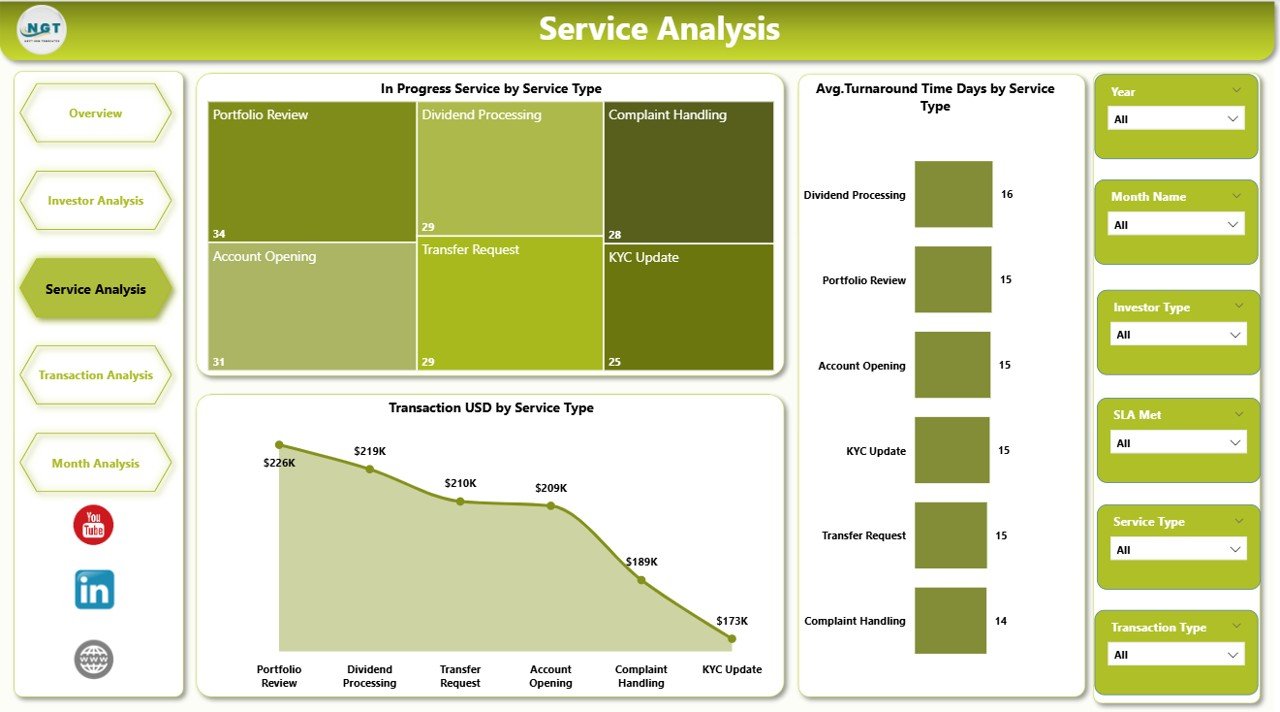
🔧 Service Analysis Page – Operational Efficiency Insights
The Service Analysis Page focuses on service-level performance.
📊 Charts Included
In Progress Service by Service Type
Average Turnaround Time (Days) by Service Type
Transaction Value (USD) by Service Type
This page helps teams reduce turnaround time, improve service quality, and manage workload effectively.
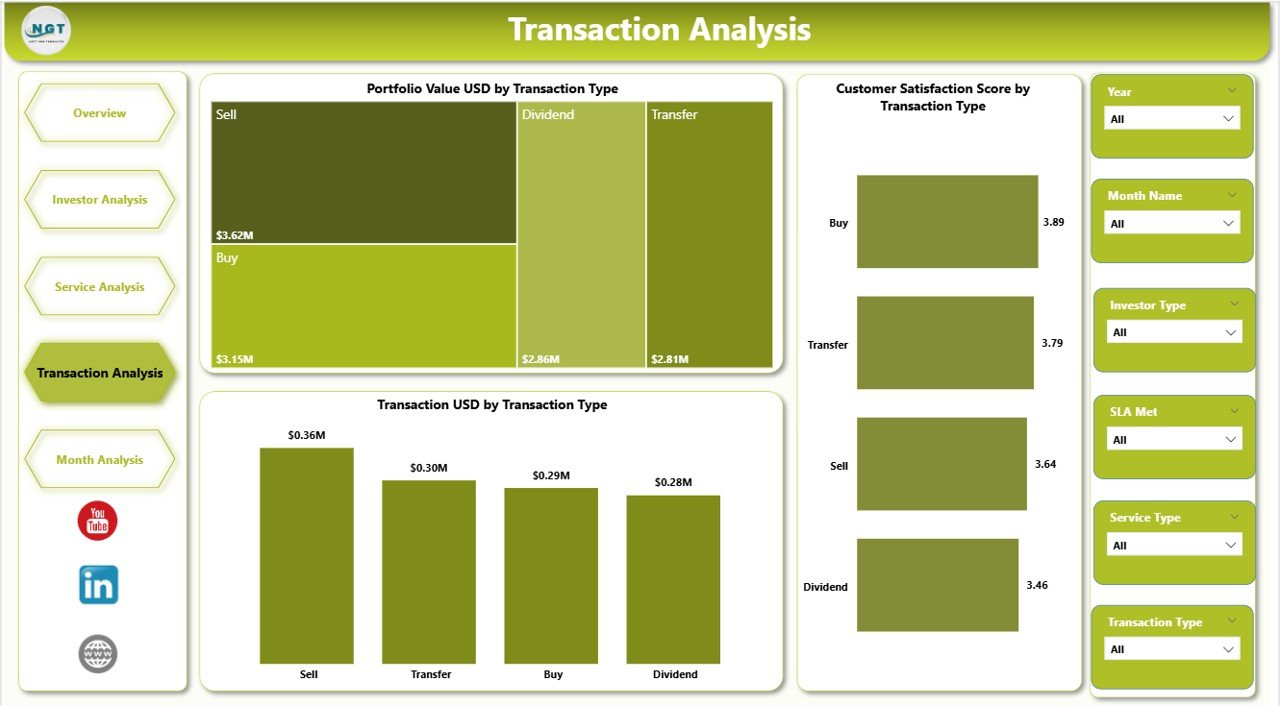
💼 Transaction Analysis Page – Portfolio & Transaction Visibility
The Transaction Analysis Page provides deeper insight into transaction behavior.
📊 Charts Included
Portfolio Value (USD) by Transaction Type
Customer Satisfaction Score by Transaction Type
Transaction Value (USD) by Transaction Type
As a result, finance and investment teams gain better control over transaction performance and portfolio movement.
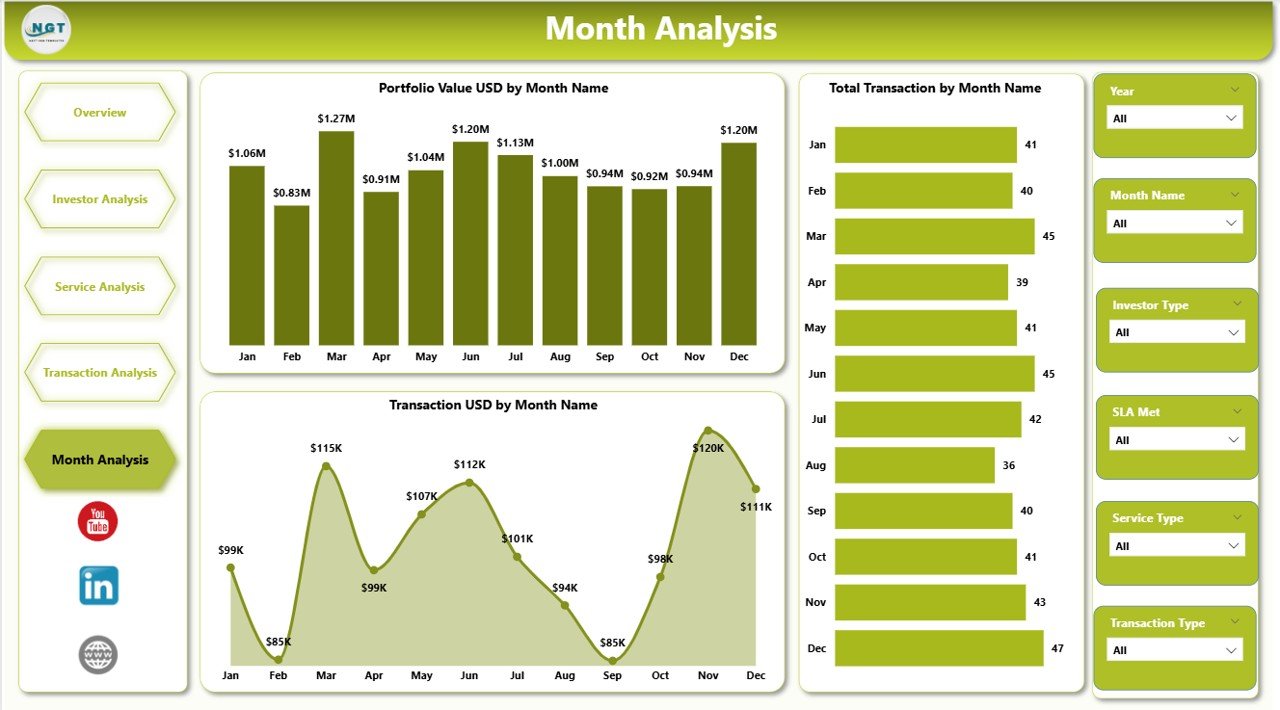
📅 Monthly Trends Page – Performance Over Time
The Monthly Trends Page tracks how investor services evolve month by month.
📊 Charts Included
Portfolio Value (USD) by Month
Total Transactions by Month
Transaction Value (USD) by Month
Trend analysis supports forecasting, capacity planning, and growth tracking.
⚙️ How to Use the Investor Services Dashboard
1️⃣ Update service and transaction data
2️⃣ Refresh the Power BI dashboard
3️⃣ Apply slicers to analyze by investor, service, or region
4️⃣ Review KPIs, trends, and charts
5️⃣ Take faster, data-driven actions
No advanced Power BI skills required.
👤 Who Should Use This Dashboard
Investment Firms
Asset Management Companies
Wealth Management Providers
Investor Relations Teams
Portfolio Managers
Finance & Operations Teams
Any organization managing investor services will benefit immediately.
📺 Visit our YouTube channel to learn step-by-step video tutorials
👉 https://youtube.com/@PKAnExcelExpert