In today’s competitive and multi-channel business environment, organizations rarely rely on a single sales route. Sales often flow through distributors, partners, resellers, online channels, and direct sales teams. However, when performance data remains scattered across multiple systems and reports, understanding true channel profitability becomes difficult.
That is exactly where the Channel Sales Dashboard in Power BI becomes a powerful business solution.
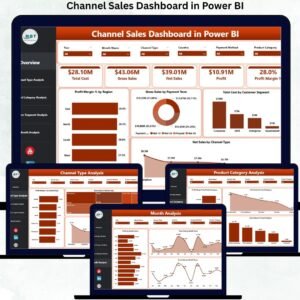
The Channel Sales Dashboard in Power BI is a ready-to-use, interactive analytics dashboard designed to give sales leaders, channel managers, finance teams, and executives complete visibility into channel performance, profitability, cost behavior, and sales trends—all in one centralized Power BI report.
Instead of reviewing multiple Excel files or static MIS reports, this dashboard converts raw sales data into clear KPIs, interactive visuals, and actionable insights. As a result, decision-makers can instantly identify high-performing channels, cost-heavy segments, margin drivers, and growth opportunities.
✅ What This Channel Sales Dashboard Solves
Organizations commonly face these challenges in channel sales:
Lack of visibility across indirect and direct sales channels
Difficulty comparing profitability by region, product, or customer segment
Delayed reporting and manual data consolidation
Unclear cost impact on channel margins
This dashboard eliminates these issues by providing real-time, visual, and data-driven channel insights.
📊 Pages & Analysis Included in the Dashboard
This Channel Sales Dashboard in Power BI includes 5 professionally designed analytical pages, each answering a critical business question.
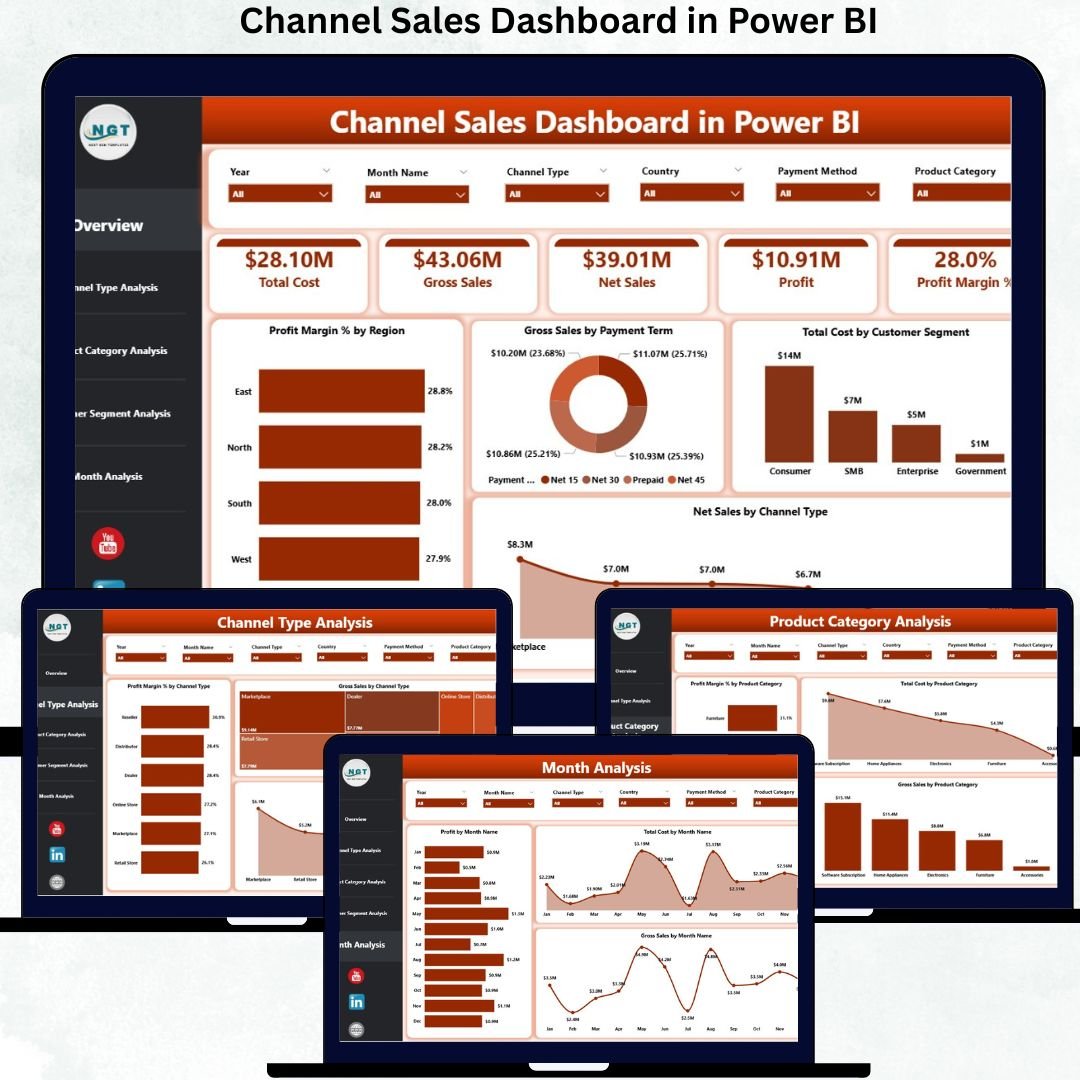
🔹 1. Overview Page
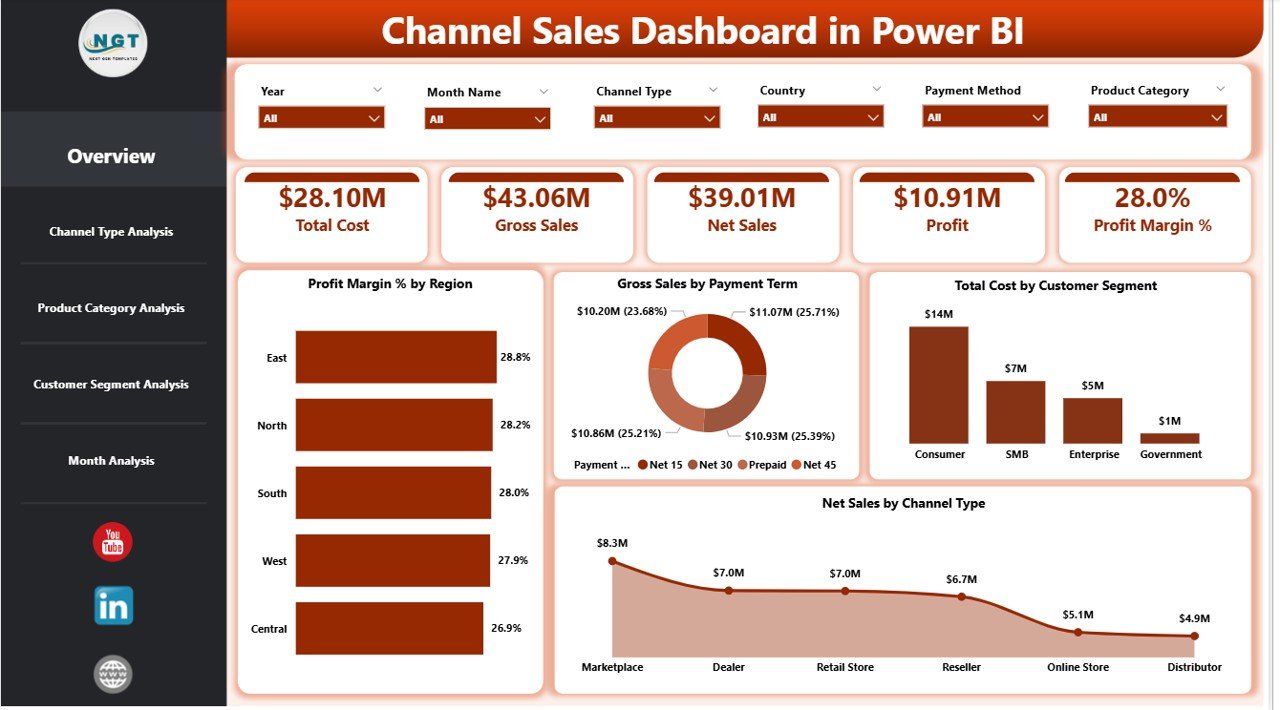
Acts as the executive snapshot of channel sales performance.
Key KPIs & Charts
Profit Margin % by Region
Gross Sales by Payment Term
Total Cost by Customer Segment
Net Sales by Channel Type
This page gives leadership instant clarity on overall performance.
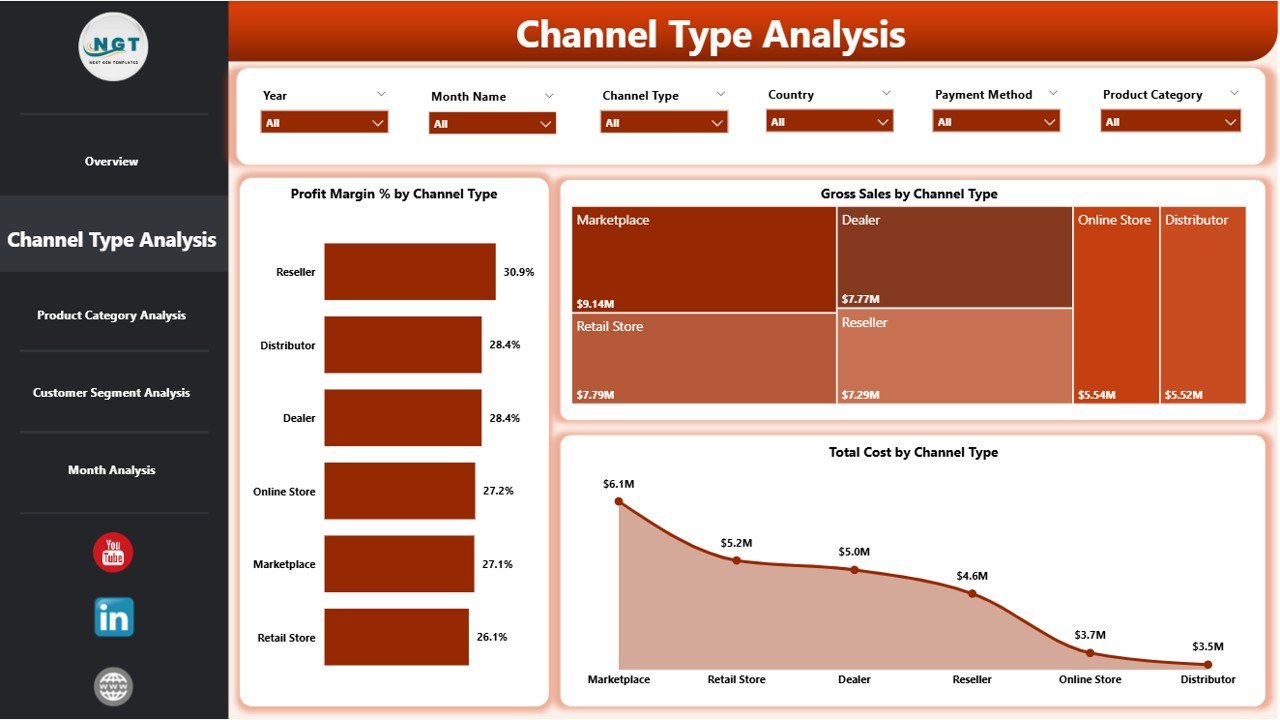
🔹 2. Channel Type Analysis
Compares performance across sales channels such as Direct, Distributor, Reseller, and Online.
Insights Included
Profit Margin % by Channel Type
Gross Sales by Channel Type
Total Cost by Channel Type
Helps optimize channel strategy and resource allocation.
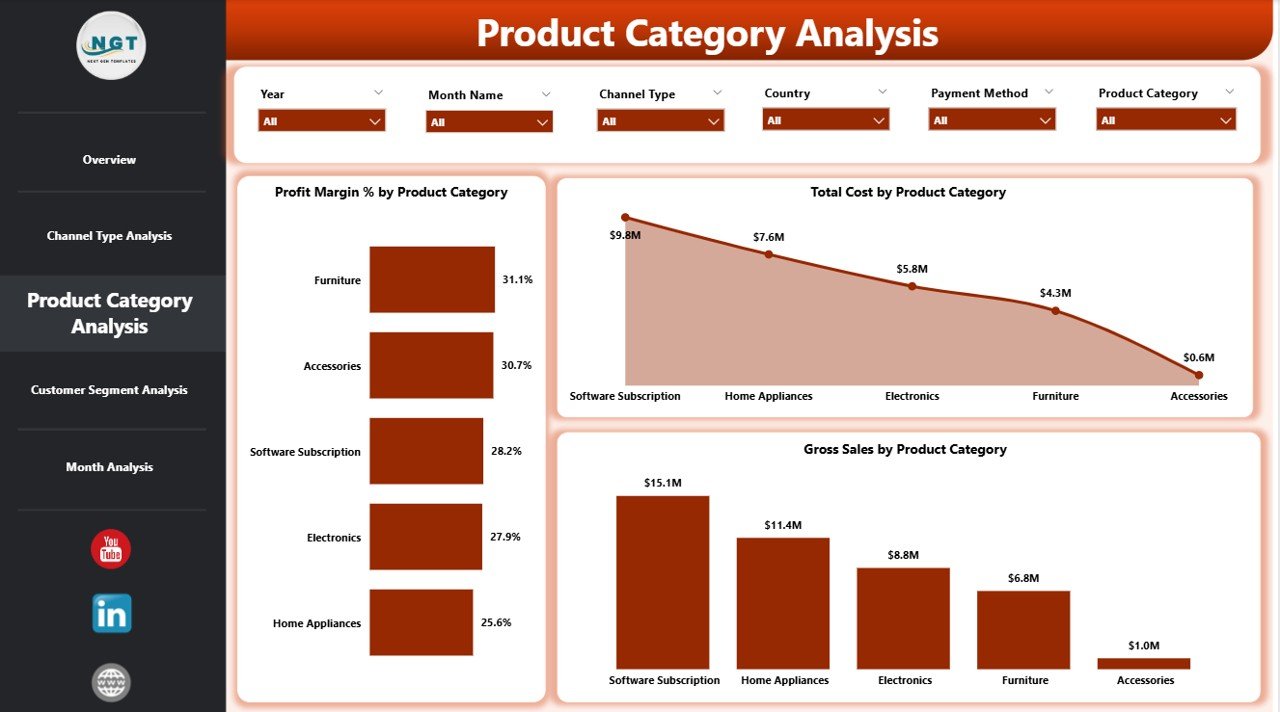
🔹 3. Product Category Analysis
Analyzes how different product categories perform across channels.
Key Metrics
Profit Margin % by Product Category
Gross Sales by Product Category
Total Cost by Product Category
Supports better pricing, product focus, and promotion planning.
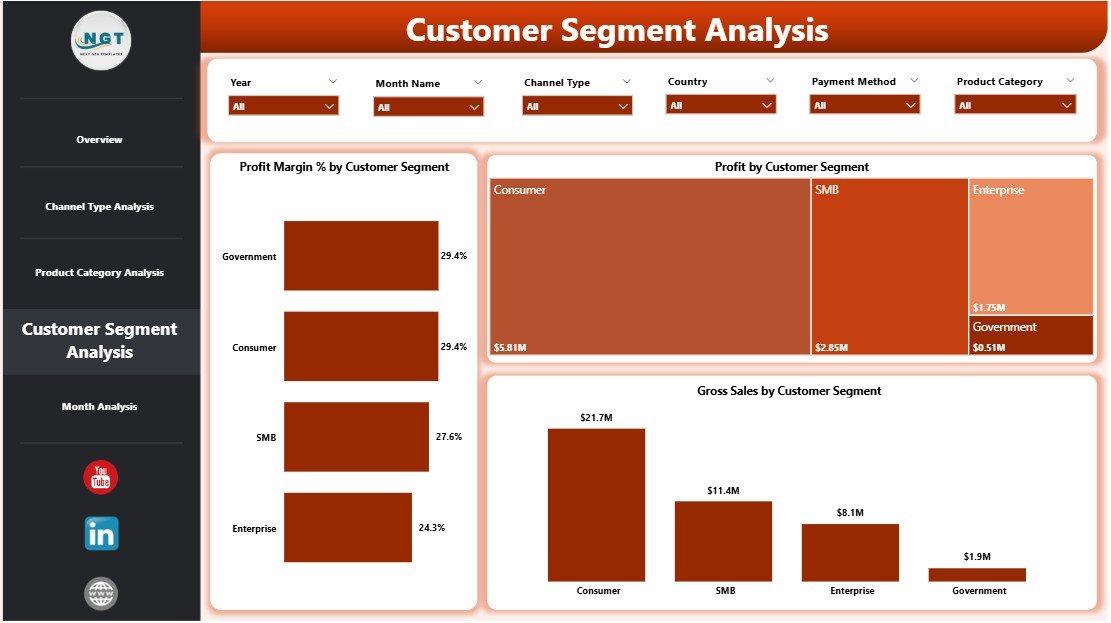
🔹 4. Customer Segment Analysis
Evaluates profitability and revenue by customer segments.
Key Analysis
Profit Margin % by Customer Segment
Gross Sales by Customer Segment
Profit by Customer Segment
Helps design targeted sales and discount strategies.
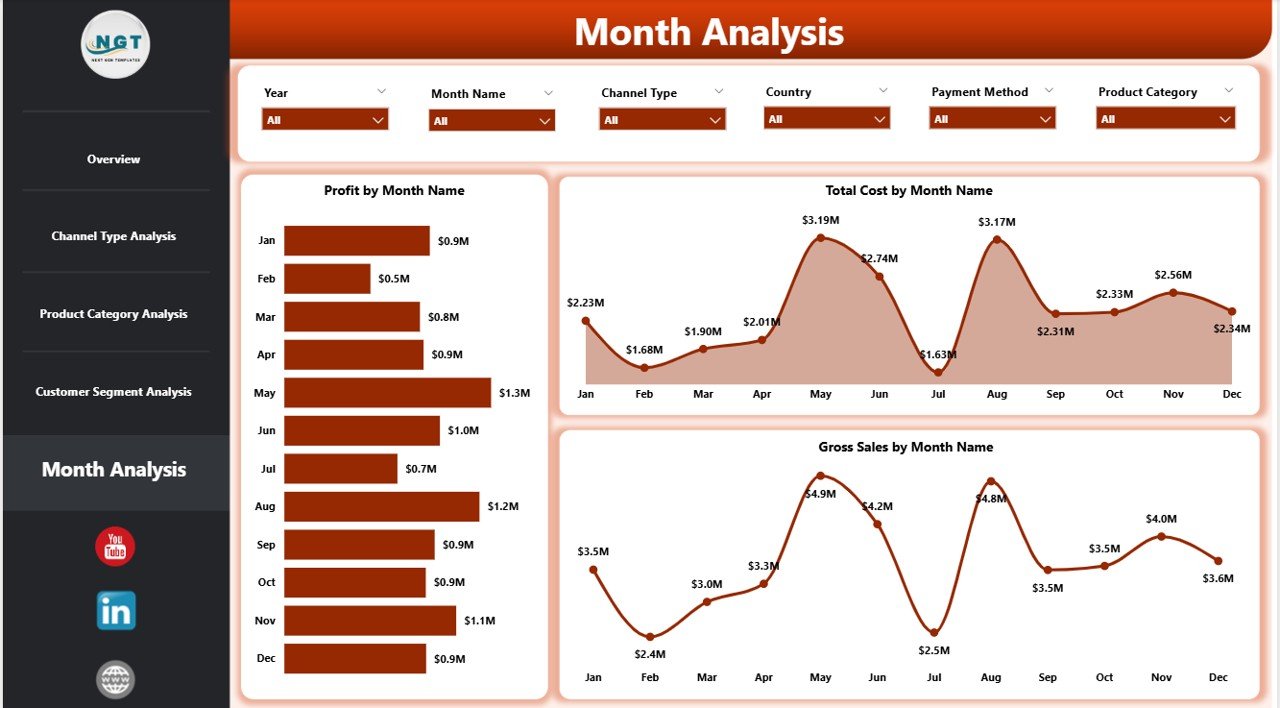
🔹 5. Monthly Trends Page
Tracks how sales, cost, and profit change over time.
Trend Charts
Profit by Month
Gross Sales by Month
Total Cost by Month
Ideal for forecasting, budgeting, and performance reviews.
🎯 Key Features of the Dashboard
✅ Fully interactive Power BI visuals
✅ Dynamic slicers for time, region, channel, product & customer
✅ Clean and executive-ready design
✅ Real-time filtering and drill-down analysis
✅ Scalable structure for future growth
✅ Easy Excel, ERP, or CRM data integration
No heavy technical skills required.
👥 Who Should Use This Dashboard
Channel Sales Managers
Sales Directors & VPs
Business & Data Analysts
Finance & Revenue Teams
Strategy & Planning Teams
CEOs & Senior Leadership
Any organization managing multi-channel sales models can benefit.
💡 Why This Dashboard Matters
✅ Centralizes channel performance in one view
✅ Improves profitability analysis
✅ Enables faster, confident decisions
✅ Reduces manual reporting effort
✅ Aligns sales, finance, and strategy teams
This dashboard turns channel sales data into actionable business intelligence.
📘 Click here to read the detailed blog post
🎥 Visit our YouTube channel for step-by-step tutorials
👉 https://youtube.com/@PKAnExcelExpert