Broadcasting Dashboard businesses operate in a fast-moving and highly competitive environment. Every single day, broadcasters manage multiple channels, programs, advertisers, regions, languages, and time slots. At the same time, they must track advertisement revenue, aired broadcasts, and operational efficiency. However, when data remains scattered across spreadsheets or static reports, visibility drops quickly. As a result, decisions become reactive instead of strategic.
That is exactly where a Broadcasting Dashboard in Power BI becomes a powerful and essential solution.
This ready-to-use Broadcasting Dashboard in Power BI transforms raw broadcasting data into clear, interactive, and actionable insights. Instead of manually preparing reports, broadcasting teams can instantly monitor revenue trends, broadcast efficiency, channel performance, and advertiser contribution—all in one centralized Power BI dashboard.
Because the dashboard is built using Microsoft Power BI, it supports dynamic slicers, interactive visuals, and real-time updates. As a result, users explore data visually, drill into details, and identify performance gaps quickly. Whether you manage a single channel or a large broadcasting network, this dashboard delivers speed, clarity, and control.
📊 Key Features of Broadcasting Dashboard in Power BI
📺 Interactive Power BI broadcasting analytics
💰 Advertisement revenue tracking
📈 Aired broadcast performance monitoring
🎛️ Dynamic slicers for instant filtering
📡 Channel, program & advertiser analysis
🕒 Time-slot and monthly trend insights
📍 Region-wise revenue visibility
🚀 Scalable, professional, and decision-ready design
🗂️ Dashboard Pages Explained in Detail
This Broadcasting Dashboard in Power BI includes 5 structured analytical pages, each designed to answer a specific business question.
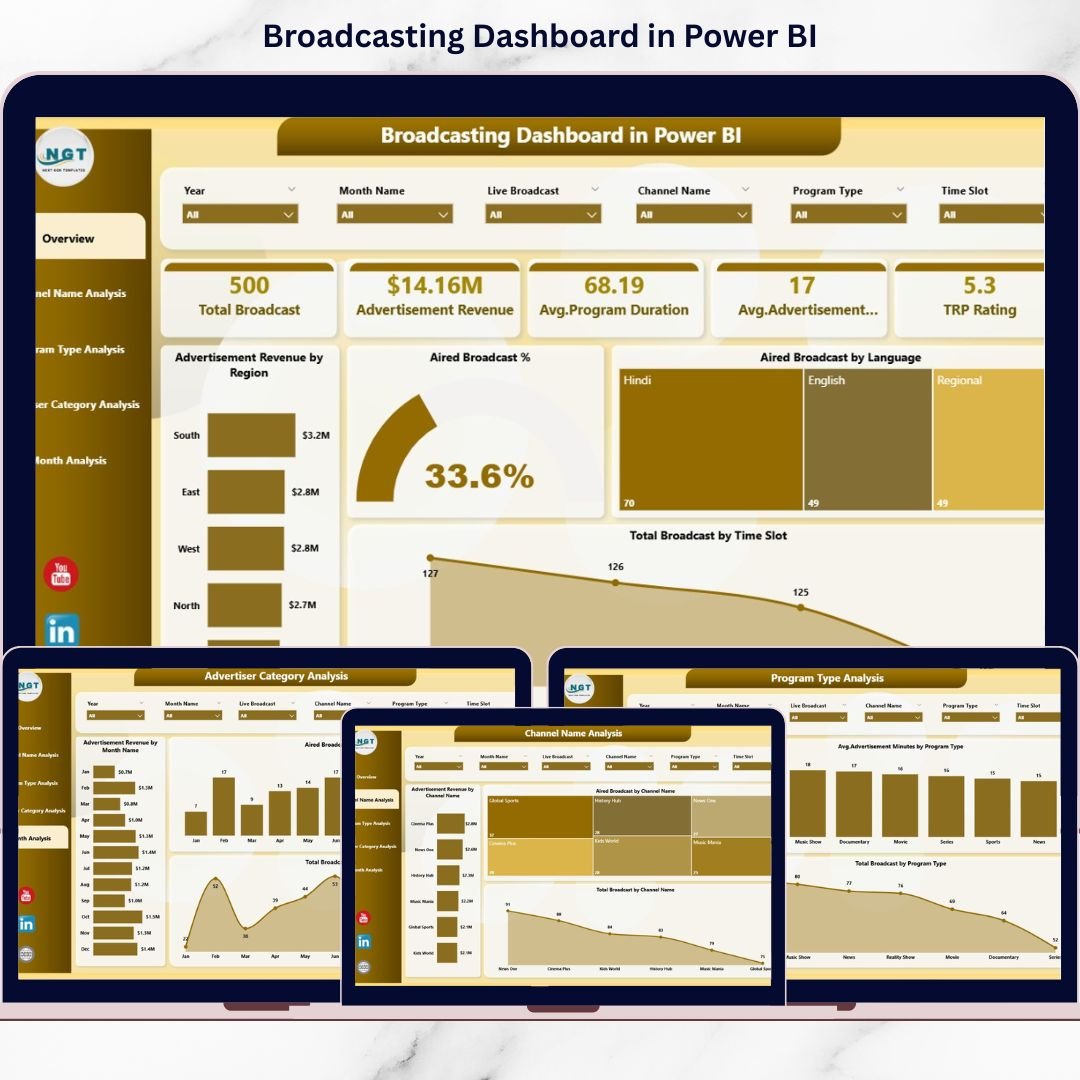
🏠 Overview Page – Overall Broadcasting Performance
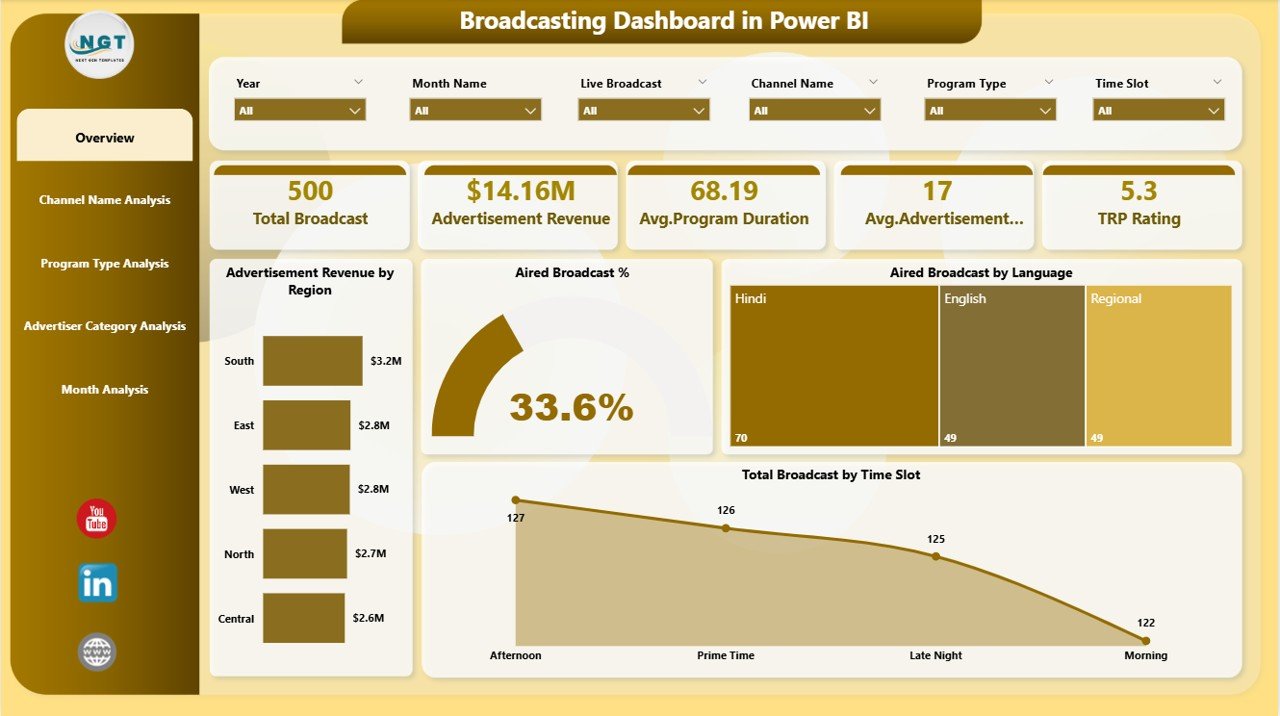
The Overview Page acts as the control center of the dashboard and provides a high-level snapshot of performance.
KPIs & Charts Included
-
💰 Advertisement Revenue by Region
-
📺 Aired Broadcast %
-
🌐 Aired Broadcast by Language
-
🕒 Total Broadcast by Time Slot
Because everything responds to slicers, leadership teams can instantly evaluate performance and identify problem areas.
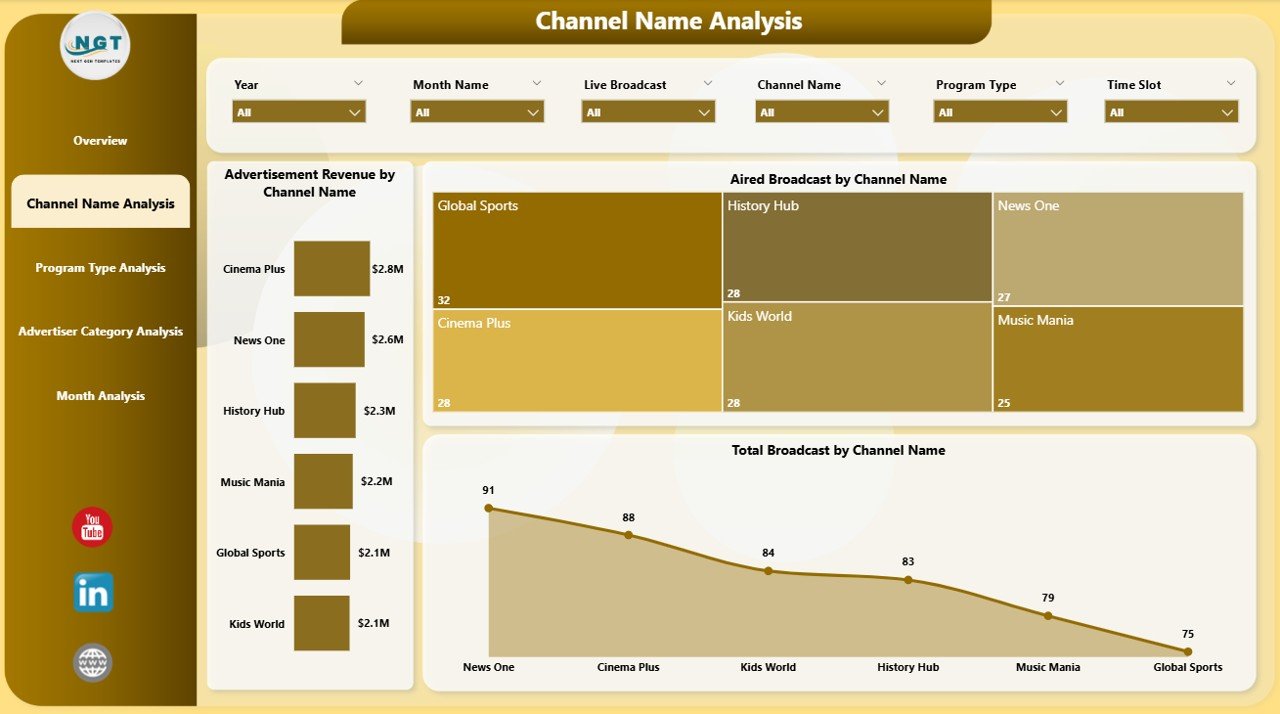
📡 Channel Name Analysis – Channel-Wise Performance
This page focuses on channel-level insights.
Charts Included
-
💰 Advertisement Revenue by Channel Name
-
📺 Aired Broadcast % by Channel Name
-
📊 Total Broadcast by Channel Name
With this analysis, broadcasters easily identify top-performing and underperforming channels.
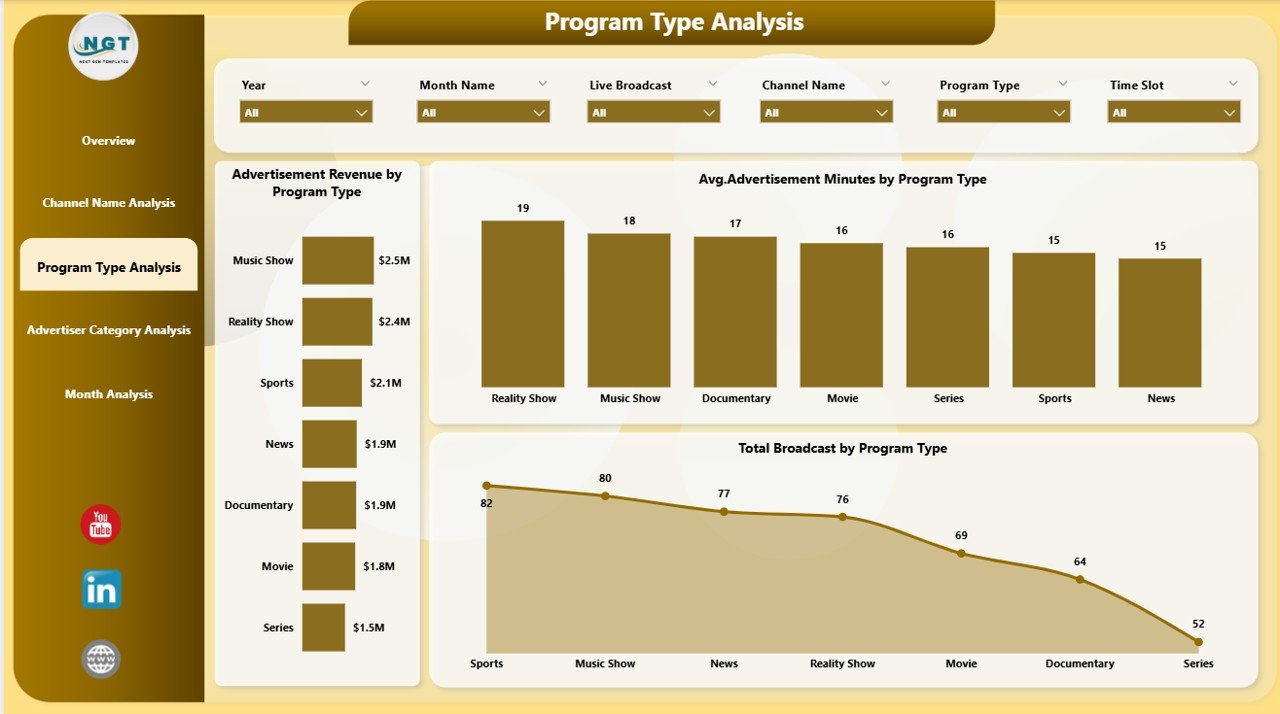
🎬 Program Type Analysis – Content Performance Insights
Different program types attract different audiences and advertisers. Therefore, this page focuses on content-driven performance.
Charts Included
-
💰 Advertisement Revenue by Program Type
-
⏱️ Average Advertisement Minutes by Program Type
-
📊 Total Broadcast by Program Type
This page helps content and programming teams refine scheduling and content strategy.
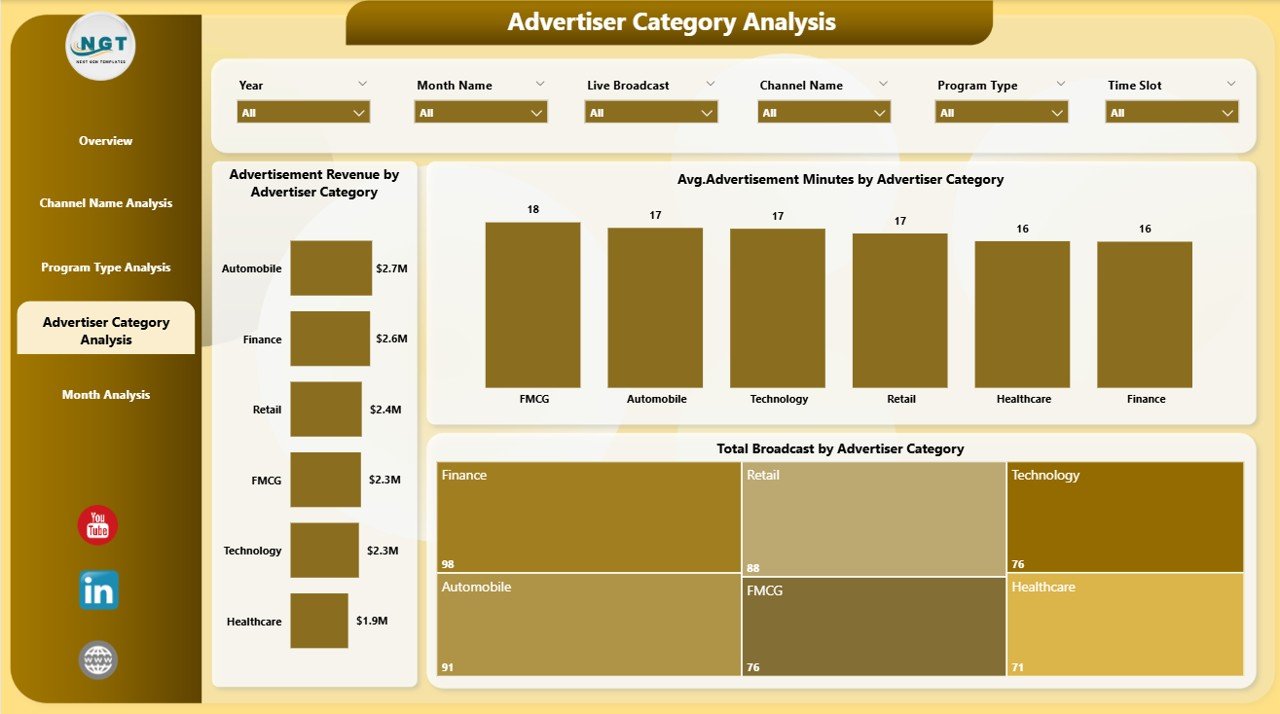
🏷️ Advertiser Category Analysis – Revenue Optimization
This page analyzes performance by advertiser category.
Charts Included
-
💰 Advertisement Revenue by Advertiser Category
-
⏱️ Average Advertisement Minutes by Advertiser Category
-
📊 Total Broadcast by Advertiser Category
As a result, sales teams identify high-value advertiser segments and optimize ad packages.
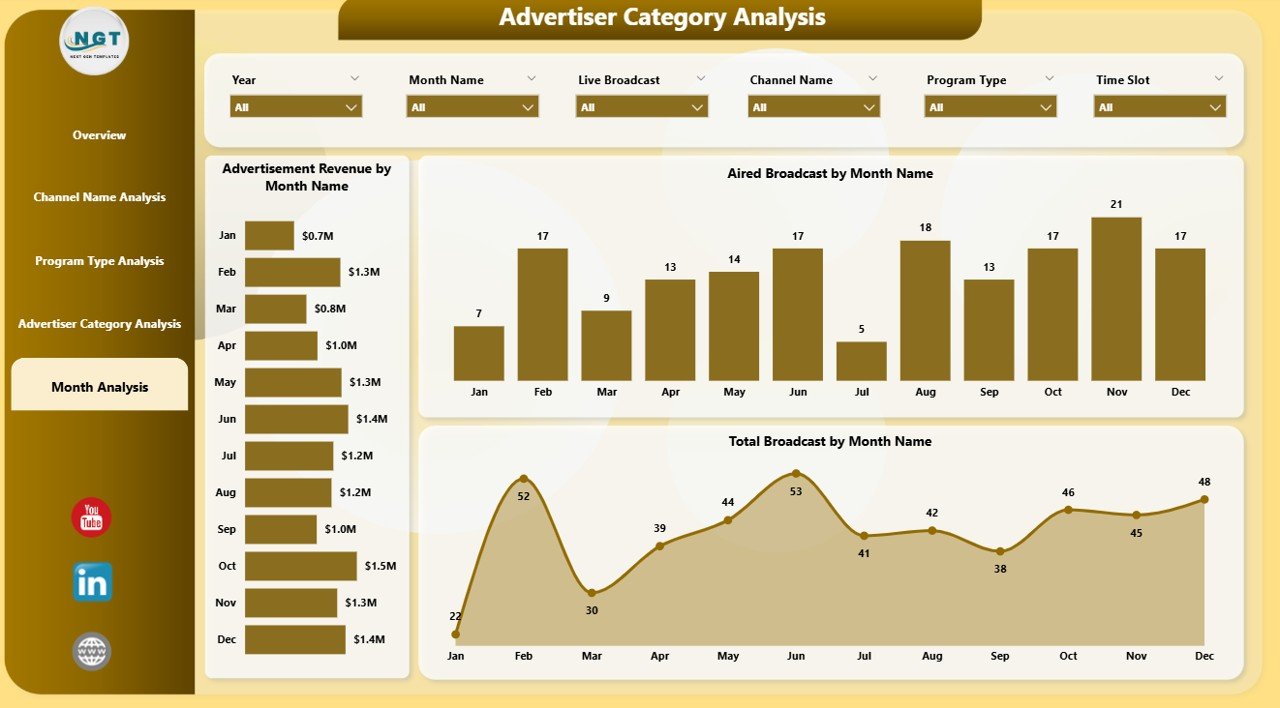
📅 Month Analysis – Trend & Seasonality View
The Month Analysis Page tracks performance over time.
Charts Included
-
💰 Advertisement Revenue by Month
-
📺 Aired Broadcast by Month
-
📊 Total Broadcast by Month
This page supports forecasting, seasonal planning, and long-term strategy.
▶️ How the Broadcasting Dashboard in Power BI Works
1️⃣ Connect broadcasting data (Excel, database, or system exports)
2️⃣ Refresh the Power BI dataset
3️⃣ Use slicers to filter by channel, program type, advertiser category, region, or month
4️⃣ Review KPIs, trends, and comparisons
5️⃣ Take faster, data-driven broadcasting decisions
No advanced Power BI skills are required for end users.
👥 Who Should Use This Dashboard?
✔ Broadcasting companies
✔ TV & media networks
✔ Channel managers
✔ Advertising sales teams
✔ Media planners & analysts
✔ Finance & leadership teams
Both small broadcasters and large networks can scale this dashboard easily.
🚀 Business Advantages
Using this Broadcasting Dashboard in Power BI helps you:
-
Improve revenue visibility
-
Optimize program scheduling
-
Track aired vs planned broadcasts
-
Identify high-performing channels and advertisers
-
Reduce manual reporting effort
-
Enable faster, smarter decisions
📺 Visit our YouTube channel to learn step-by-step video tutorials
👉 https://youtube.com/@PKAnExcelExpert