



Running a Coaching & Tutoring Dashboard institute today is no longer limited to delivering quality teaching 📚. You must track student enrollments, attendance, fees, subjects, cities, coaching centers, and academic performance—all at the same time. When this information stays scattered across Excel sheets or manual reports, decision-making becomes slow and inaccurate.
That is exactly where the Coaching & Tutoring Dashboard in Power BI becomes a powerful growth enabler 🚀.
This ready-to-use Power BI dashboard transforms raw coaching and tutoring data into clear, interactive, and actionable insights. Instead of manually preparing reports, institute owners and managers can instantly monitor business performance and academic outcomes from a single dashboard.
Because the dashboard is built using Microsoft Power BI with Excel as a data source, it remains flexible, scalable, and easy to maintain. You simply update your data, refresh the dashboard, and gain real-time insights—without technical complexity.
Whether you manage a single coaching center or multiple branches across cities, this dashboard helps you increase student engagement, improve academic quality, and optimize revenue using data-driven decisions.
🔑 Key Features of Coaching & Tutoring Dashboard in Power BI
📊 Centralized academic & business analytics
🏫 Coaching center-wise performance tracking
🌆 City-wise enrollment & revenue insights
📚 Subject-level academic analysis
🎯 Attendance & ongoing training monitoring
💰 Monthly fee & revenue trend analysis
📈 Time-based performance tracking
🖱️ Interactive slicers & filters
⚡ Real-time Power BI visuals
📂 What’s Inside the Coaching & Tutoring Dashboard in Power BI
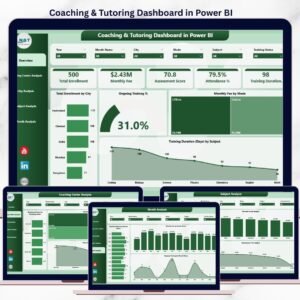
📊 Overview Page – Complete Performance Snapshot

Coaching & Tutoring Dashboard
The Overview Page acts as the command center of the dashboard.
Key insights available:
📍 Total Enrollment by City – Identify high-performing locations
🎯 Ongoing Training % – Measure student engagement
💻 Monthly Fee by Mode – Compare online vs offline revenue
⏱️ Training Duration by Subject – Analyze subject-wise effort
With interactive slicers, leadership teams gain instant clarity without manual reports.
🏫 Coaching Center Analysis – Branch-Wise Performance
This page compares performance across different coaching centers.
Charts included:
Cost Assessment Score by Coaching Center
Monthly Fee by Coaching Center
Attendance % by Coaching Center
👉 Helps management identify top-performing branches and fix underperforming centers quickly.
🌆 City Analysis – Location-Based Insights
The City Analysis Page highlights geographic performance differences.
Key metrics:
Assessment Score by City
Monthly Fee by City
Ongoing Training % by City
👉 Supports expansion planning, pricing strategy, and regional marketing decisions.
📚 Subject Analysis – Academic Performance Review
This page focuses on subject-level outcomes.
Charts included:
Assessment Score by Subject
Monthly Fee by Subject
Attendance % by Subject
👉 Enables academic heads to improve curriculum quality and optimize faculty allocation.
📅 Month Analysis – Trend & Growth Tracking
The Month Analysis Page tracks performance over time.
Key insights:
Total Enrollment by Month
Monthly Fee by Month
Ongoing Training % by Month
👉 Helps institutes forecast demand, plan campaigns, and stabilize revenue.
⚙️ How to Use the Coaching & Tutoring Dashboard in Power BI
1️⃣ Update student, fee, and attendance data in Excel
2️⃣ Refresh the Power BI dashboard
3️⃣ Apply slicers for city, subject, center, or month
4️⃣ Review KPIs and trends
5️⃣ Take faster, smarter academic and business decisions
No coding. No complexity. Just insights ✔️
🎯 Who Can Benefit from This Dashboard?
🏫 Coaching Institutes
🎓 Tutoring Centers
📘 Training Academies
🧑🏫 Education Service Providers
🌐 Multi-city & franchise coaching businesses
### 👉 Click here to read the Detailed blog post
▶️ Visit our YouTube channel to learn step-by-step video tutorials
https://youtube.com/@PKAnExcelExpert
Watch the step-by-step video tutorial:
Compatibility and Requirements
- Works in Power BI Desktop, which is free to download. Microsoft explains how to get it in Get Power BI Desktop.
- Your student, fee and attendance data sits in Excel, which is the data source for the dashboard.
Frequently Asked Questions
Which pages does the dashboard have?
Four pages: Overview, Coaching Center Analysis, City Analysis and Subject Analysis, plus a Month Analysis page for trends over time.
Where does the data come from?
The dashboard reads from Excel. You update your student, fee and attendance data in Excel and refresh the dashboard in Power BI.
Can I compare coaching centers and cities?
Yes. The Coaching Center Analysis page shows cost assessment score, monthly fee and attendance % by center. The City Analysis page shows assessment score, monthly fee and ongoing training % by city.
Can I compare online and offline fees?
Yes. The Overview page includes Monthly Fee by Mode, so you can compare online and offline revenue.
Is there an Excel or Google Sheets version?
Yes. See the Coaching & Tutoring Dashboard in Excel and the Coaching & Tutoring Dashboard in Google Sheets.
Related Coaching and Tutoring Templates
- Coaching & Tutoring KPI Dashboard in Power BI: a KPI view of the same business
- Coaching & Tutoring Dashboard in Excel: the same dashboard in Excel
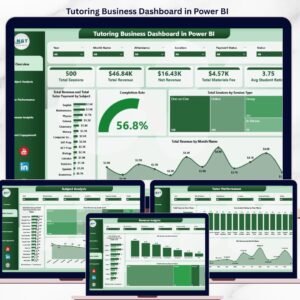
- Tutoring Business Dashboard in Power BI: a dashboard for tutoring businesses
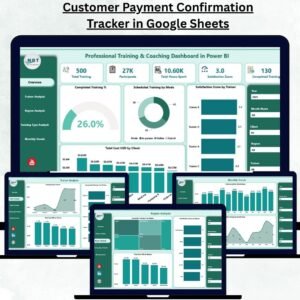
- Professional Training & Coaching Dashboard in Power BI: for training and coaching providers
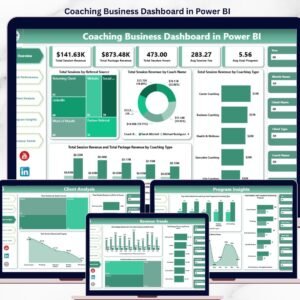
- Coaching Business Dashboard in Power BI: a Power BI dashboard for coaching businesses
Browse all Power BI dashboards.









Reviews
There are no reviews yet.