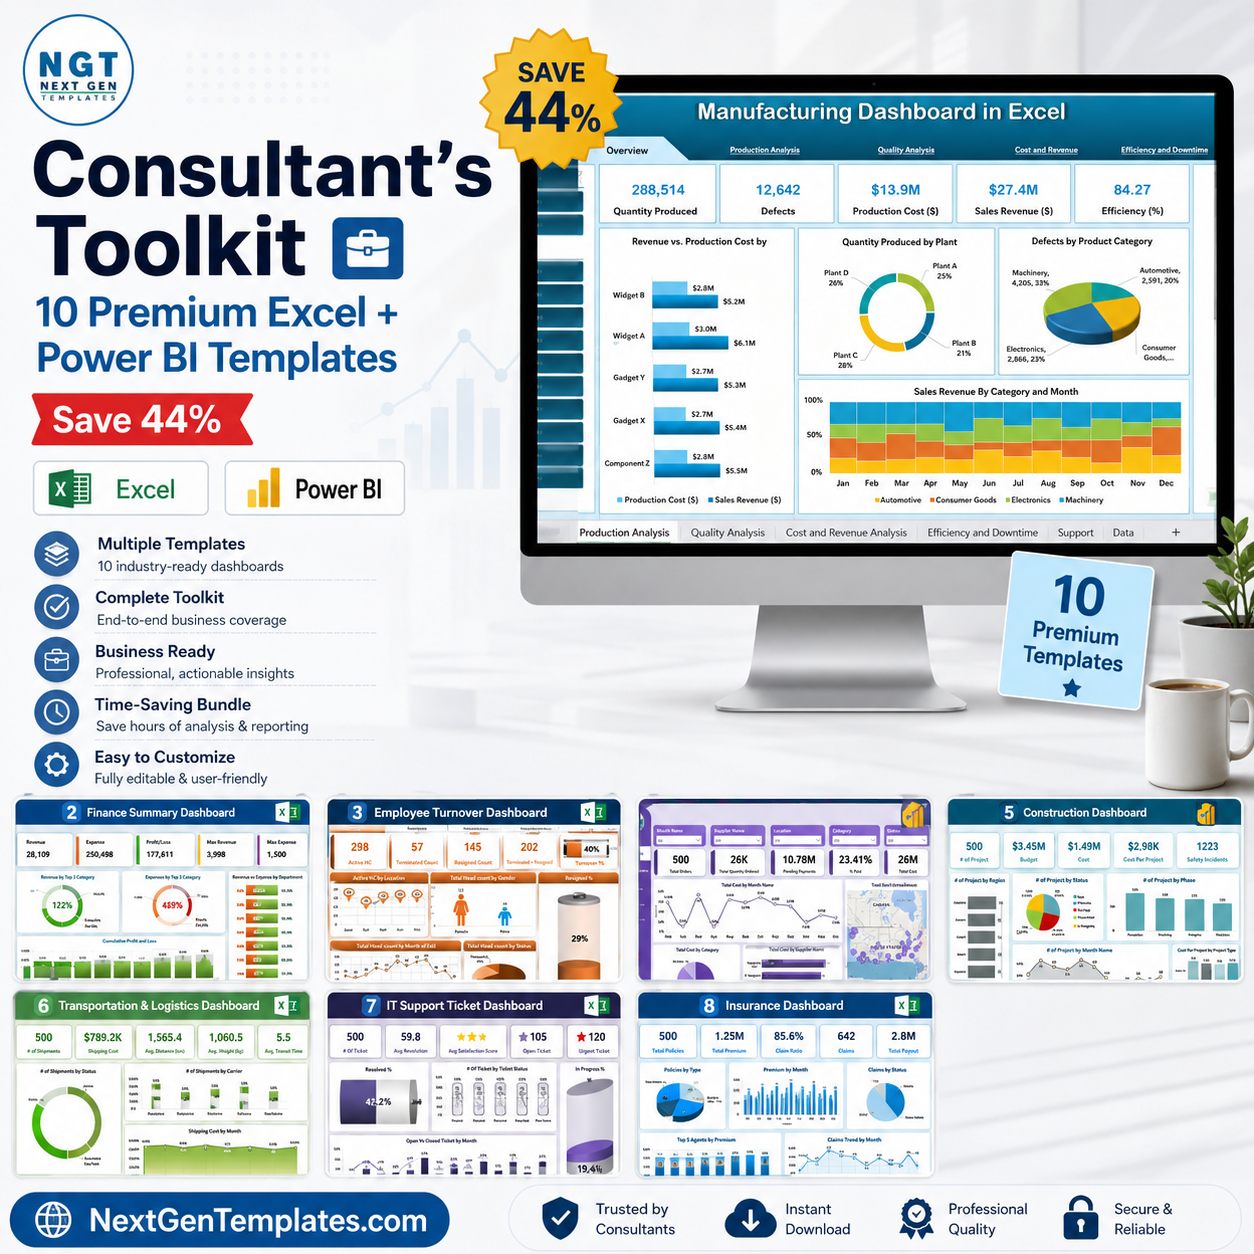

The Consultant’s Toolkit is the most comprehensive multi-industry dashboard bundle we’ve ever assembled. Whether you’re a management consultant preparing client-facing reports, a business analyst covering multiple departments, or an operations leader who needs one toolkit to rule them all — this is it. Ten premium templates across Excel and Power BI, covering the ten business functions most demanded by consulting clients. Instead of buying each template individually for $179.90, get the entire Consultant’s Toolkit for just $99.99 — saving you $79.91 (44%).
🔑 Key Features of the Consultant’s Toolkit
- ✅ 10 Production-Ready Dashboards – each individually crafted for its domain, battle-tested with real-world data structures
- ✅ Excel + Power BI Coverage – 8 Excel dashboards and 2 Power BI reports, combining offline reliability with enterprise visualization
- ✅ Multi-Industry Scope – Manufacturing, Finance, HR, Procurement, Construction, Healthcare, Logistics, IT, Insurance, and Risk Management
- ✅ 40+ Dashboard Pages – deep drill-downs, KPI cards, trend charts, slicers, and summary views across every tool
- ✅ Instant Setup – replace sample data with your own and every chart, KPI, and analysis updates automatically
- ✅ Consultant-Friendly Design – clean, professional layouts you can present directly to clients without modification
- ✅ No Subscriptions, No Add-ins – one-time purchase, lifetime access, works fully offline
- ✅ Cross-Functional Insights – link operational, financial, HR, and risk views for holistic client presentations
📦 What’s Inside the Consultant’s Toolkit
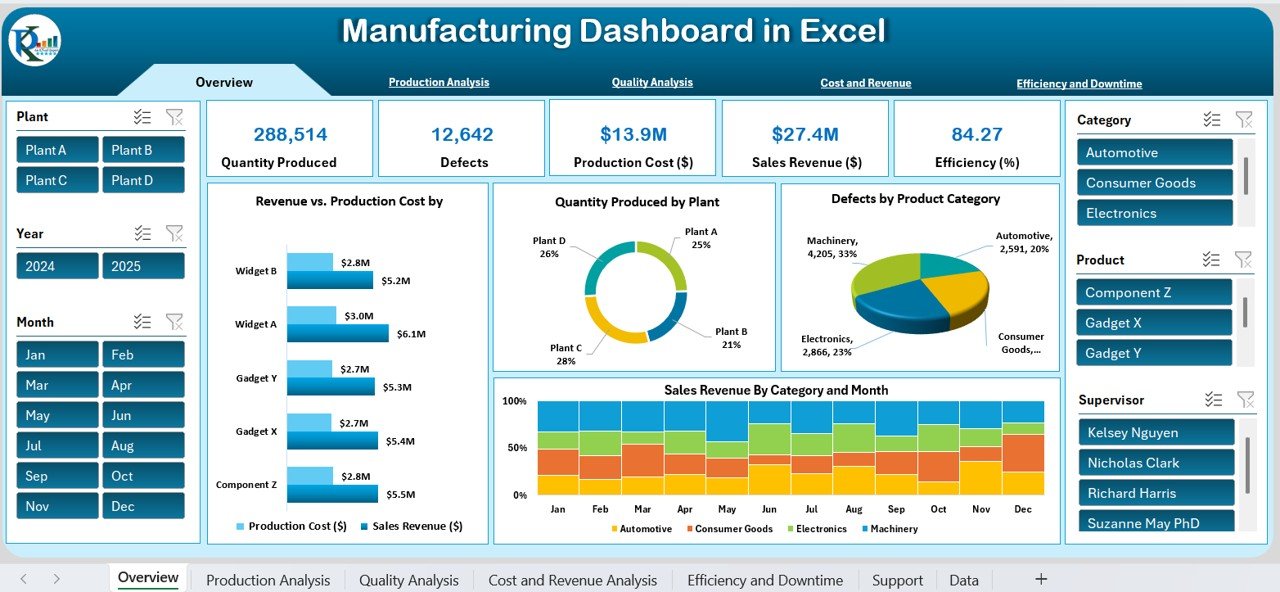
1. Manufacturing Dashboard in Excel
Track OEE, throughput, FPY, downtime, MTBF, MTTR, and scrap rate across 7 analysis pages. Built for plant managers, operations directors, and manufacturing consultants who need factory analytics without a BI licence.

Manufacturing Dashboard in Excel
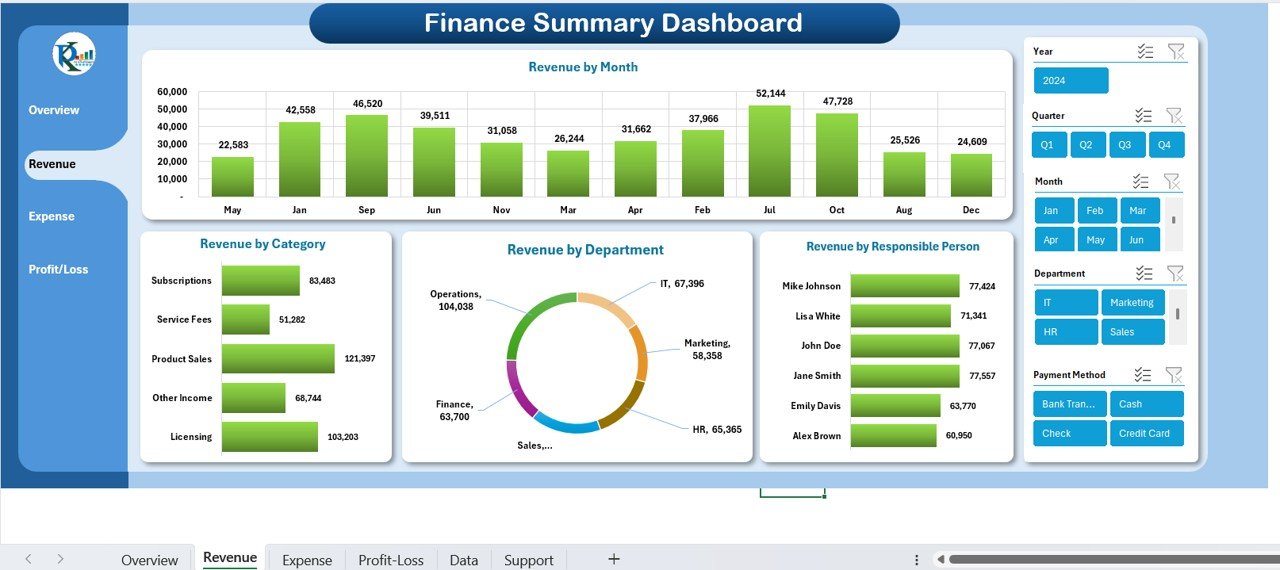
2. Finance Summary Dashboard in Excel
Comprehensive financial oversight covering income tracking, expense management, cash flow monitoring, profit margin analysis, and financial forecasting — all in a single Excel file your finance clients will love.
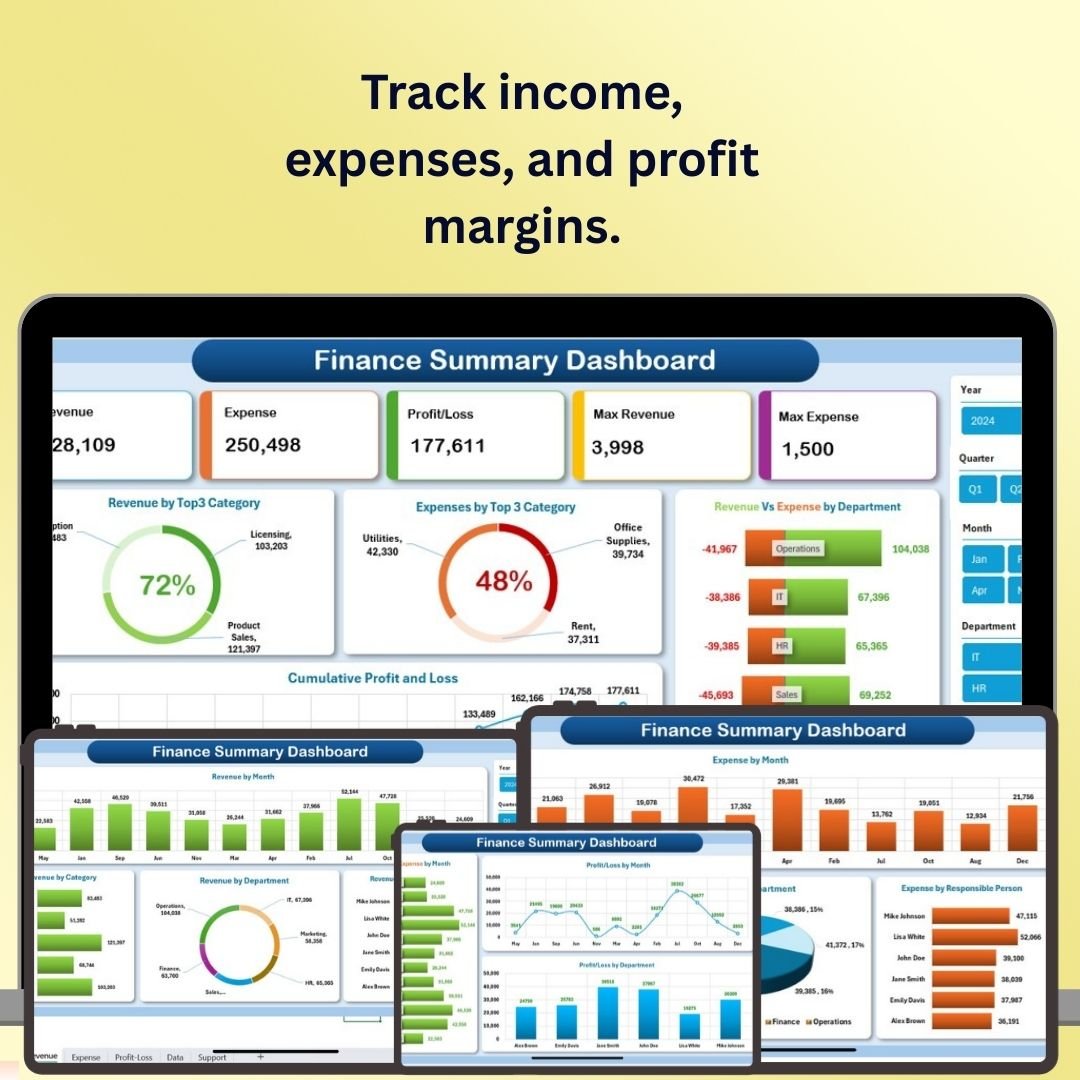
Finance Summary Dashboard in Excel
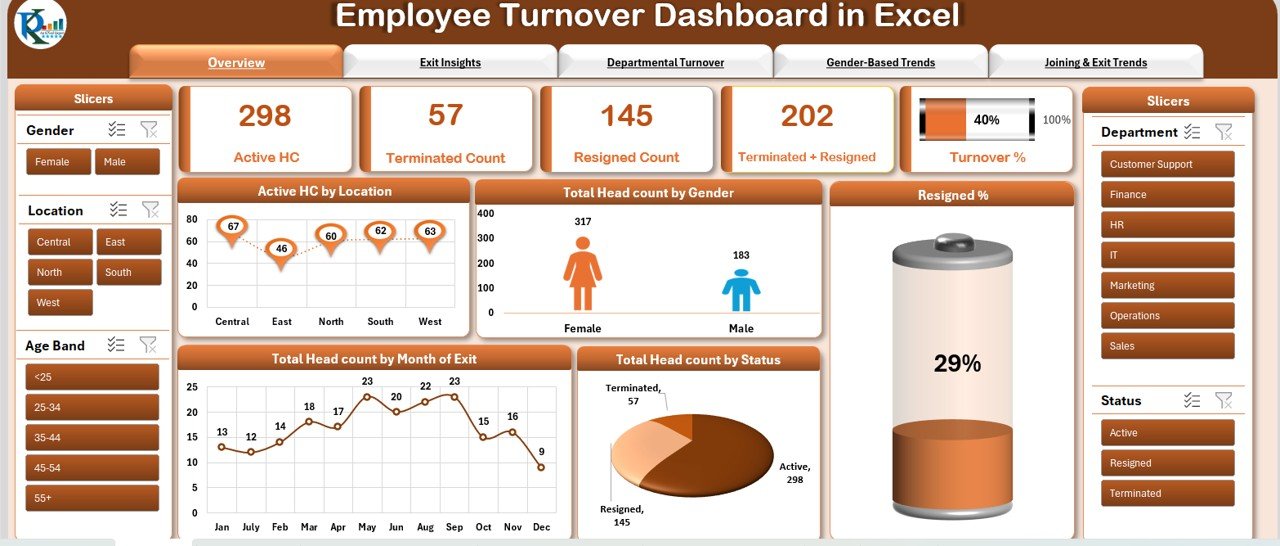
3. Employee Turnover Dashboard in Excel
Monitor resignations, terminations, and active headcount with departmental breakdowns, gender-based trend analysis, and joining vs. exit comparisons. Perfect for HR consulting engagements and workforce strategy presentations.
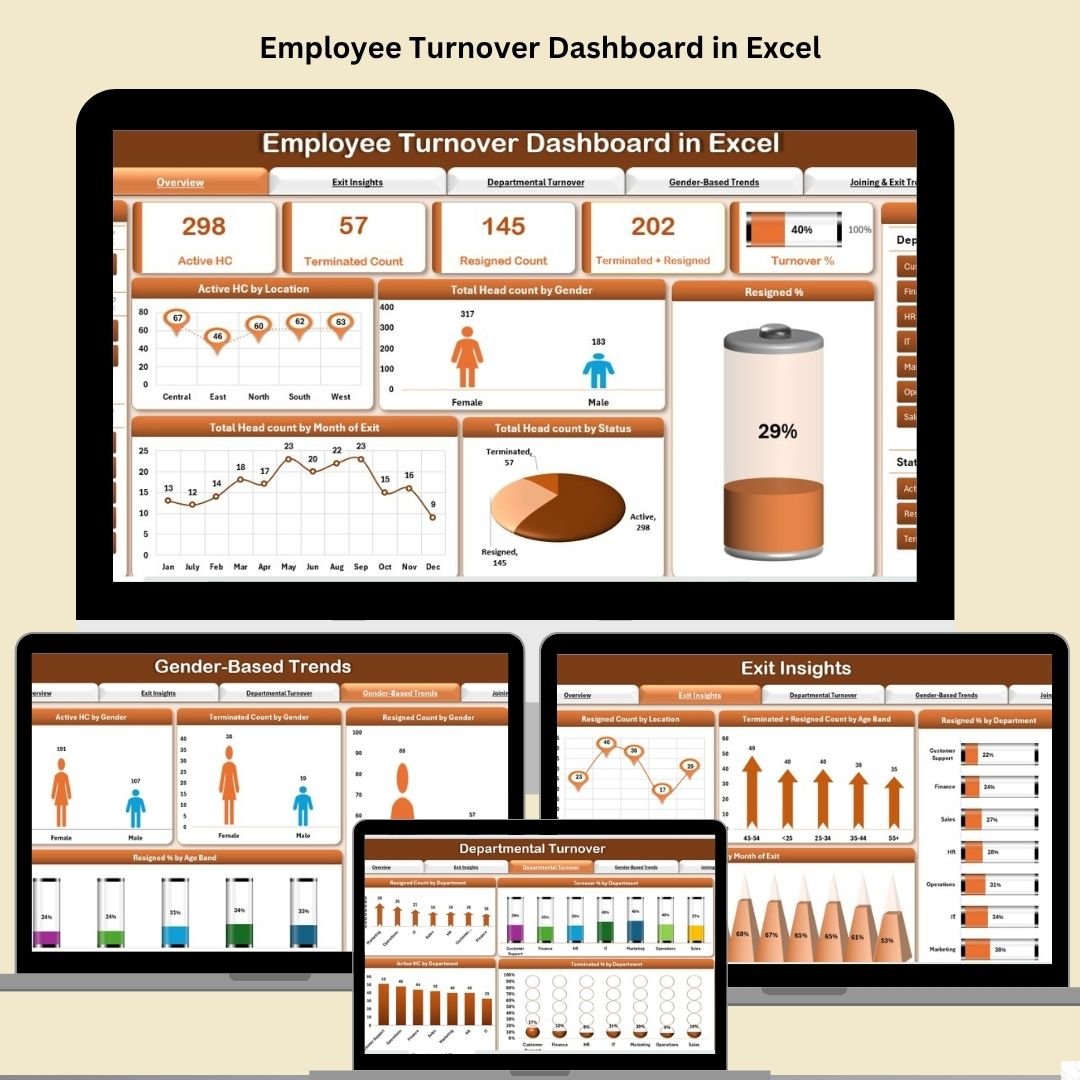
Employee Turnover Dashboard in Excel
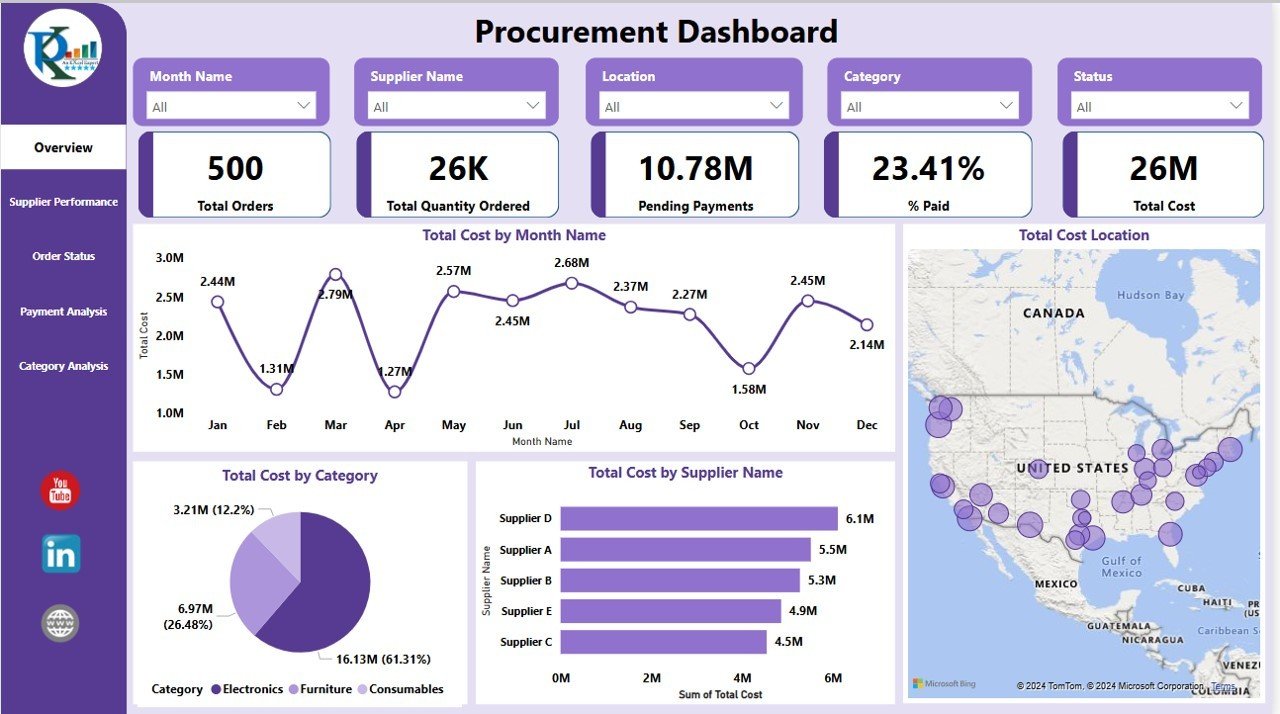
4. Procurement Dashboard in Power BI
Five dynamic Power BI pages covering supplier performance, order status, payment analysis, and category spend. Geo-mapping, dynamic slicers, and drill-through visuals make this a standout for supply chain consulting work.
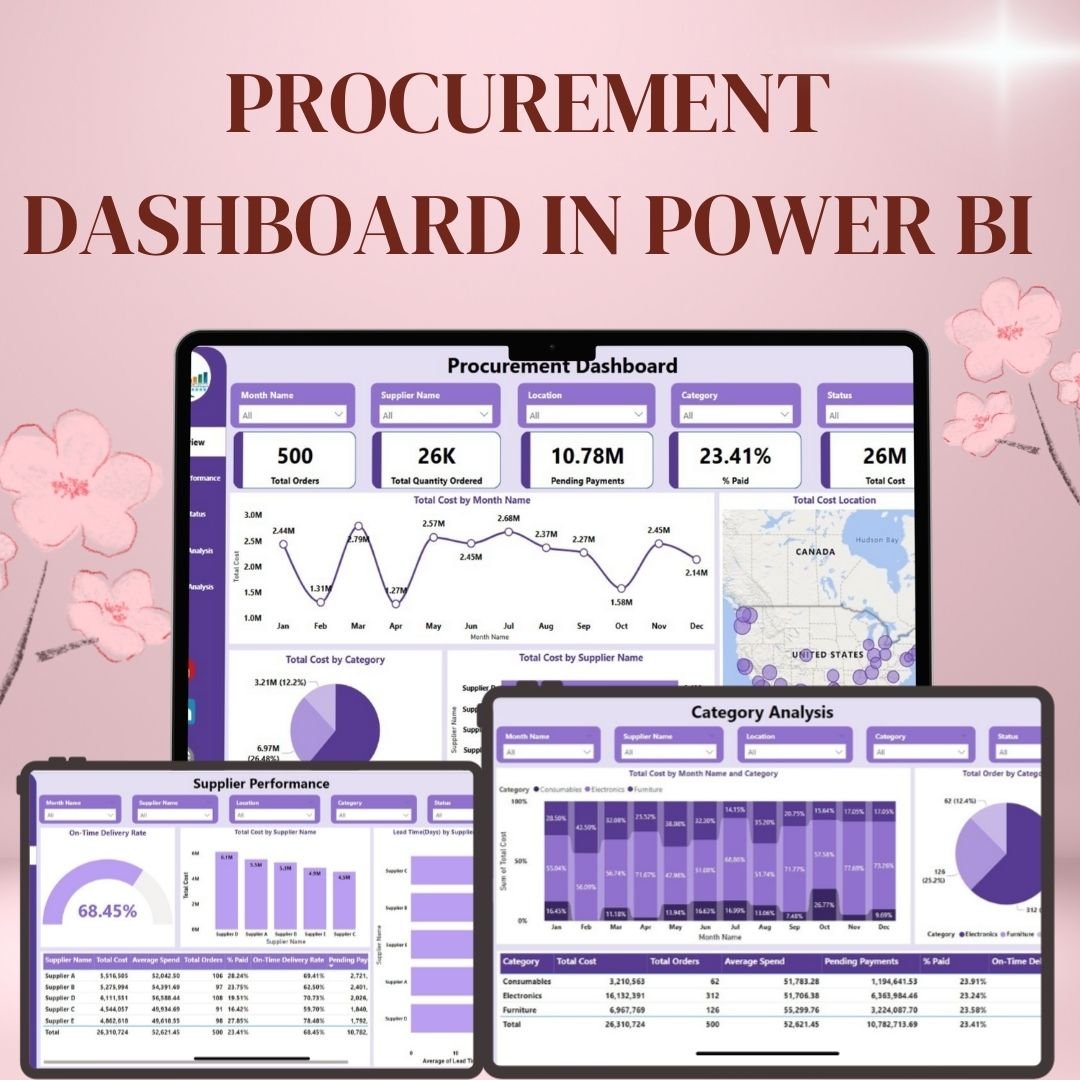
Procurement Dashboard in Power BI
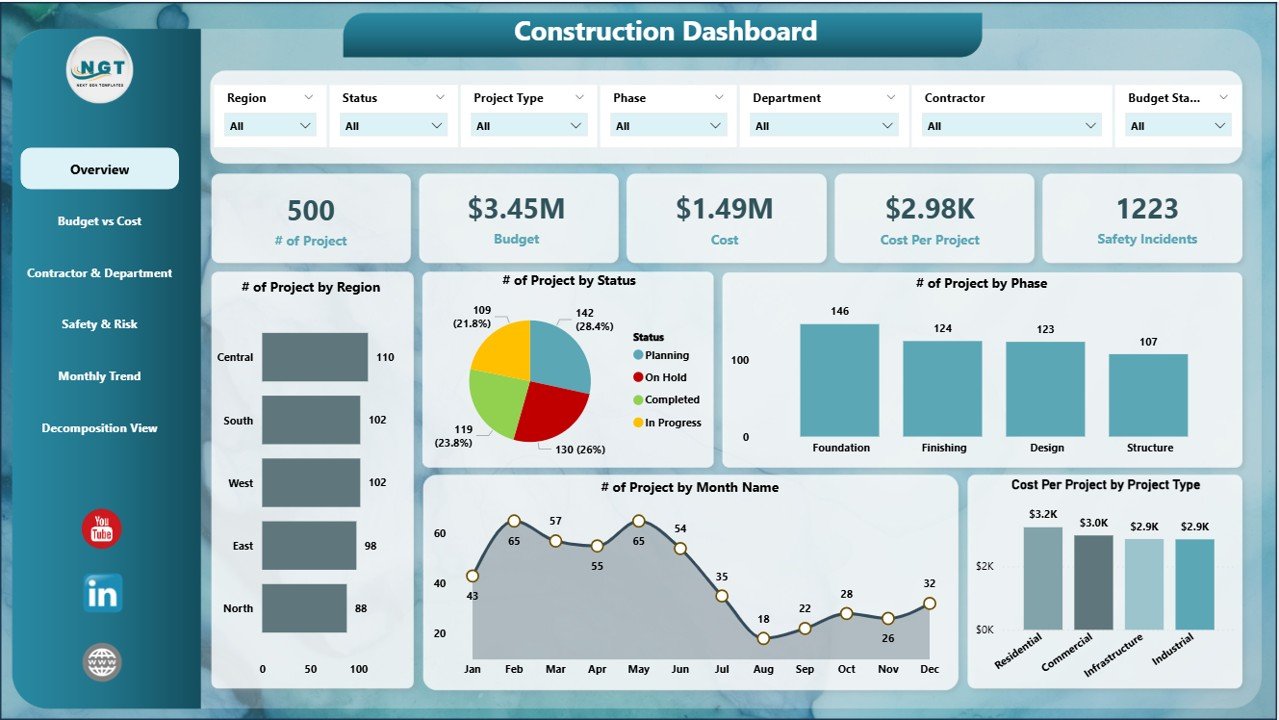
5. Construction Dashboard in Power BI
Six Power BI pages covering project overview, budget vs. cost, contractor performance, safety & risk monitoring, monthly trends, and decomposition views. Built for construction project managers, PMO leaders, and capital project consultants.
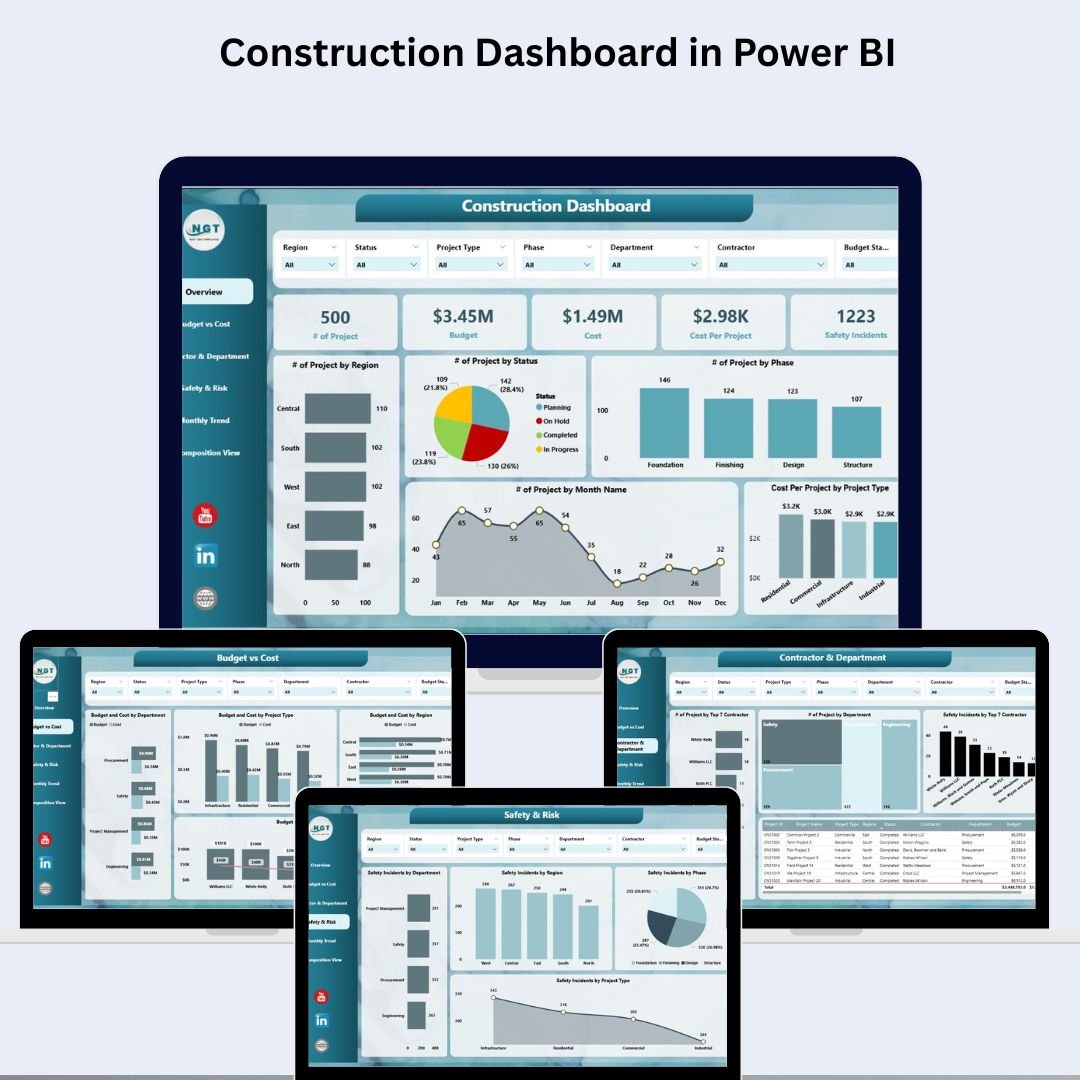
Construction Dashboard in Power BI
6. Healthcare Dashboard in Excel
Track patient statistics, treatment costs, doctor performance, and departmental efficiency across dedicated analysis pages. Ideal for healthcare management consultants and hospital administrators presenting clinical and financial performance data.

Healthcare Dashboard in Excel
7. Transportation & Logistics Dashboard in Excel
Five analytical pages covering carrier performance, route analysis, product shipment analytics, and time-based trend tracking. Built on PivotTables and slicers — perfect for logistics strategy engagements and supply chain optimization presentations.
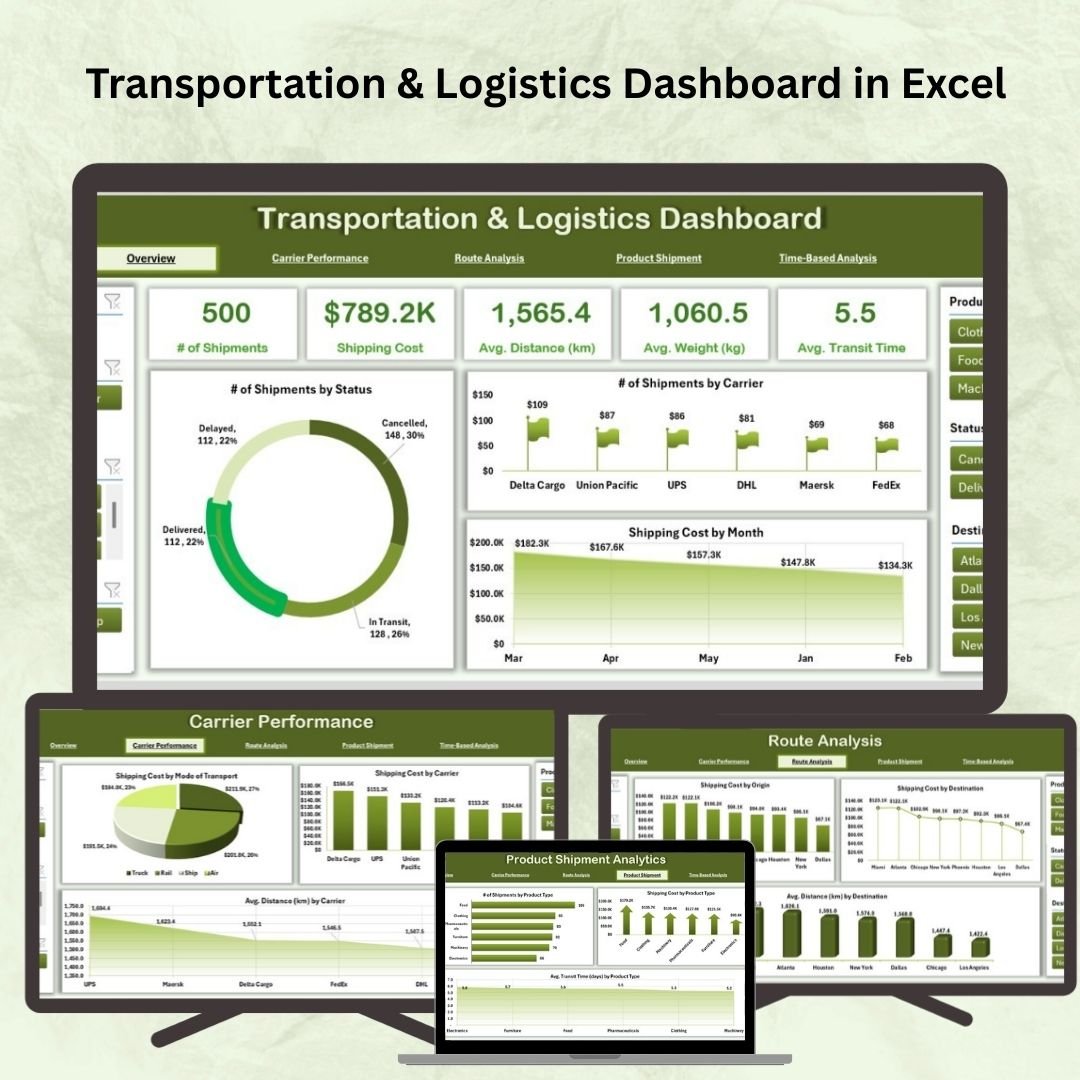
Transportation & Logistics Dashboard in Excel
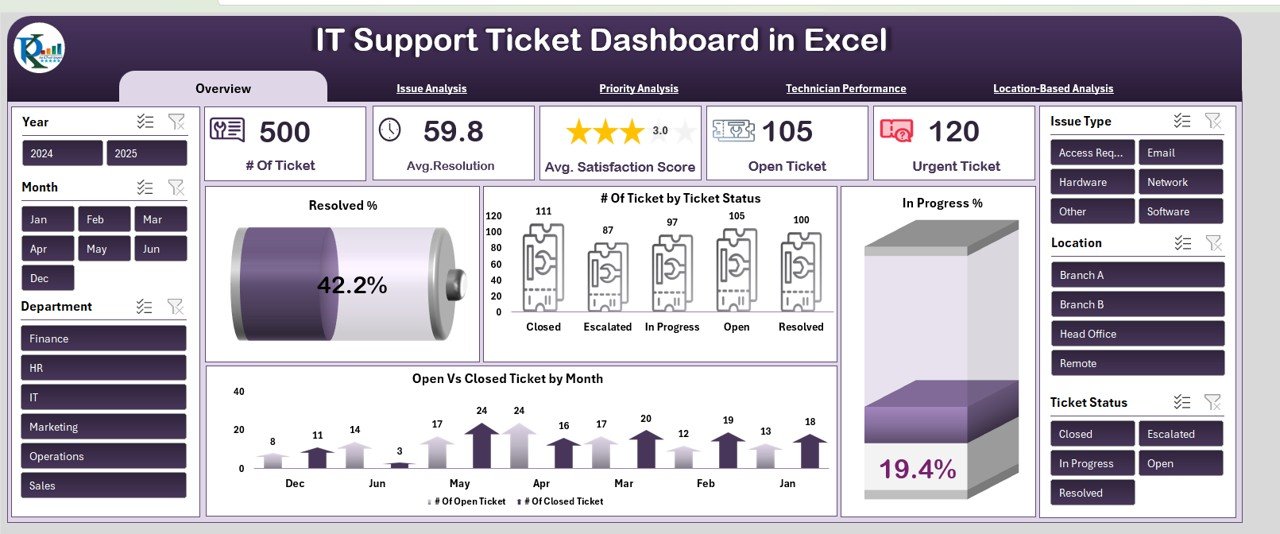
8. IT Support Ticket Dashboard in Excel
Six worksheet tabs tracking total tickets, resolution time, satisfaction scores, priority breakdowns, technician performance, and location-based analysis. Essential for IT consulting, MSPs, and helpdesk optimization projects.
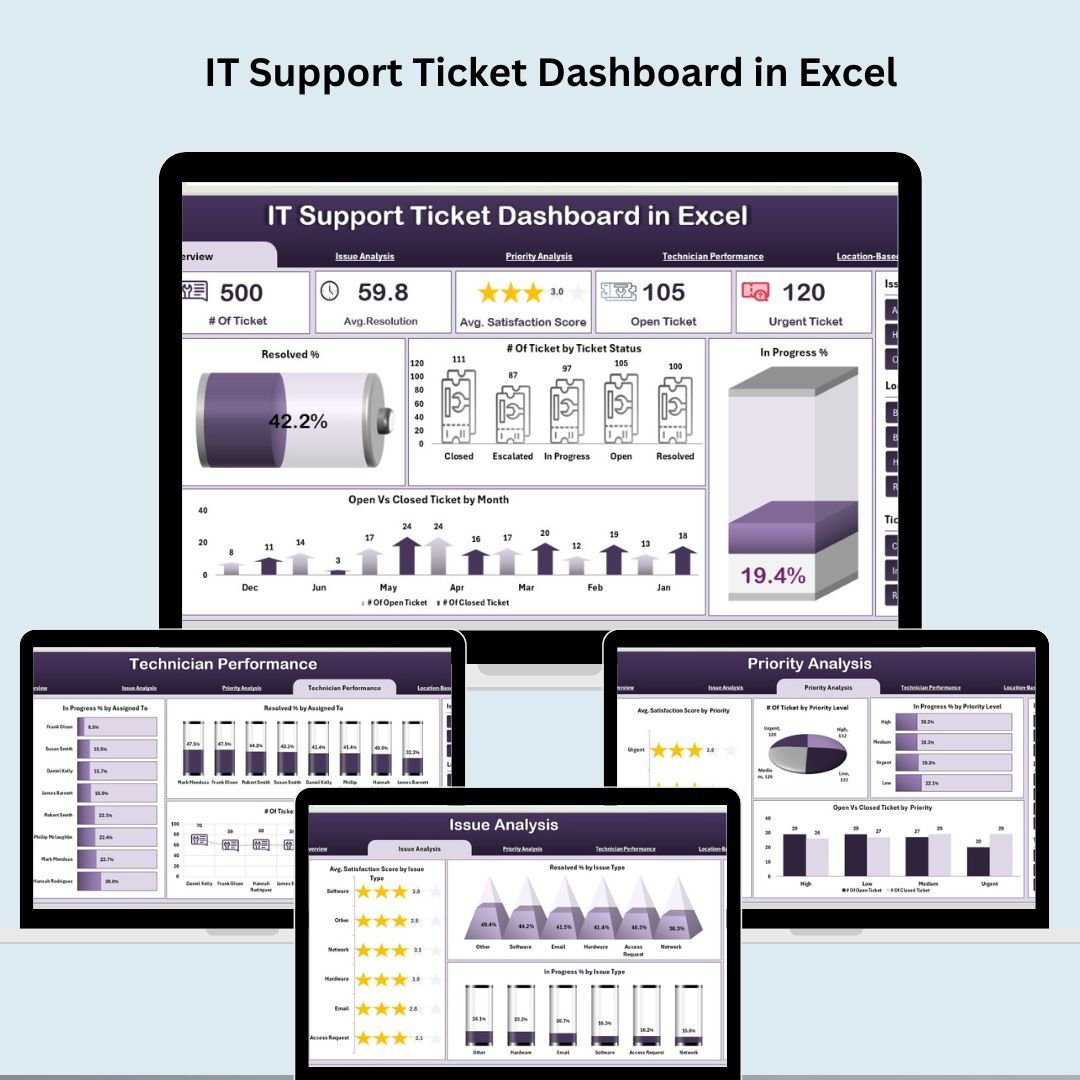
IT Support Ticket Dashboard in Excel
9. Insurance Dashboard in Excel
KPI trend analysis for claim approval rates, processing times, and payout accuracy — with dynamic month selection, historical data comparison, and target-setting capabilities. Built for insurance companies and consulting firms serving the financial services sector.

Insurance Dashboard in Excel
10. Risk Management Dashboard in Excel
Six dashboard tabs covering risk KPIs (severity, probability, overdue rate), owner tracking, departmental risk density, and monthly trend analysis. Centralized risk logging with escalation alerts — a must-have for governance, risk, and compliance consulting work.
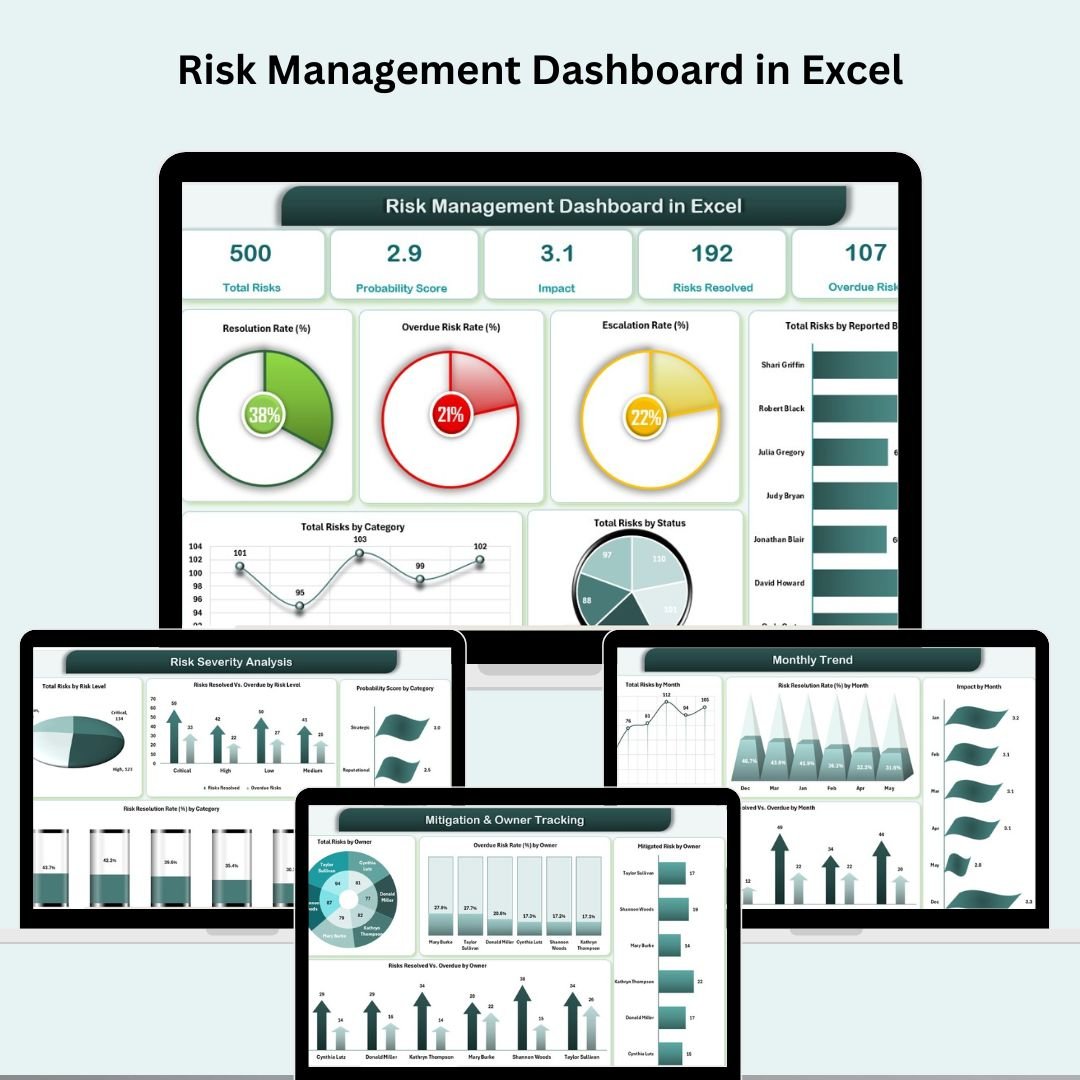
Risk Management Dashboard in Excel
💡 Smart Comparison — Individual vs Consultant’s Toolkit
| Feature | Individual Purchase | Consultant’s Toolkit ✅ |
|---|---|---|
| Number of Templates | 1 | 10 |
| Industry Coverage | Single domain | 10 industries |
| Platforms | Excel or Power BI | Excel + Power BI |
| Total Price | $99.99 (Save 44%) | |
| Savings | $0 | $79.91 |
| Best For | Single-industry use | Consultants & analysts |
| # | Template | Platform | Individual Price |
|---|---|---|---|
| 1 | Manufacturing Dashboard in Excel | MS Excel | $17.99 |
| 2 | Finance Summary Dashboard in Excel | MS Excel | $17.99 |
| 3 | Employee Turnover Dashboard in Excel | MS Excel | $17.99 |
| 4 | Procurement Dashboard in Power BI | Power BI | $17.99 |
| 5 | Construction Dashboard in Power BI | Power BI | $17.99 |
| 6 | Healthcare Dashboard in Excel | MS Excel | $17.99 |
| 7 | Transportation & Logistics Dashboard in Excel | MS Excel | $17.99 |
| 8 | IT Support Ticket Dashboard in Excel | MS Excel | $17.99 |
| 9 | Insurance Dashboard in Excel | MS Excel | $17.99 |
| 10 | Risk Management Dashboard in Excel | MS Excel | $17.99 |
| Individual Total | $179.90 | ||
| Bundle Price (Save 44%) | $99.99 | ||
⚙️ How to Use the Consultant’s Toolkit
- Purchase and Download – You’ll receive a single ZIP file containing all 10 templates. Extract and open each file in Excel or Power BI Desktop.
- Review Sample Data – Each template ships with a realistic sample dataset so you can explore the full dashboard before touching your own data.
- Replace with Your Data – Paste your client’s data into the Data or Input sheet of each template. All KPIs, charts, and analysis pages update automatically.
- Customize for Each Client – Adjust targets, rename departments, and adapt chart titles to match each client’s terminology and brand.
- Present with Confidence – Use the dashboard pages directly in client meetings, management presentations, or board reports.
👥 Who Can Benefit from the Consultant’s Toolkit
- 💼 Management Consultants – Cover any client industry without building custom dashboards from scratch
- 📊 Business Analysts – Deliver multi-function reporting across departments with a single toolkit
- 🏢 Corporate Strategy Teams – Consolidate cross-functional data for executive presentations
- 🛡️ Risk & Compliance Officers – Insurance, risk management, and IT dashboards included for governance work
- 🏗️ Project Management Offices (PMOs) – Construction and procurement dashboards for capital project oversight
- 🏥 Healthcare Administrators – Ready-made patient and financial analytics for clinical and operational reporting
- 🚚 Operations & Supply Chain Leaders – Manufacturing, logistics, and procurement views in one bundle
- 🎓 Freelancers & Solo Consultants – Build a complete client reporting toolkit without the cost of 10 individual purchases
🎯 Get the Complete Consultant’s Toolkit Today
10 Premium Templates | Excel + Power BI | Save $79.91 (44% Off)
$179.90 → $99.99
📖 Read the full Consultant’s Toolkit guide on our blog
🎥 For step-by-step video tutorials, visit our YouTube channel: youtube.com/@PKAnExcelExpert


Reviews
There are no reviews yet.