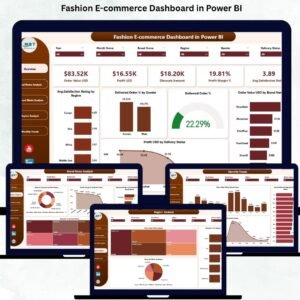
The Fashion E-commerce Dashboard in Power BI is a powerful, ready-to-use analytics tool designed to help online fashion brands make smarter, faster, and data-driven decisions. In a highly competitive industry where customer expectations change every season, brands must track performance instantly. Whether it is profit, customer satisfaction, regional orders, delivery performance, or discount effectiveness—this dashboard gives complete clarity with just a few clicks.
Built with interactive visuals, slicers, KPI cards, and dynamic charts, the dashboard pulls together data from different areas of your e-commerce business. Fashion E-commerce Dashboard in Power BI It helps track real-time sales movement, customer behavior trends, brand performance, monthly growth, and regional demand. Leaders, analysts, and marketing teams can use this dashboard to improve decision-making, enhance customer experience, and boost profitability.
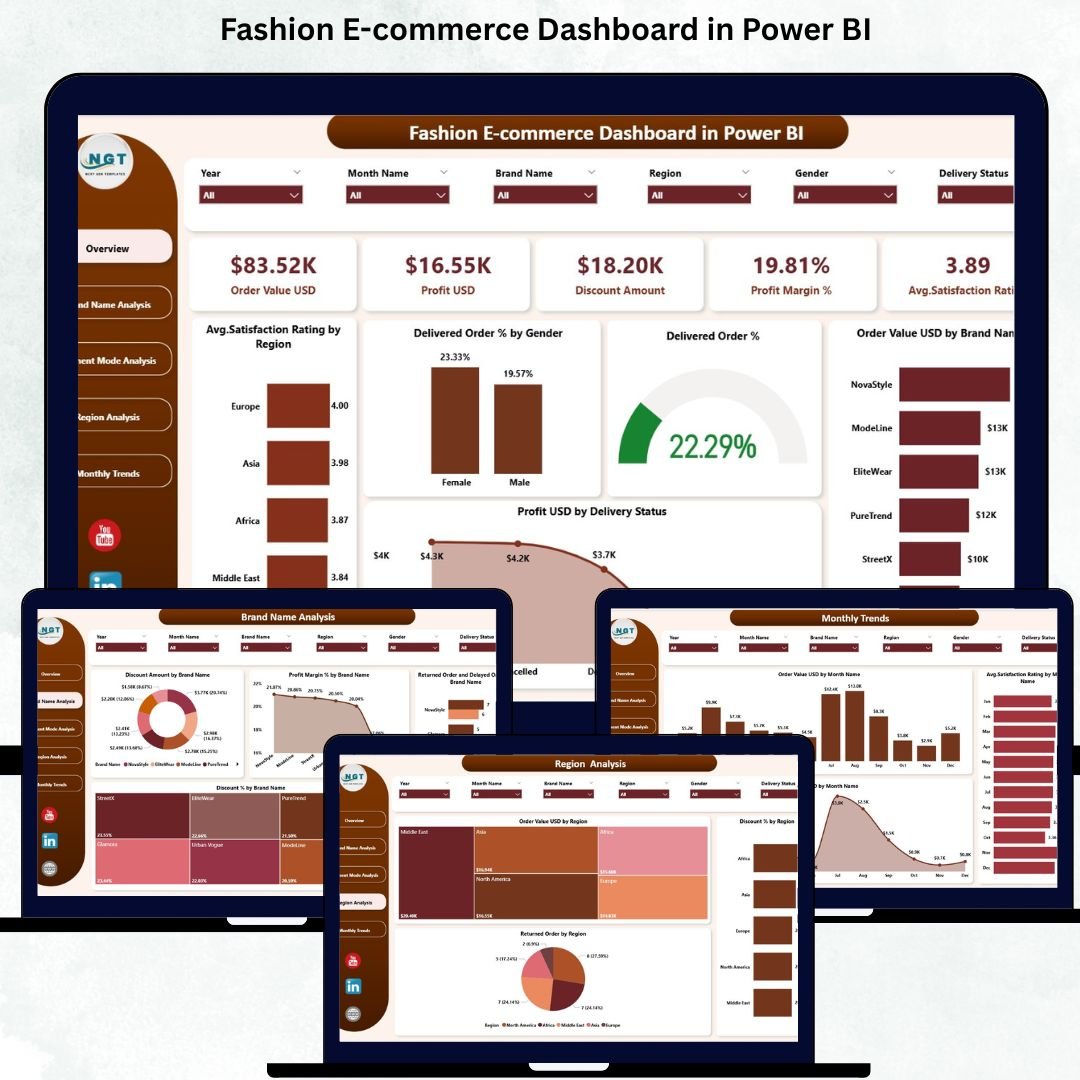
Fashion E-commerce Dashboard in Power BI With five powerful pages—Overview, Brand Name Analysis, Payment Mode Analysis, Region Analysis, and Monthly Trends—the dashboard covers every critical part of fashion e-commerce operations. Users can slice data by gender, payment mode, region, or brand to understand insights at the deepest level. Whether you’re launching new collections, running discount campaigns, or analyzing delivery success, this dashboard supports every business decision with accurate visuals.
✨ Key Features of the Fashion E-commerce Dashboard in Power BI
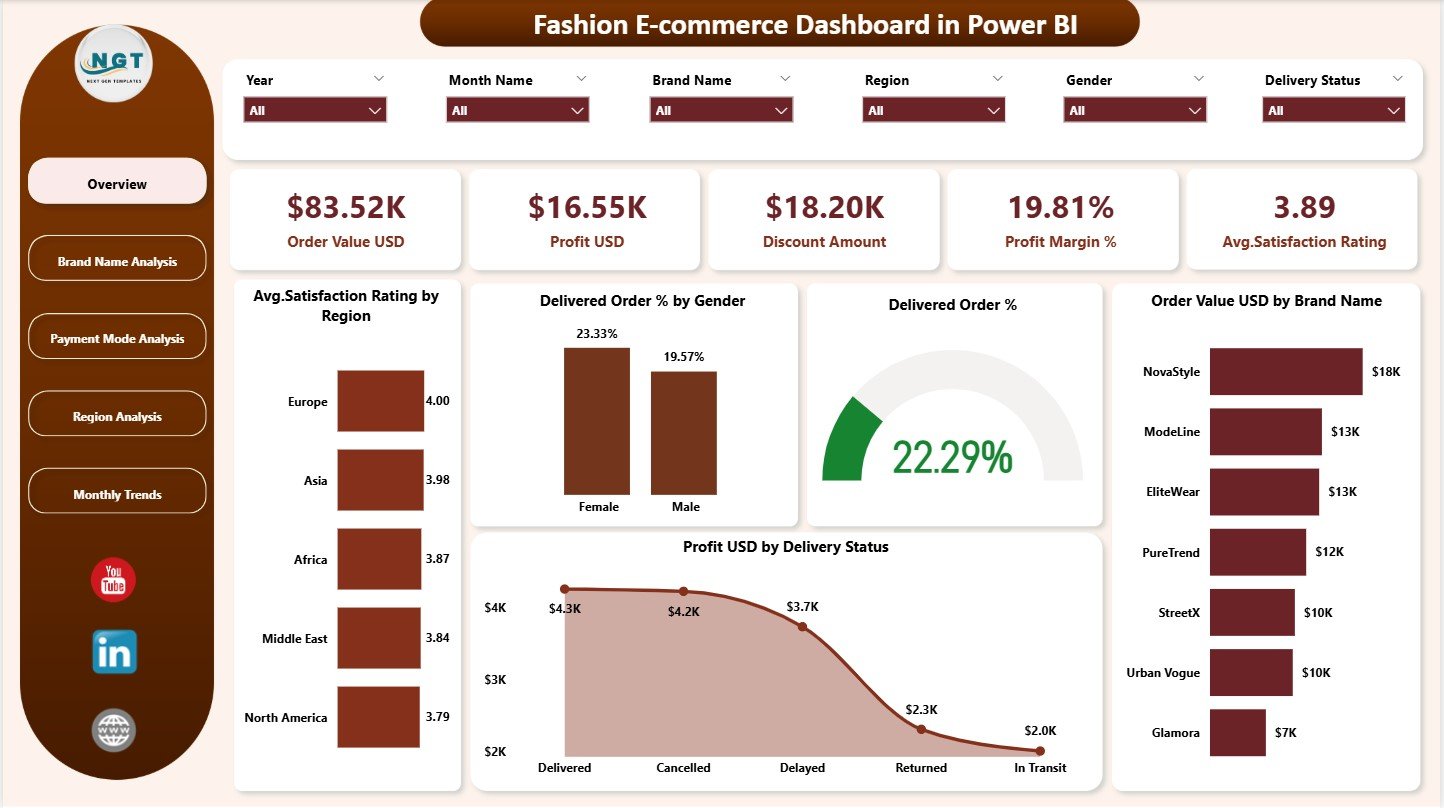
📊 Overview Page: View order value, profit, discount amounts, satisfaction rating, and profit margin % instantly—your complete business snapshot.
📈 Trend & Performance Charts: Track delivery success, brand performance, monthly trends, and customer satisfaction patterns.
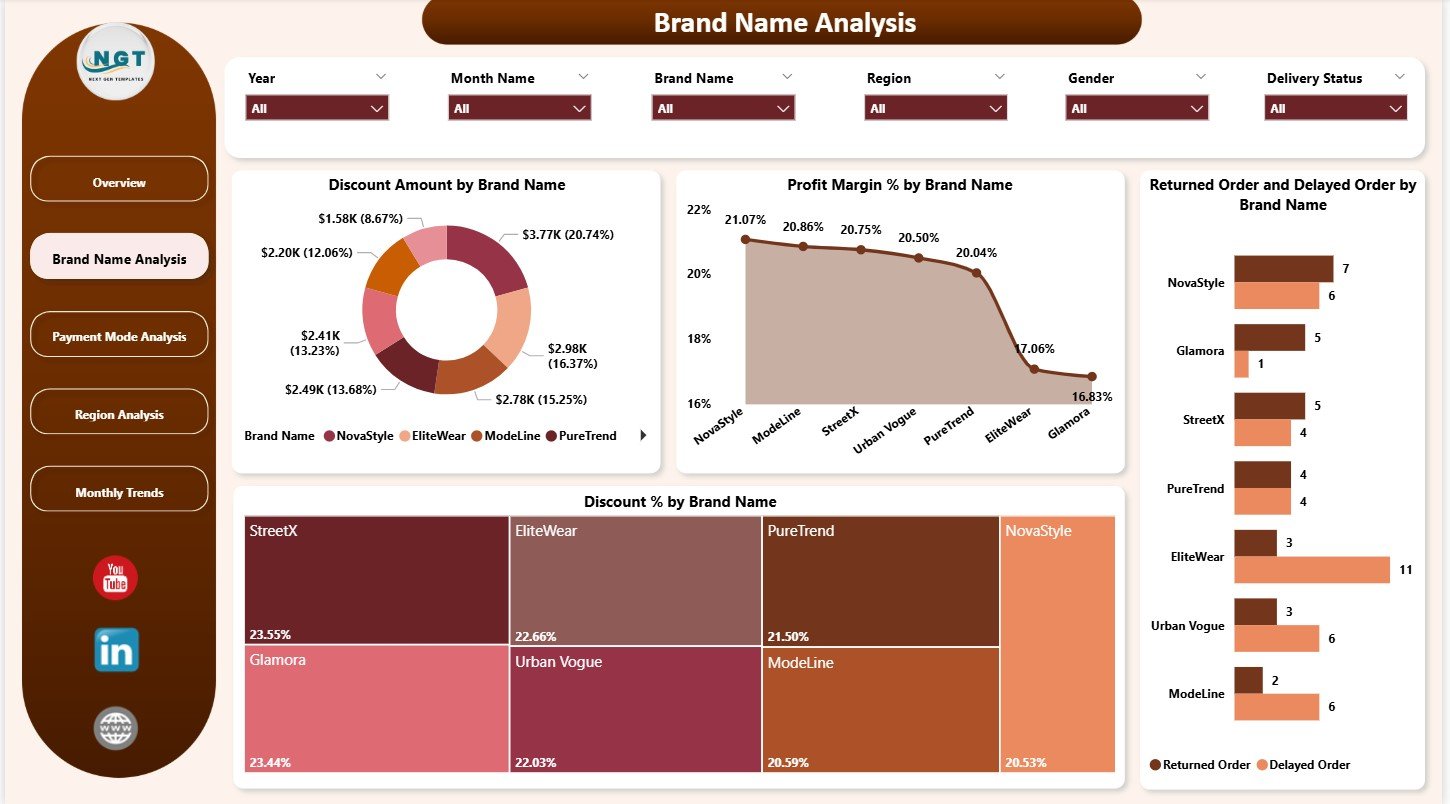
🛍️ Brand Name Analysis: Compare discount usage, profit margin, return rate, and delayed orders by brand to optimize partnerships.
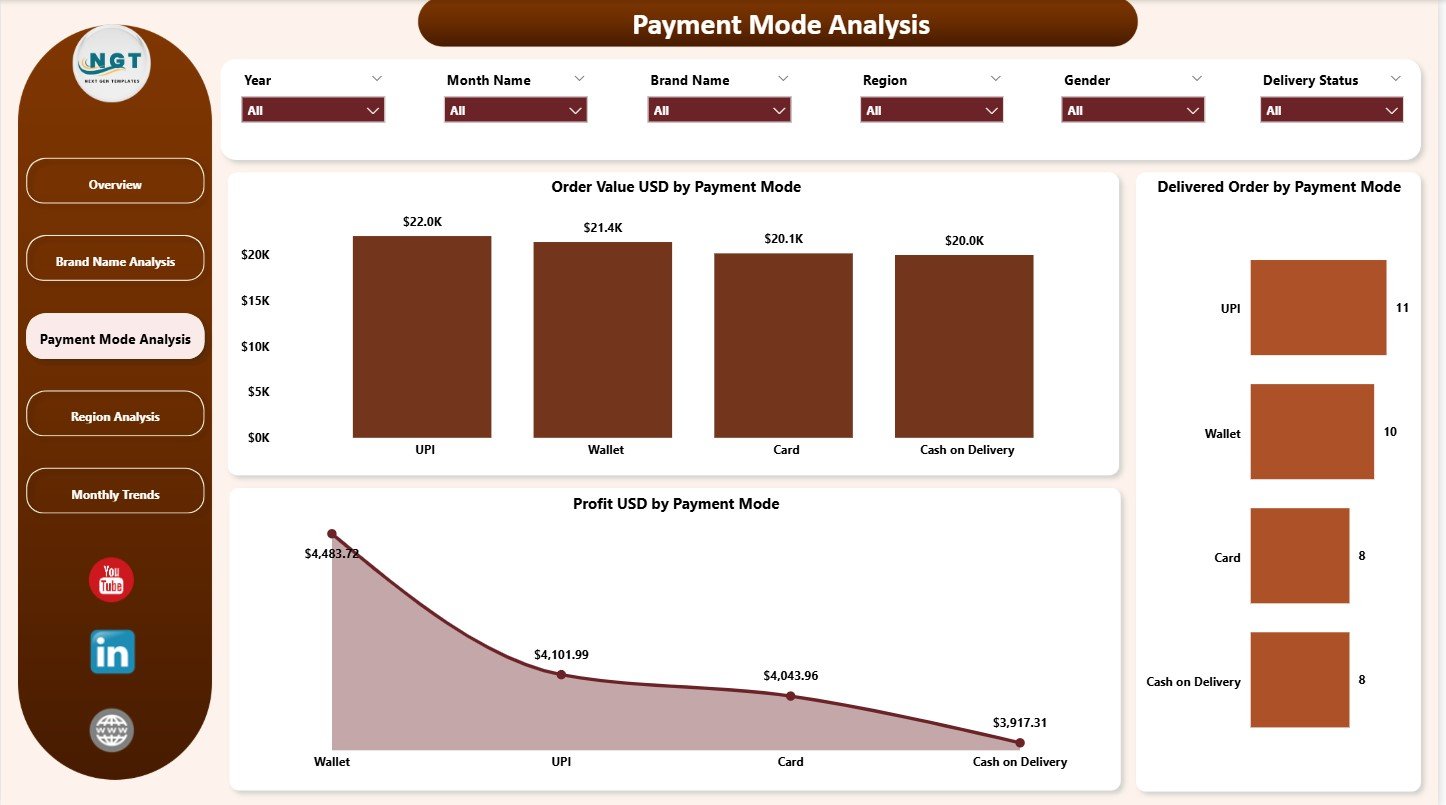
💳 Payment Mode Analysis: Understand how customers pay—cards, COD, wallets, UPI, or BNPL—and optimize payment strategy.
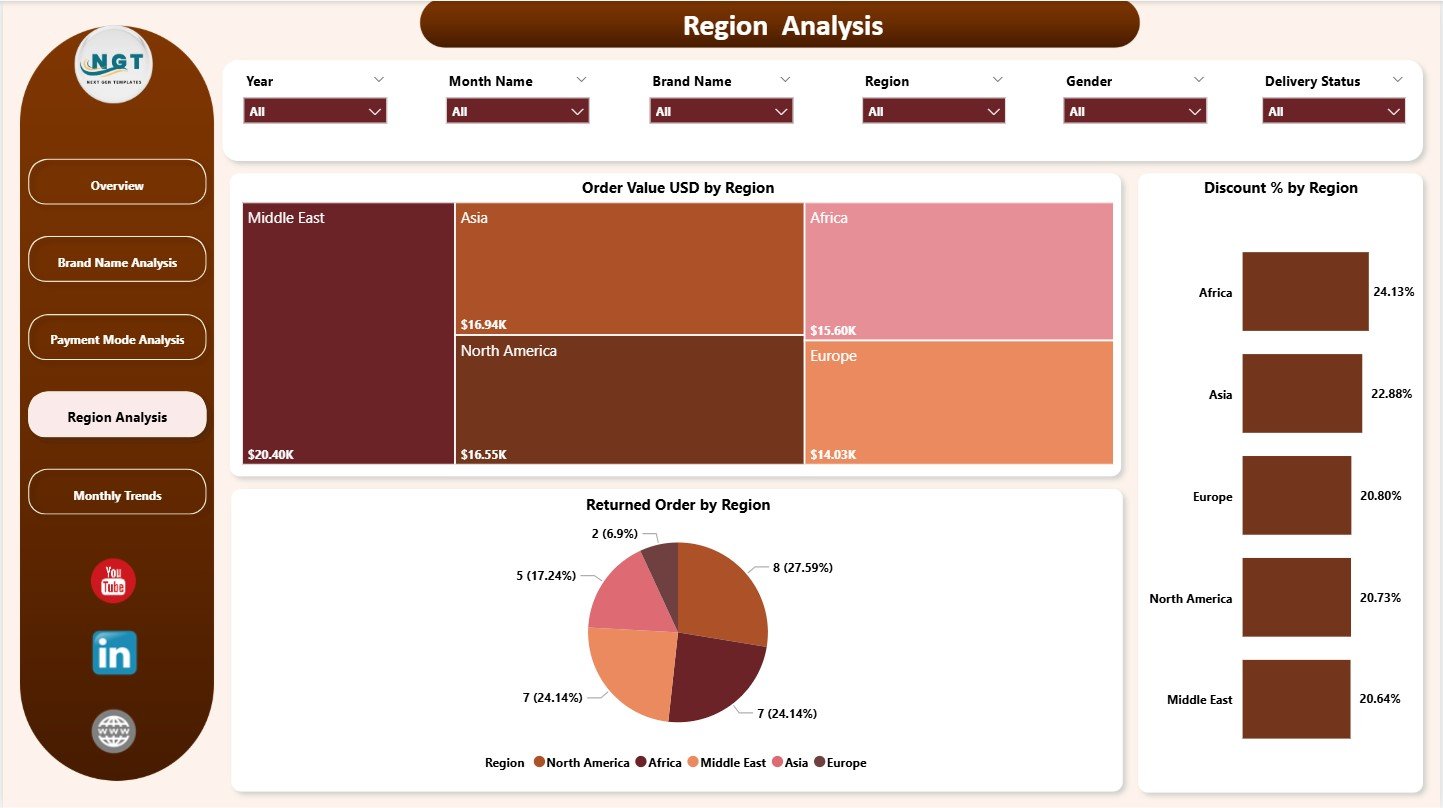
🌍 Region Analysis: Identify high-performing regions, return-heavy locations, and discount-responsive areas.
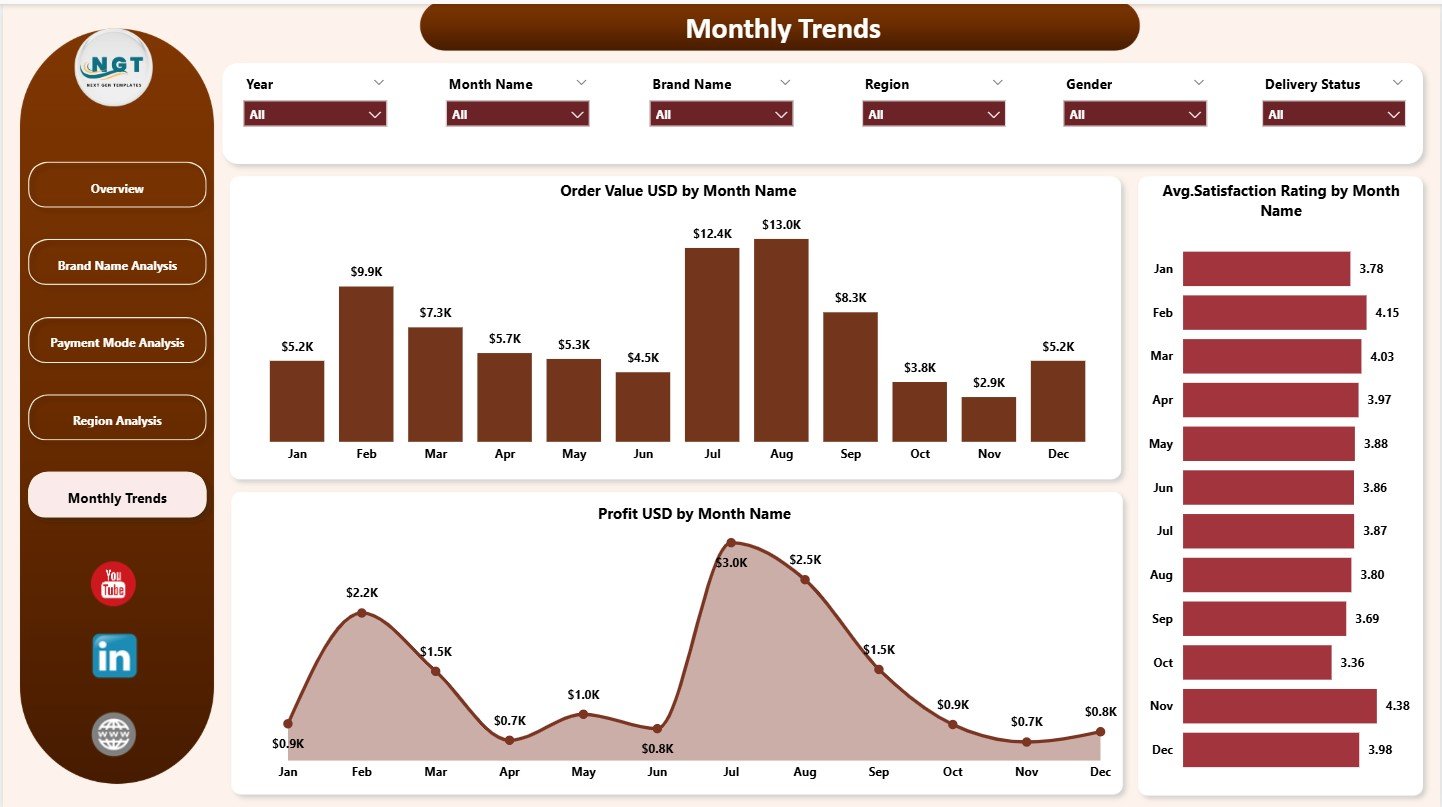
📅 Monthly Trends Page: Review monthly fluctuations in sales, satisfaction, and profit to plan campaigns and launches.
⚡ Real-Time Updates: Power BI refreshes visuals instantly, eliminating manual reporting.
🎨 Interactive Slicers: Filter data by gender, region, brand, or payment mode for deeper insights.
📦 What’s Inside the Fashion E-commerce Dashboard in Power BI
This dashboard includes all essential components fashion brands need to understand their performance clearly:
Five Interactive Dashboard Pages
Overview Page
Brand Name Analysis Page
Payment Mode Analysis Page
Region Analysis Page
Monthly Trends Page
Top KPIs Displayed:
Order Value
Profit
Discount Amount
Profit Margin %
Average Satisfaction Rating
Charts Included:
Order Value by Brand
Delivered Order %
Profit by Delivery Status
Payment Mode Insights
Regional Discounts & Returns
Monthly Sales & Profit Trends
Each page is clean, modern, and designed for quick decision-making.
🛠️ How to Use the Fashion E-commerce Dashboard in Power BI
Load your data files into Power BI following the sample structure.
Refresh the dashboard to update all components instantly.
Explore insights using the slicers provided on each page.
Review brand performance to understand discount impact, returns, and profitability.
Use payment mode and regional charts to optimize marketing and operations.
Monitor monthly trends to forecast demand and plan seasonal campaigns.
The entire dashboard is beginner-friendly—no advanced Power BI skills required.
👥 Who Can Benefit from This Fashion E-commerce Dashboard
This dashboard is useful for every major role in the fashion e-commerce ecosystem:
E-commerce Managers who need real-time performance insights
Brand & Category Managers evaluating brand-level profitability
Marketing Teams planning campaigns and discount strategies
Customer Service Teams monitoring satisfaction ratings
Operations & Logistics Teams tracking delivery success and returns
Senior Leadership making strategic business decisions
If you want clarity, speed, and improved profitability, this dashboard is designed for you.