



In the era of digital finance, mobile banking has become the cornerstone of customer convenience and financial innovation. With millions of transactions processed daily, banks and financial institutions need precise, real-time insights to maintain efficiency, track KPIs, and ensure customer satisfaction.
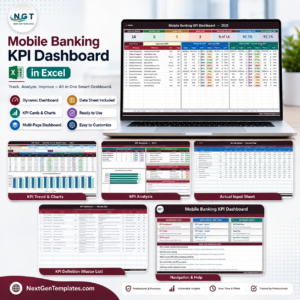
That’s where the Mobile Banking Dashboard in Excel from NextGenTemplates.com comes in — a powerful, ready-to-use template that helps banks, analysts, and financial professionals monitor key mobile banking metrics in one centralized, easy-to-use Excel file.
Built with dynamic dropdowns, slicers, and automated charts, this dashboard transforms raw financial and operational data into interactive visual insights. It allows you to analyze Month-to-Date (MTD) and Year-to-Date (YTD) performance without complex tools or coding — empowering smarter, faster, and data-driven decision-making.
⚙️ Key Features of the Mobile Banking Dashboard in Excel
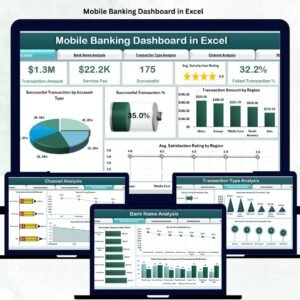
📊 5 Analytical Pages: Overview | Bank Name Analysis | Transaction Type | Channel Analysis | Monthly Trends
📂 Support & Data Sheets: Store background formulas and raw data.
📅 MTD & YTD Tracking: Monitor current month and cumulative yearly performance.
🎯 KPI Cards: Total Transactions, Processed Amount, Satisfaction %, Success Rate, and Service Fee %.
📈 Dynamic Charts: Automated visuals for region, channel, and bank-level insights.
💻 Slicers & Filters: Filter data by month, region, or KPI group instantly.
🔄 Auto-Refresh Data: Update once in the Data Sheet — the entire dashboard updates automatically.
🧩 No Coding Required: 100 % Excel-based, fully customizable, and business-ready.
📊 Dashboard Structure and Pages
🏦 1️⃣ Overview Page – The Central Performance Hub

The Overview Page gives leadership teams an instant snapshot of performance and customer experience.
Features:
Page Navigator: Quick navigation across dashboard pages.
Right-Side Slicers: Filter by month, KPI group, or region.
Five KPI Cards: Show total transactions, amount processed, satisfaction score, success rate, and service fee %.
Charts Included:
Success Transactions by Account Type
Total Transactions
Transaction Amount by Region
Average Satisfaction Rating by Region
💡 Purpose: Provide a high-level overview of mobile banking operations in a single glance.
🏛️ 2️⃣ Bank Name Analysis – Compare Bank-Wise Performance
Evaluate how each bank or financial entity performs within your mobile ecosystem.
Charts Included:
Transaction Amount by Bank Name
Service Fee by Bank Name
Failed vs Successful Transactions by Bank
💡 Purpose: Identify top-performing banks, detect inefficiencies, and assess fee contribution by institution.
💸 3️⃣ Transaction Type Analysis – Understand User Behavior
Explore which transaction categories drive the most engagement or revenue.
Charts Included:
Service Fee by Transaction Type
Transaction Amount by Transaction Type
Successful Transactions by Transaction Type
💡 Purpose: Track usage trends across transfers, bill payments, recharges, deposits, and more.
📱 4️⃣ Channel Analysis – Evaluate Digital Efficiency
Compare the performance of different digital channels like mobile apps, web portals, SMS, and USSD.
Charts Included:
Transaction Amount by Channel
Service Fee by Channel
Average Satisfaction Rating by Channel
💡 Purpose: Identify the most profitable and user-friendly digital channels.
📅 5️⃣ Monthly Trends – Analyze Performance Over Time
Monitor growth, fluctuations, and seasonality with visual time-series trends.
Charts Included:
Transaction Amount by Month
Pending Transaction % by Month
Average Satisfaction Rating by Month
💡 Purpose: Track long-term performance and forecast future activity accurately.
⚙️ Supporting Sheets
Support Sheet: Handles lookup formulas, calculations, and slicer logic.
Data Sheet: Stores all transactional and KPI data — once updated, all visuals refresh automatically.
🌟 Advantages of the Mobile Banking Dashboard
✅ 360° Visibility: Unified view of financial, operational, and satisfaction metrics.
📈 Real-Time Insights: Track transaction success rates and satisfaction trends live.
💰 Revenue Intelligence: Monitor service fees and regional income contributions.
📊 Historical Comparison: Analyze MTD, YTD, and PY (Previous Year) trends side by side.
⚙️ Automation: Eliminates manual reporting and speeds up monthly reviews.
🔍 Transparency: Clear visibility across teams — from operations to management.
💡 Scalability: Add more KPIs, regions, or banks effortlessly.
💡 Key KPIs to Track
Transaction KPIs
Total Transactions (Count)
Success Rate (%)
Failed Transactions (%)
Pending Transactions (%)
Financial KPIs
Transaction Amount (USD)
Service Fee (USD)
Average Transaction Value (USD)
Customer KPIs
Average Satisfaction Rating
Complaint Rate (%)
Response Time (Minutes)
Channel KPIs
Transactions by Channel
Revenue by Channel
💡 All KPIs are fully automated for accurate, up-to-date analysis.
🧠 Best Practices for Using This Dashboard
📅 Update Data Monthly for accurate trend tracking.
✅ Validate Input Figures before analysis.
📊 Highlight Critical KPIs using conditional formatting.
🔐 Secure Data Access to protect financial information.
📈 Use Monthly Trends to anticipate seasonal patterns.
👥 Review Channel Performance regularly to optimize efficiency.
👩💼 Who Can Use This Dashboard
🏦 Bank Operations Managers
💳 Digital Banking Analysts
📈 Financial Planning Teams
📊 Customer Experience Officers
💼 Senior Management in FinTech
🧩 Conclusion
The Mobile Banking Dashboard in Excel is a complete digital banking performance solution, empowering financial institutions to make informed, data-driven decisions.
It tracks operational efficiency, financial KPIs, and customer experience seamlessly — without requiring BI software or technical skills.
💳 Monitor smarter. Analyze deeper. Serve better — with NextGen Templates’ Mobile Banking Dashboard in Excel.
🔗 Click Here to Read the Detailed Blog Post
📺 Visit our YouTube Channel for step-by-step tutorials.
Watch the step-by-step video tutorial:
Compatibility and Requirements
- Works in Microsoft Excel desktop (Excel 2016 or later, or Microsoft 365).
- The Overview page has slicers on the right side to filter by month, KPI group or region. Microsoft explains them in Use slicers to filter data.
Frequently Asked Questions
Which pages does the dashboard have?
Five analytical pages: Overview, Bank Name Analysis, Transaction Type, Channel Analysis and Monthly Trends. Two supporting sheets, Support Sheet and Data Sheet, hold the formulas and the raw data.
How do I update the dashboard with my own data?
Enter your transactional and KPI data in the Data Sheet. The charts and KPI cards refresh from that sheet, so you do not edit the dashboard pages.
Which KPI cards are on the Overview page?
Five cards: total transactions, amount processed, satisfaction score, success rate and service fee %.
Can I compare banks and channels?
Yes. The Bank Name Analysis page compares transaction amount, service fee and failed versus successful transactions by bank. The Channel Analysis page compares transaction amount, service fee and average satisfaction rating by channel.
Is there a Power BI version?
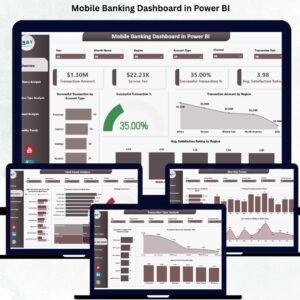
Yes. See the Mobile Banking Dashboard in Power BI.
Related Banking Templates
- Mobile Banking Dashboard in Power BI: the same topic as a Power BI dashboard
- Mobile Banking KPI Dashboard in Excel: a KPI-focused view of mobile banking
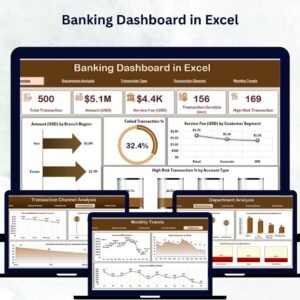
- Banking Dashboard in Excel: a dashboard for banking performance in general
- Banking KPI Dashboard in Excel: KPI tracking for banks
- Banking Report in Excel: a report format for banking figures
Browse all Excel dashboards.









Reviews
There are no reviews yet.