

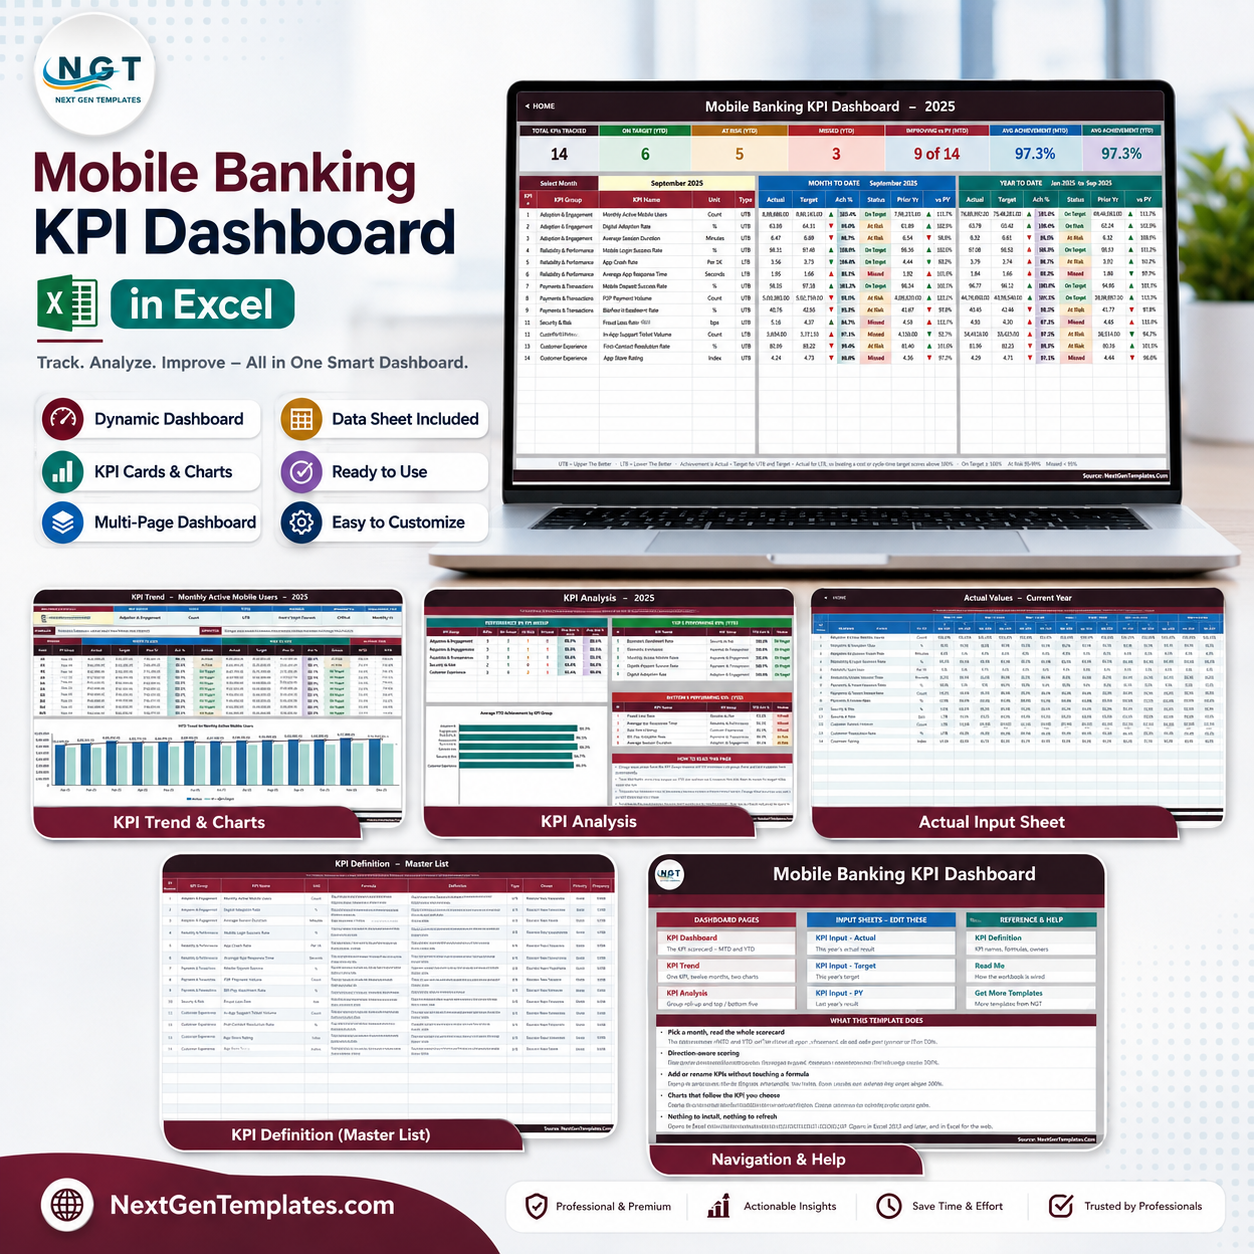
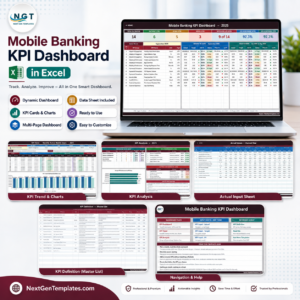
Mobile Banking KPI Dashboard in Excel turns 14 digital-channel measures into one month-driven scorecard with MTD and YTD actuals, targets, prior-year comparisons, achievement percentages, and direction-aware status flags. The workbook covers five groups: Adoption & Engagement, Reliability & Performance, Payments & Transactions, Security & Risk, and Customer Experience. It is 100% formula-driven: no macros, Power Query, Power Pivot, add-ins, or refresh process. Replace the sample data, choose a month, and review the whole scorecard. You receive an editable Excel file with sample data, lifetime access, and no subscription or per-user fee.
Key Features of Mobile Banking KPI Dashboard in Excel
- 14 ready-made mobile banking KPIs: monthly active mobile users, digital adoption, login success, app crash rate, response time, mobile deposit success, P2P payment volume, biometric enrolment, fraud loss rate, first-contact resolution, and more.
- MTD and YTD monitoring: the dashboard places actual, target, achievement, status, prior year, and year-on-year movement side by side.
- Correct UTB/LTB scoring: lower-is-better measures such as crash rate, response time, fraud loss, and ticket volume score correctly when they fall.
- Traffic-light thresholds: On Target starts at 100%, At Risk covers 95%-99%, and Missed is below 95%; the formula thresholds can be adjusted.
- One-KPI trend view: select any KPI to redraw its 12-month MTD and YTD charts and display its group, unit, owner, priority, formula, and definition.
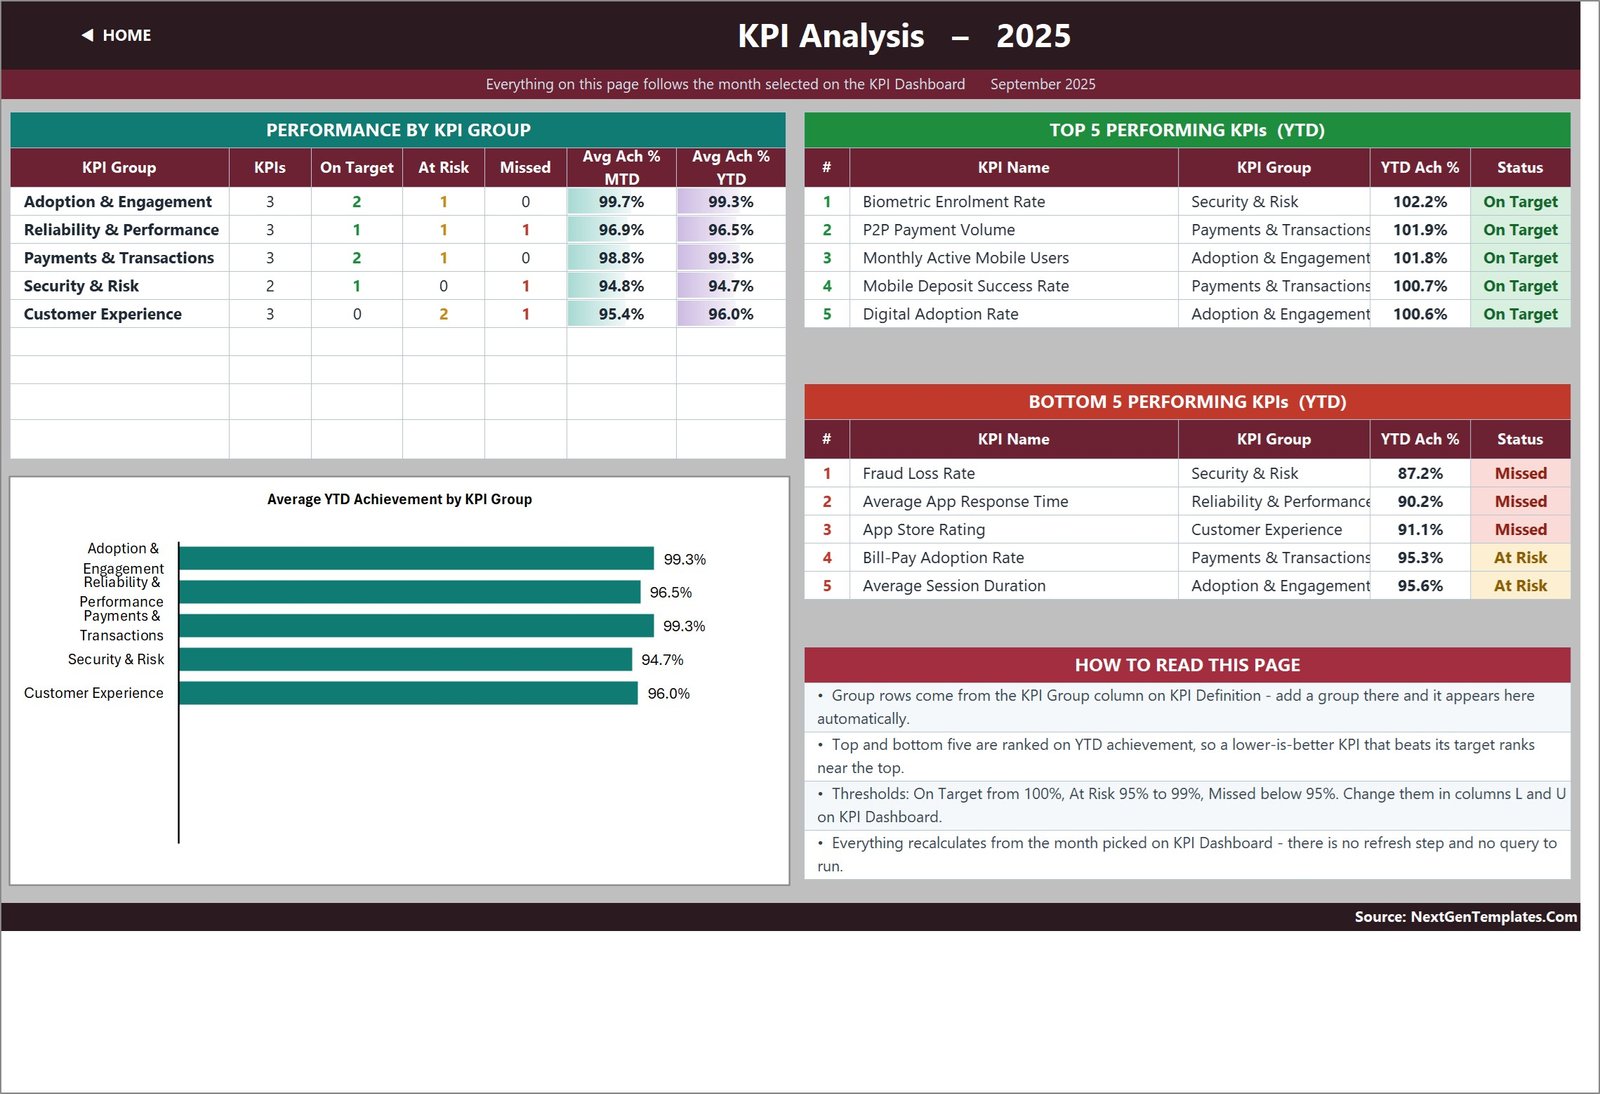
- Group analysis: compare average achievement by KPI group and identify the top and bottom five KPIs for the selected period.
- Capacity for 22 KPIs: 14 rows are prefilled and eight live rows remain ready for your additions.
What’s Inside the Mobile Banking KPI Dashboard in Excel
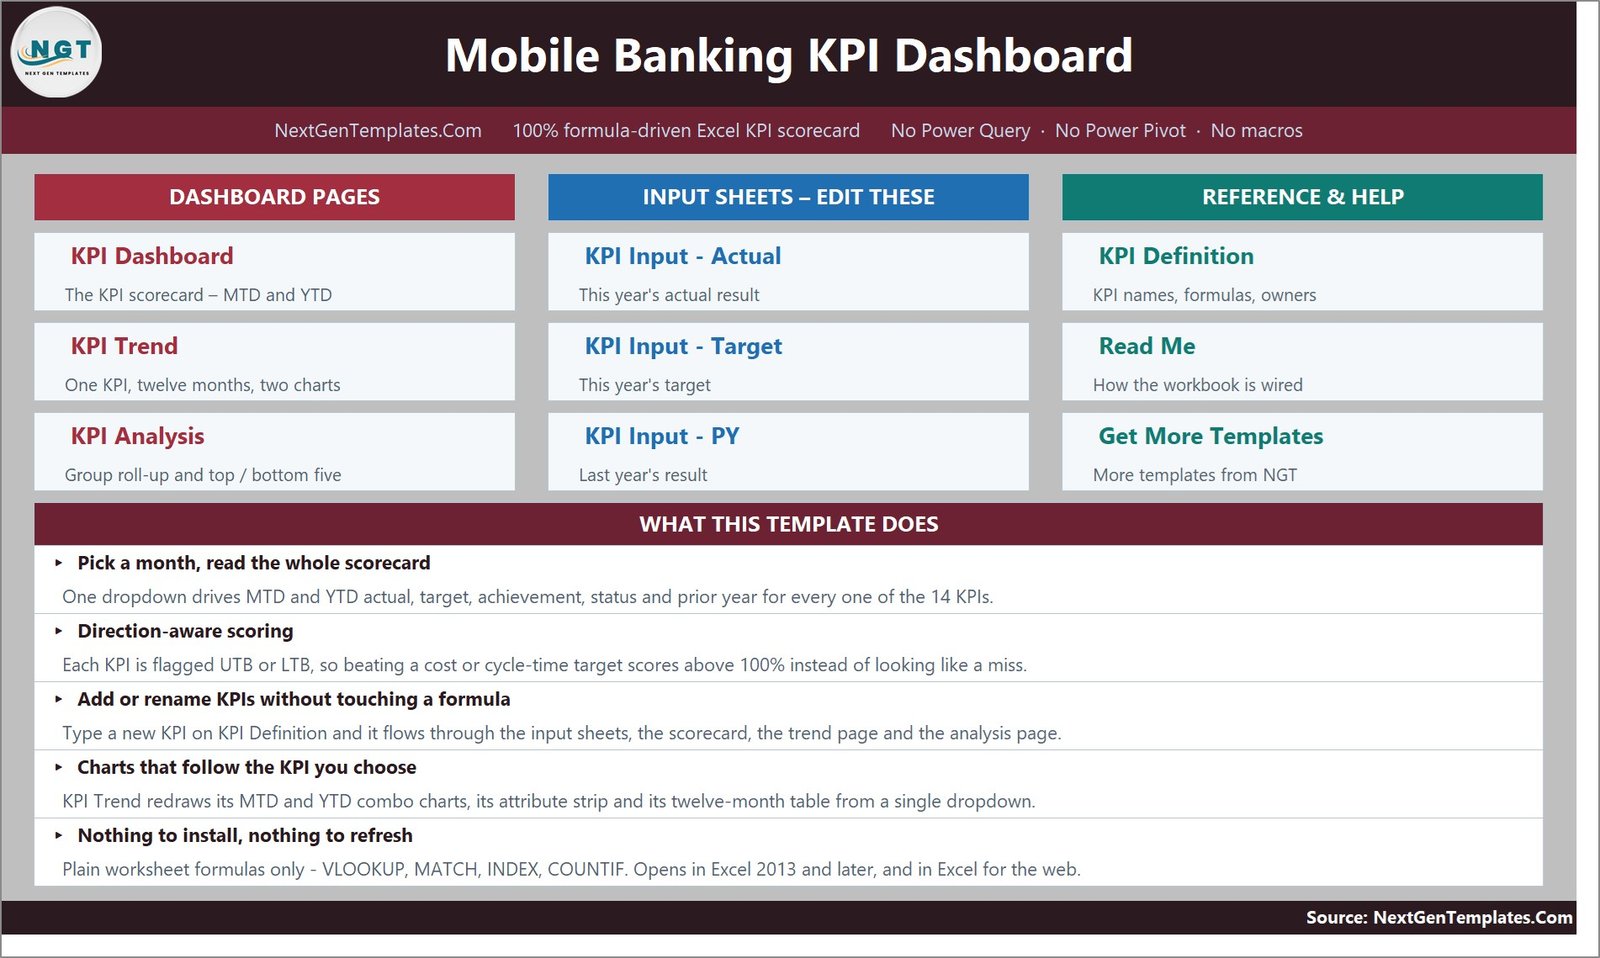
1. Home and Workbook Map
The Home page separates dashboard pages, editable input sheets, and reference/help sheets. It also explains the formula-only design and the five-minute workflow.
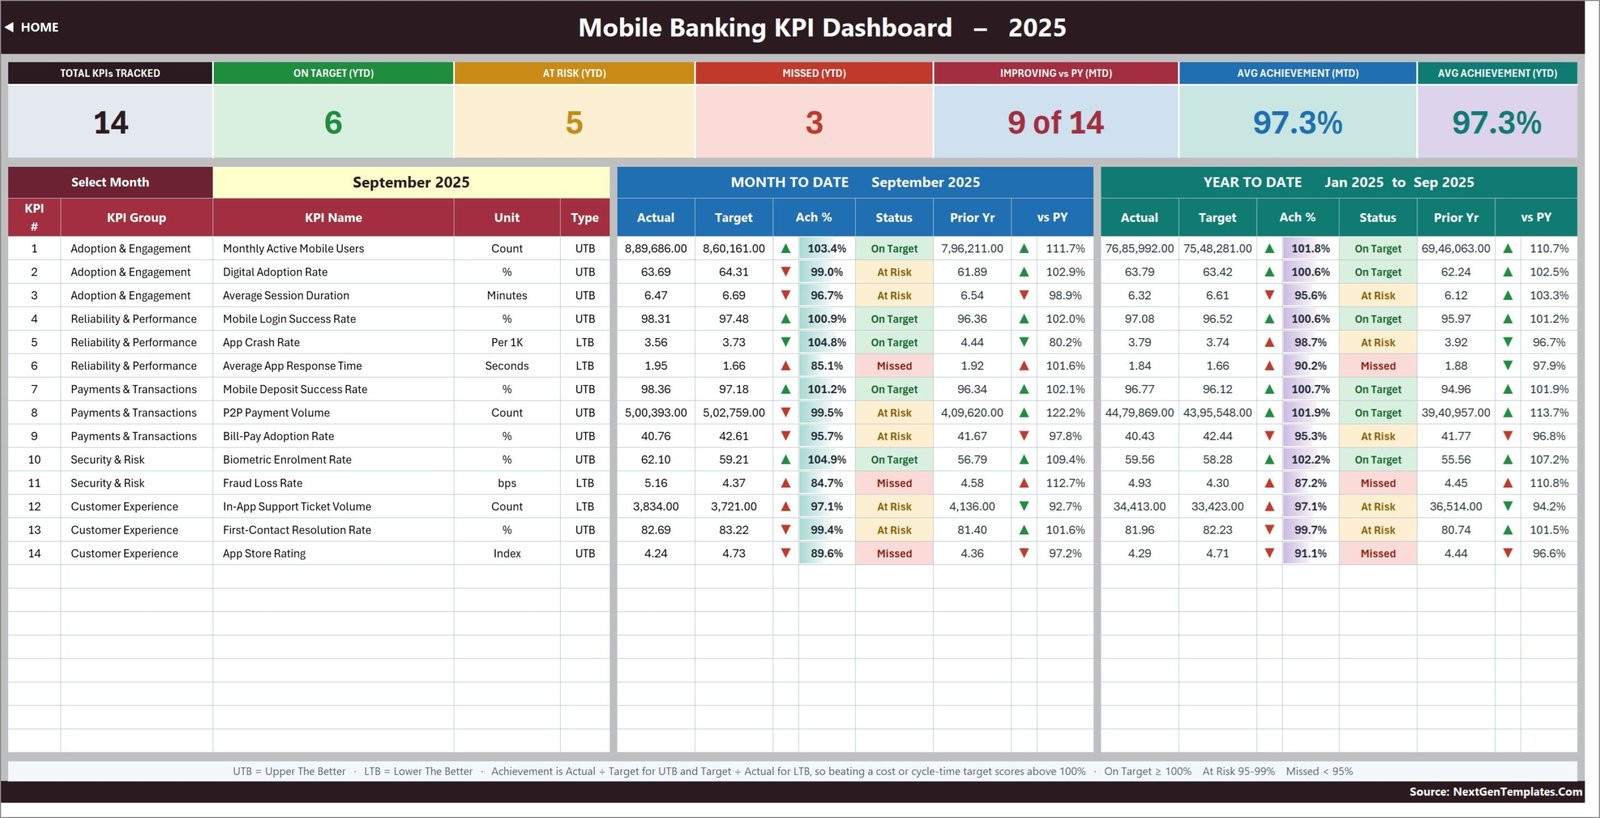
2. KPI Dashboard
Select a month to update seven summary cards and all 14 KPI rows. Each row shows MTD and YTD actual, target, achievement, status, prior year, and movement versus prior year.
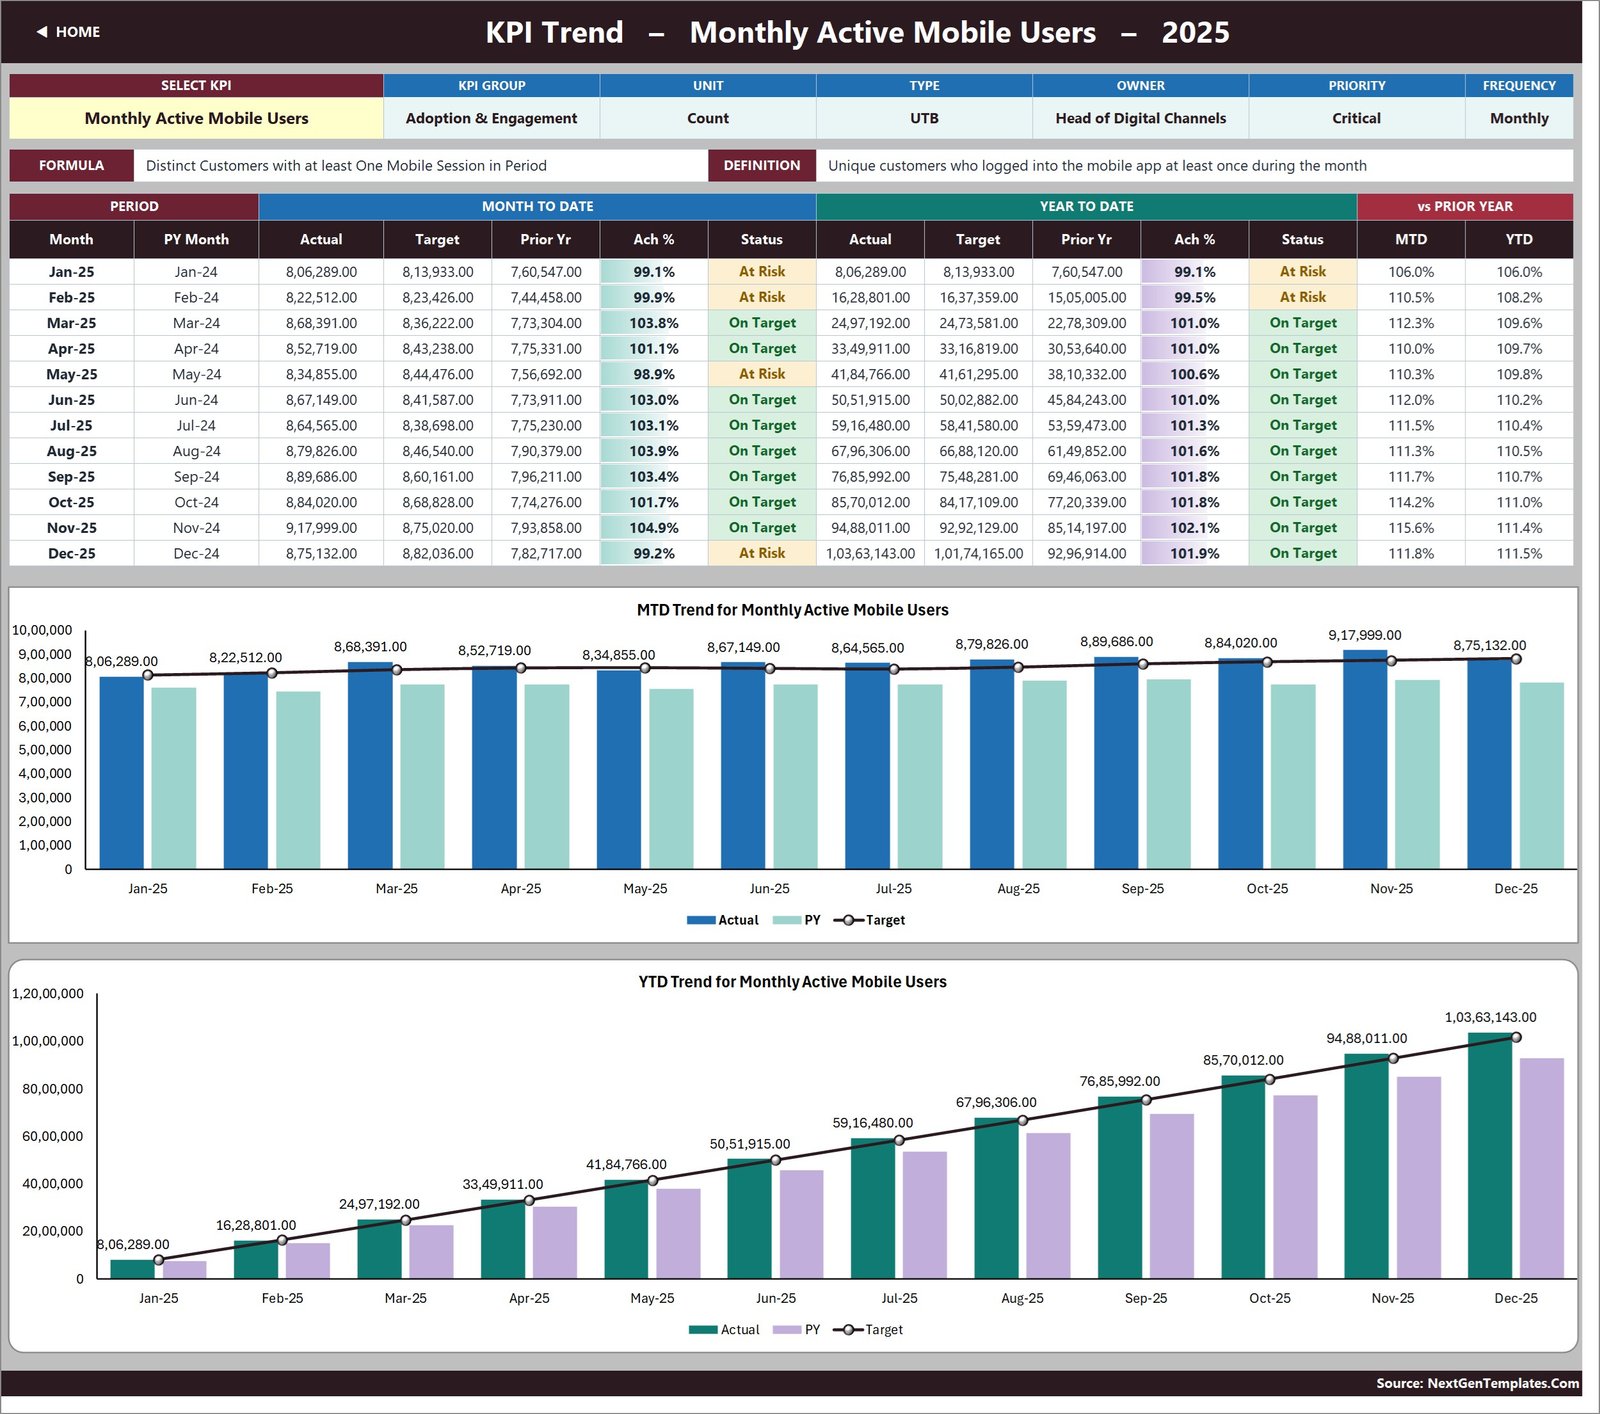
3. KPI Trend
Choose one KPI to see its 12-month table plus MTD and YTD charts for actual, target, and prior year.
4. KPI Analysis
This page rolls performance up by KPI group, charts average YTD achievement, and ranks the top and bottom five KPIs.
5. Actual Values
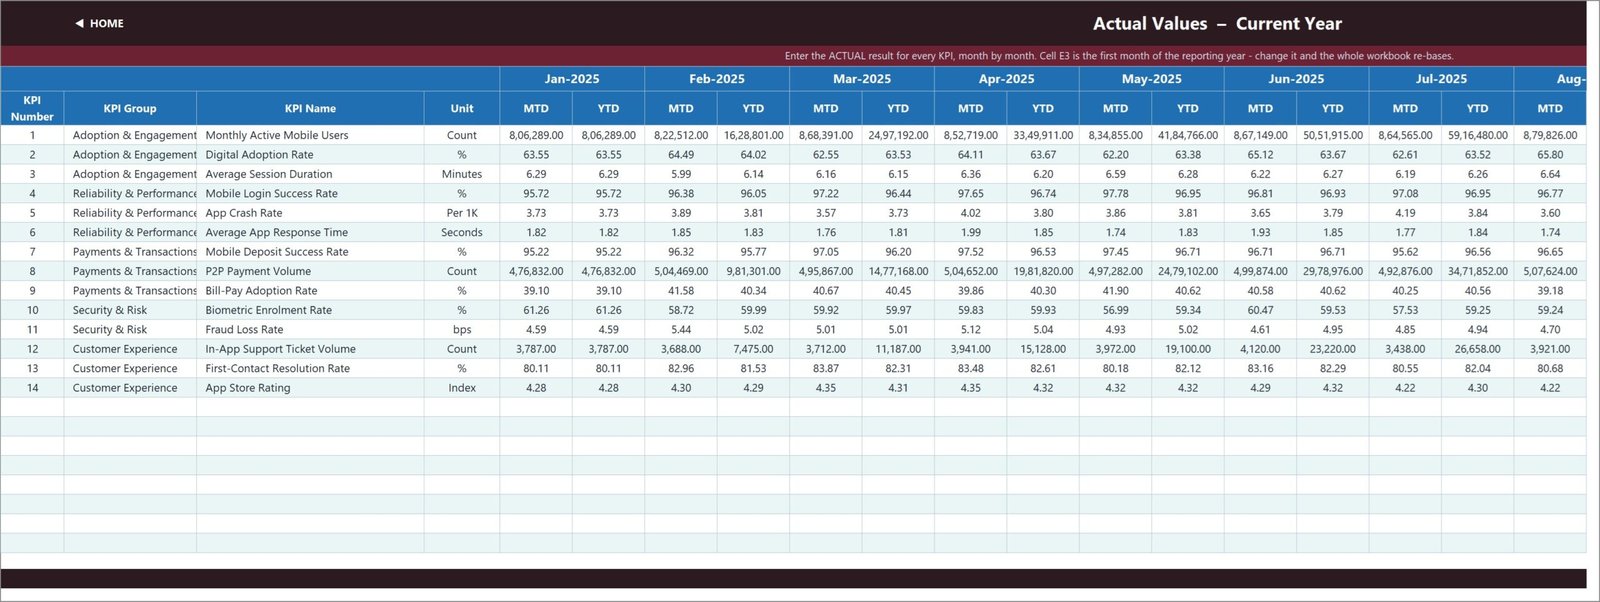
Enter current-year MTD and YTD results month by month. Changing the first reporting month rebases the workbook.
6. Target Values
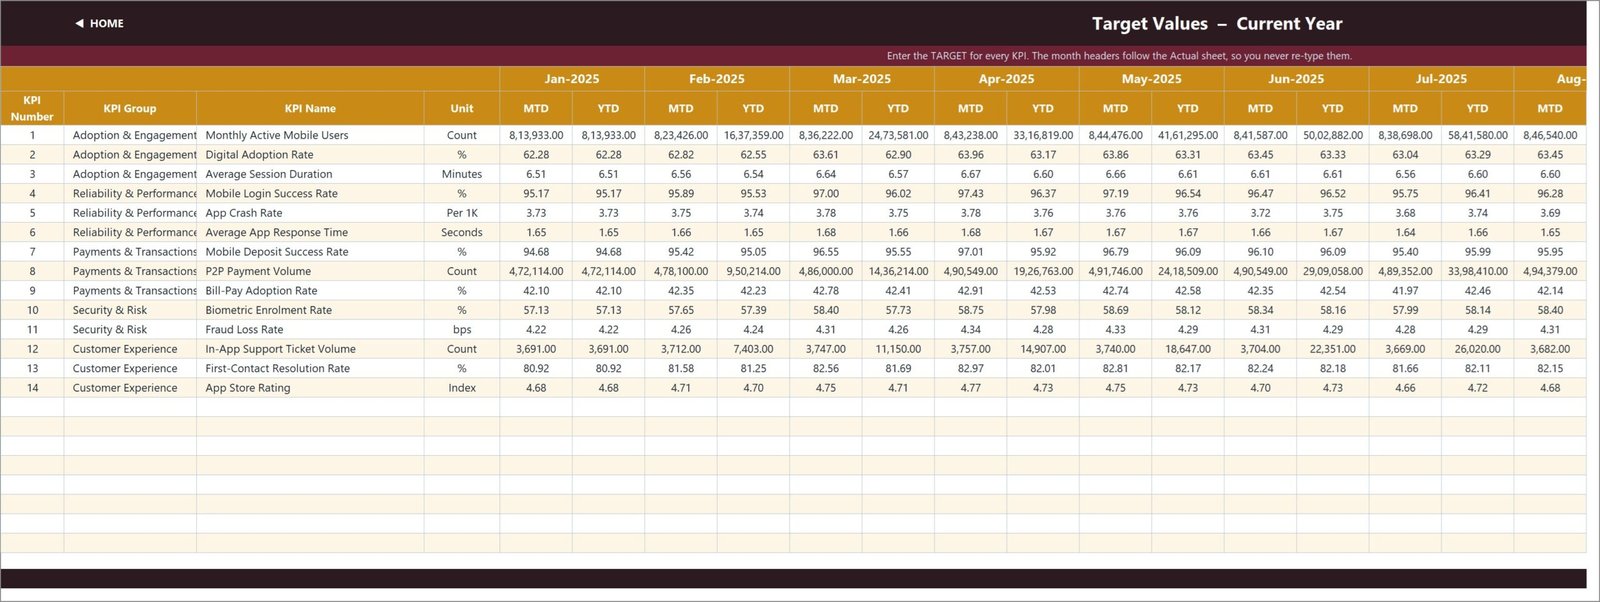
Store monthly targets using the same rows and periods as the actual sheet.
7. Prior Year Values
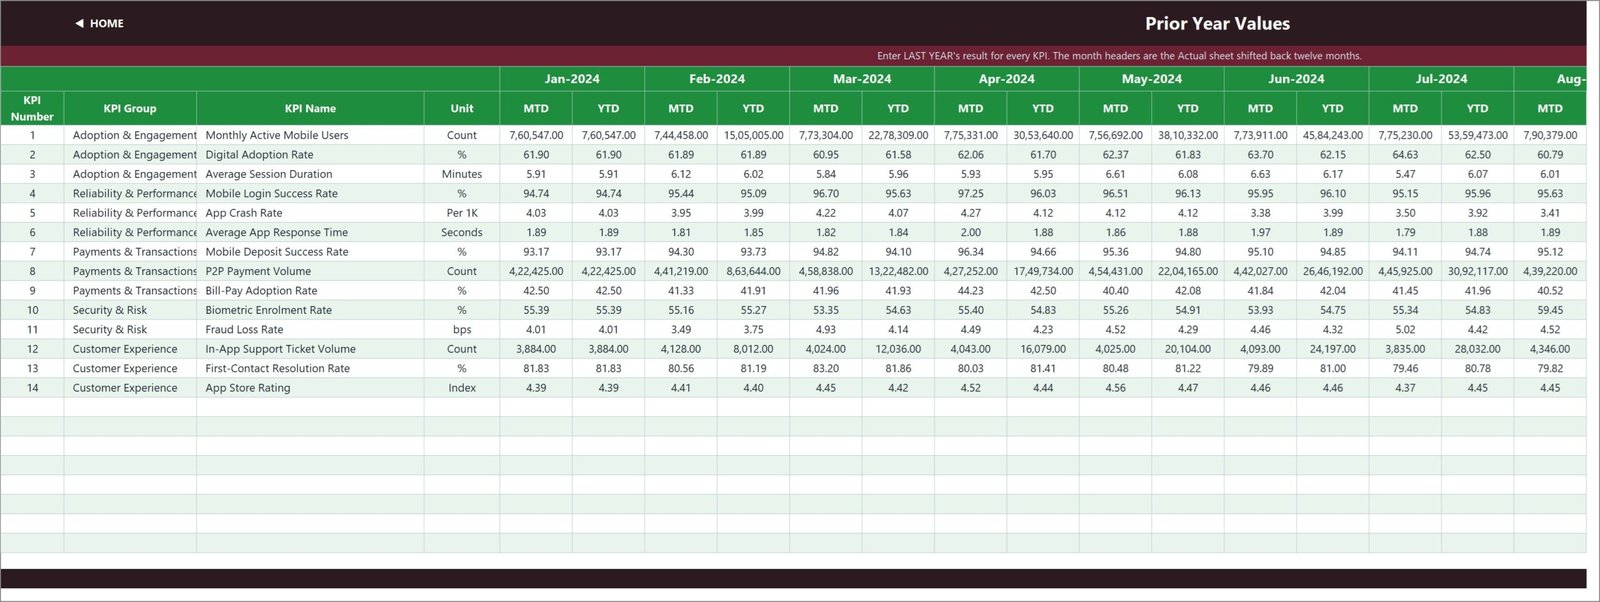
Enter last year’s comparable results to enable MTD and YTD year-on-year analysis.
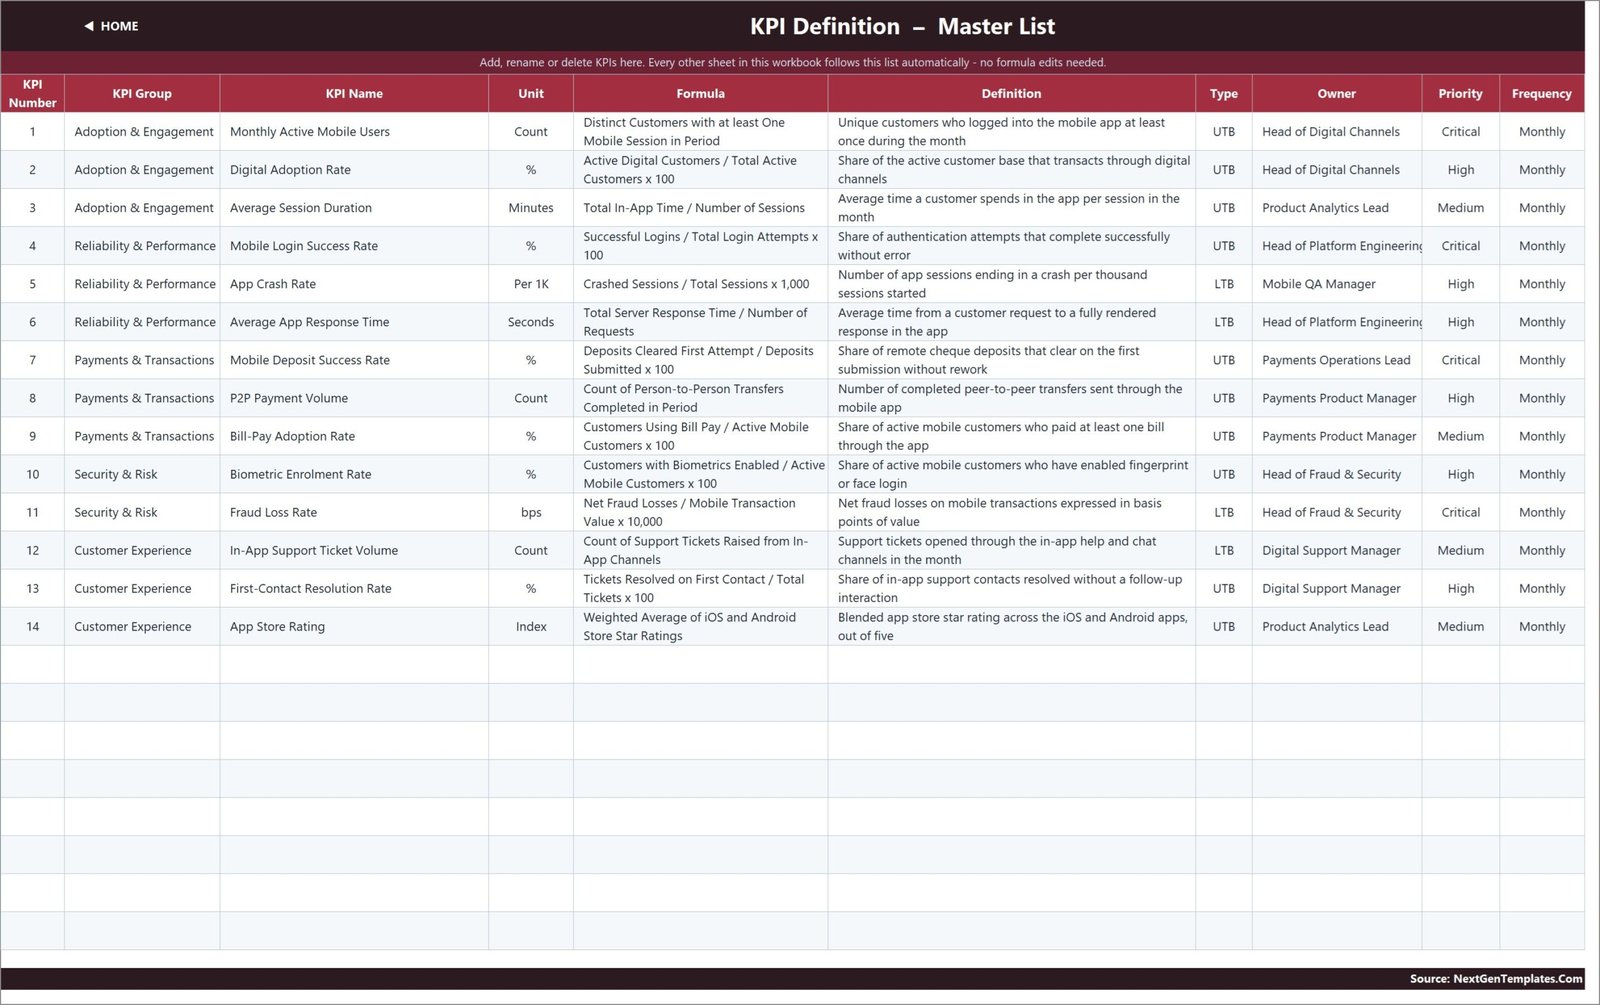
8. KPI Definition Master List
Maintain the KPI group, name, unit, formula, definition, UTB/LTB type, owner, priority, and frequency in one master list.
9. Read Me
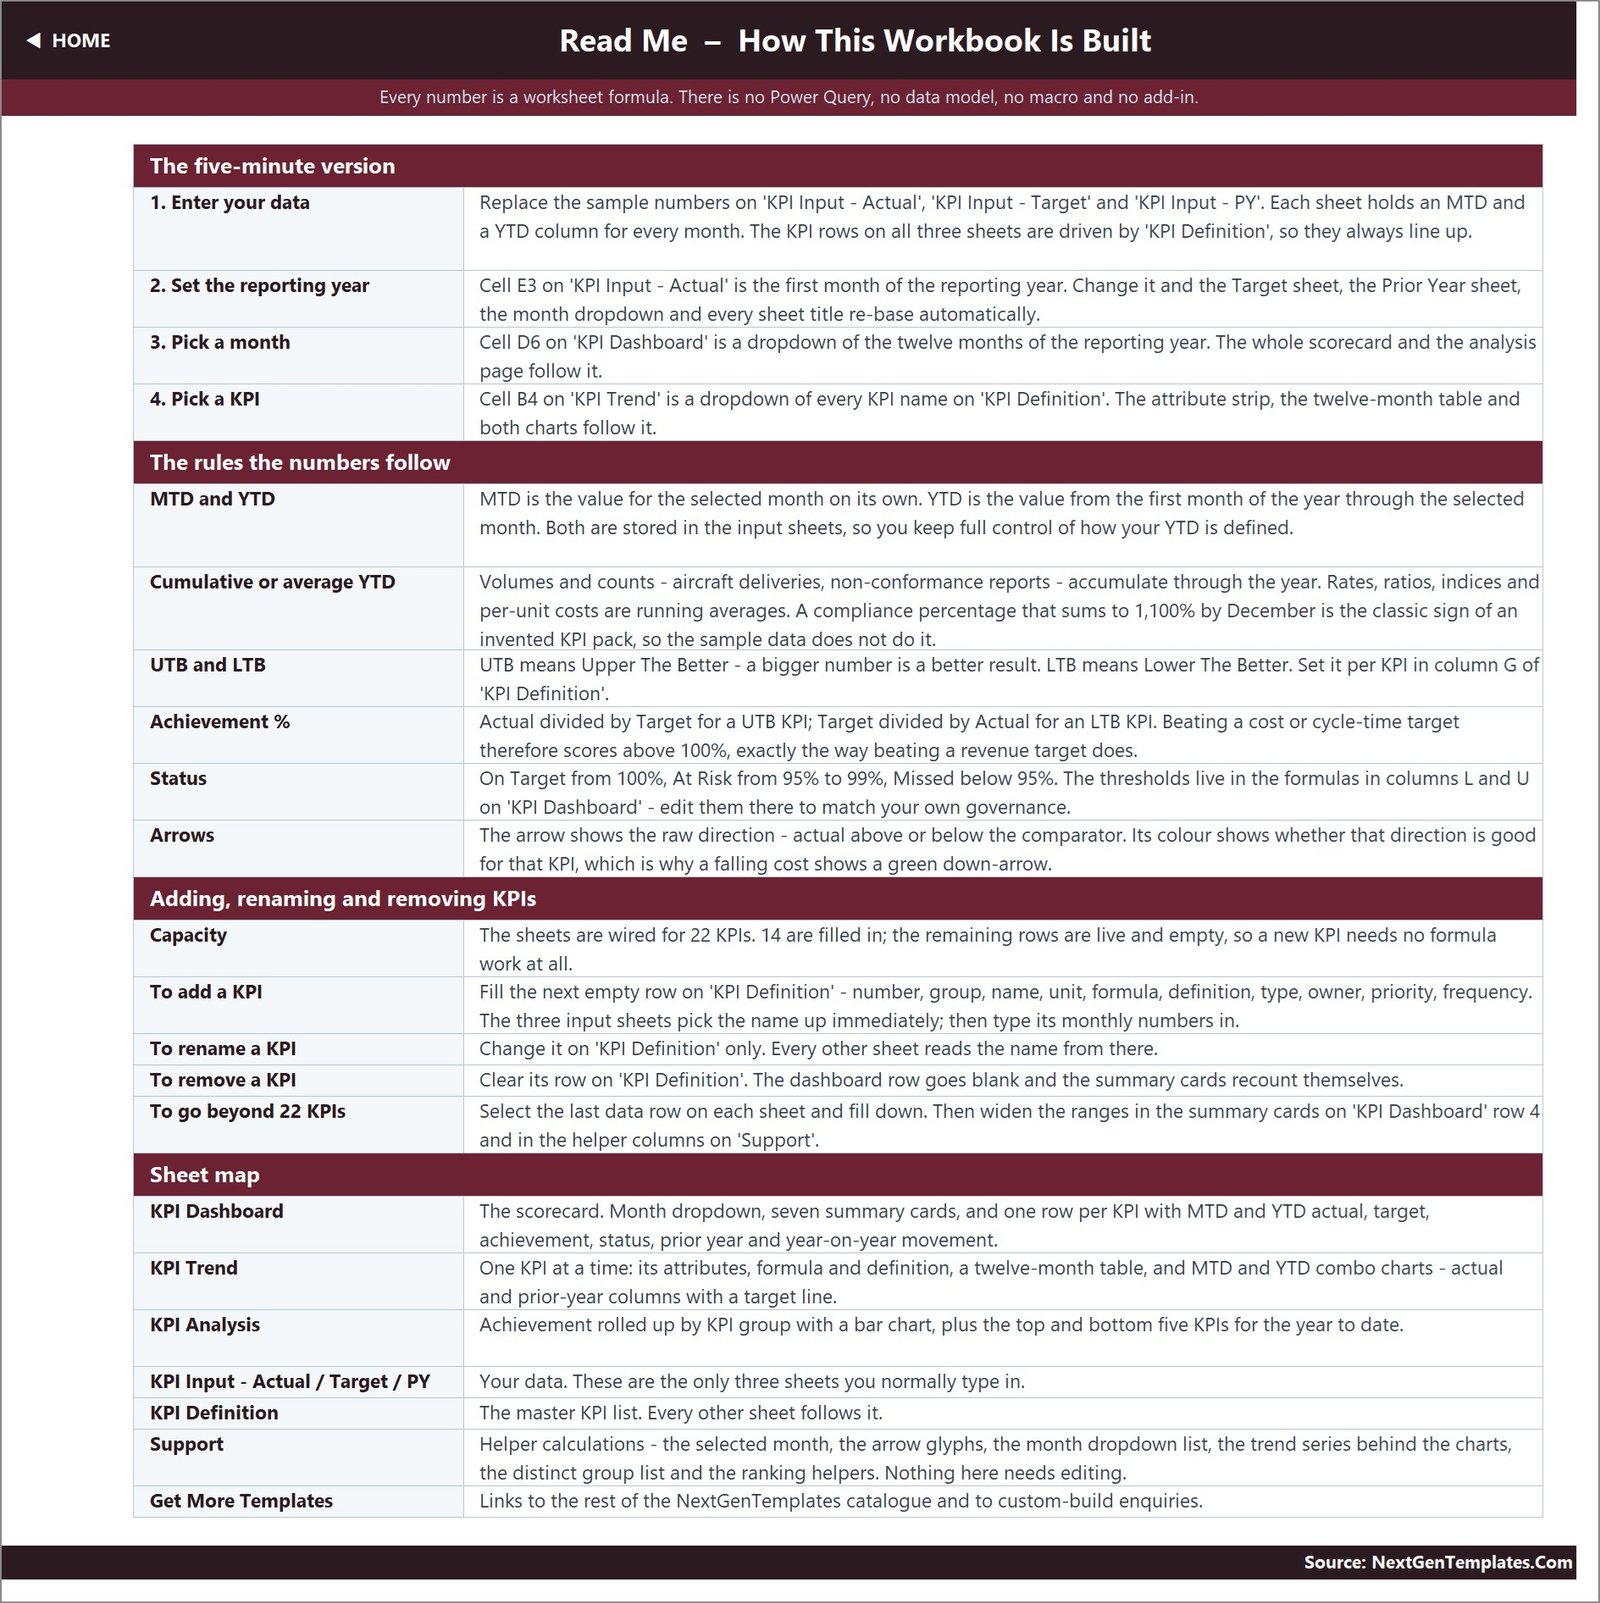
The built-in guide explains data entry, reporting-year setup, month and KPI selectors, achievement rules, thresholds, arrows, and how to add or remove KPIs.
10. Get More Templates
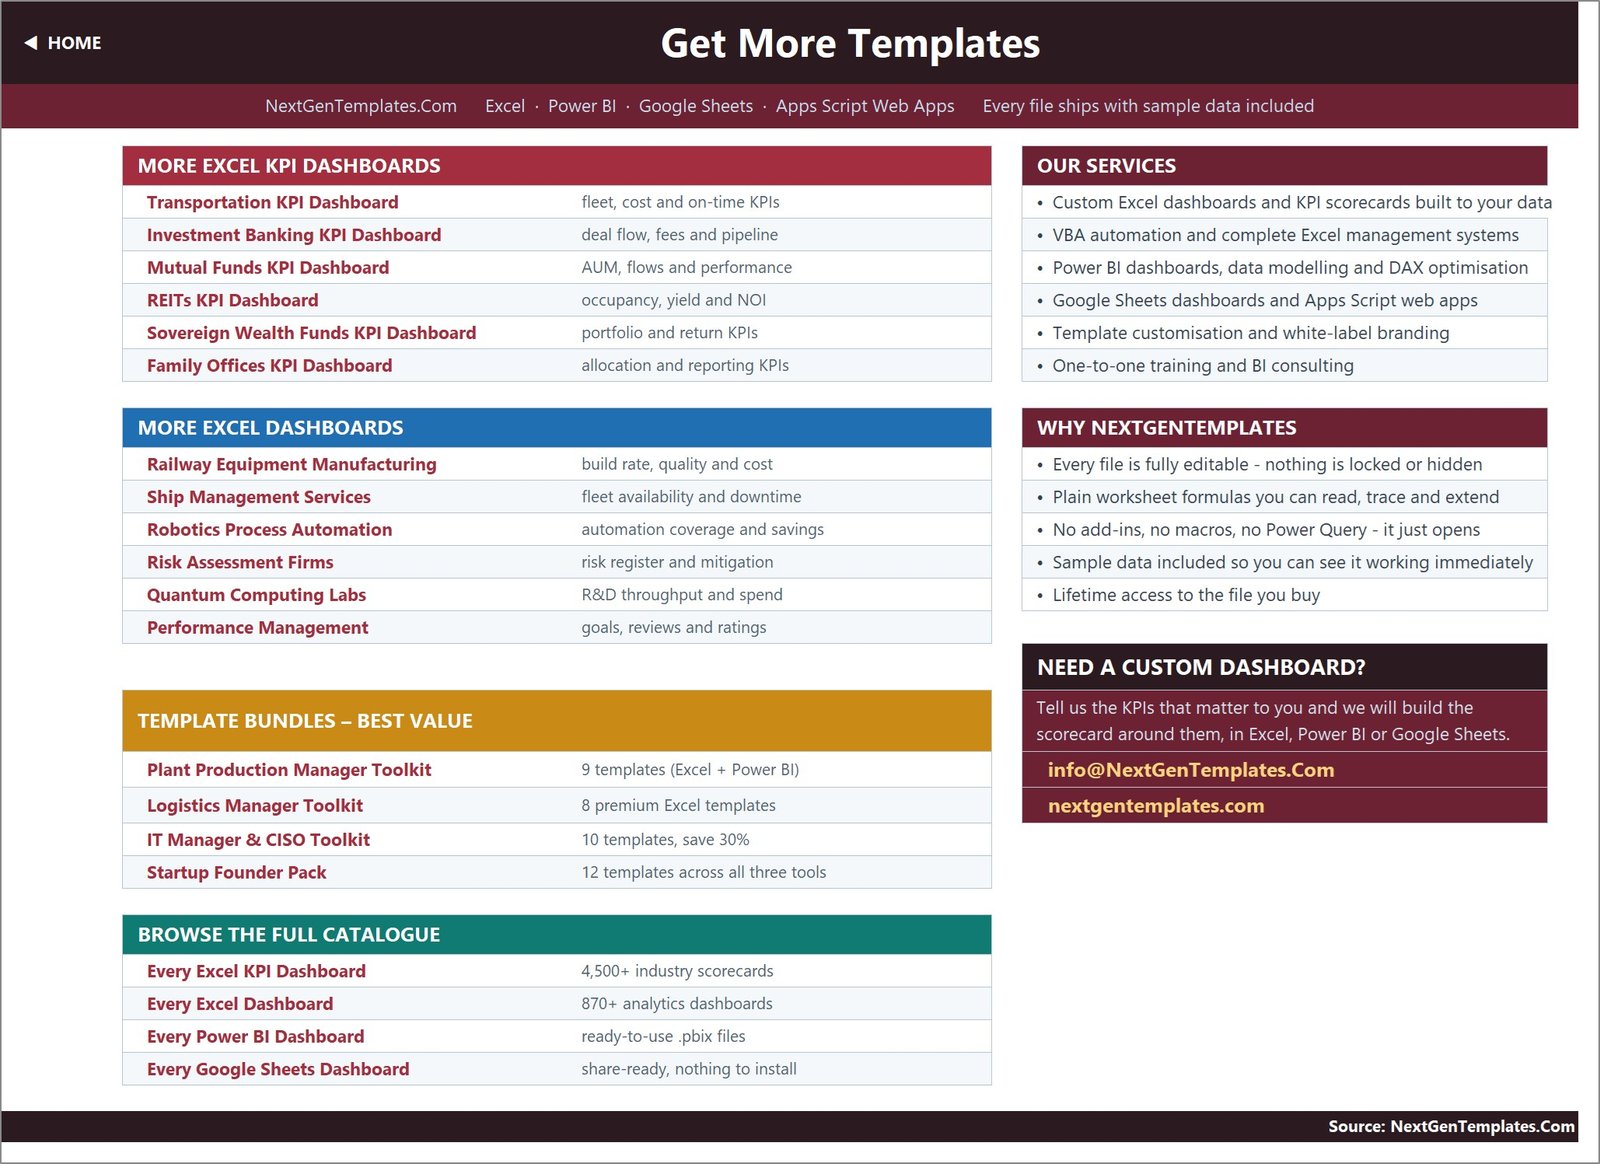
A catalogue sheet points to related KPI scorecards, dashboards, bundles, and custom dashboard services.
Mobile Banking KPI Dashboard in Excel vs. Google Sheets vs. Banking Analytics SaaS – Where This Fits
| Area | This Excel template | Google Sheets alternative | Banking analytics SaaS |
|---|---|---|---|
| Cost | One-time purchase | Low platform cost, manual build | Recurring licence |
| Setup | Replace sample figures | Build formulas and charts | Configuration and integration |
| Offline use | Yes | Limited | Usually no |
| Live core-banking feeds | No | No by default | Often available |
| Custom KPI definitions | Fully editable | Fully editable | Vendor dependent |
| Collaboration | SharePoint/OneDrive or file sharing | Native simultaneous editing | Role-based portal |
| Best fit | Monthly management scorecards | Lightweight shared tracking | Automated enterprise telemetry |
Who This Template Is For – and Who It’s Not For
Use it if you manage mobile channels, digital product performance, payments operations, app reliability, fraud monitoring, or customer support and need a repeatable monthly scorecard. It also suits analysts replacing disconnected slide tables with one controlled workbook.
Do not use it as a live fraud-detection system, transaction processor, regulatory reporting engine, or core-banking integration. It contains sample data and editable KPI definitions; it does not connect to production systems or certify compliance.
How to Use the Mobile Banking KPI Dashboard in Excel
- Review the KPI Definition sheet and adapt names, formulas, owners, and UTB/LTB types.
- Set the first reporting month in the Actual sheet.
- Replace sample actual, target, and prior-year values.
- Choose a month on KPI Dashboard to review MTD and YTD status.
- Select a KPI on KPI Trend, then use KPI Analysis for group and ranking discussions.
Real-World Use Cases
A digital channels head uses the seven cards to brief executives on adoption, reliability, payments, risk, and customer experience. A mobile product analyst selects one KPI before a monthly review to show its target and prior-year trend. A payments operations lead uses the group roll-up and bottom-five table to prioritise remediation.
Frequently Asked Questions
Does it connect to a banking system?
No. Enter or paste approved monthly figures into the three input sheets.
Does it use macros?
No. It uses worksheet formulas and works without VBA, Power Query, Power Pivot, or add-ins.
Can I change the KPIs?
Yes. Edit the master list; the input and reporting sheets follow it automatically within the prepared capacity.
How are lower-is-better KPIs scored?
The formula divides target by actual for LTB measures, so beating a cost, loss, or cycle-time target scores above 100%.
Can I change status thresholds?
Yes. The Read Me identifies the dashboard formula columns where the On Target, At Risk, and Missed thresholds are maintained.
Which Excel versions are supported?
The workbook’s own guide specifies Excel 2013 and later, including Excel for the web.
About the Author
Built by PK – Microsoft Certified Professional with 15+ years of Excel, Google Sheets, and Power BI experience. Founder of NextGenTemplates, reaching 300K+ subscribers across YouTube channels. Every template is hand-built and tested before release.
Explore Related Templates
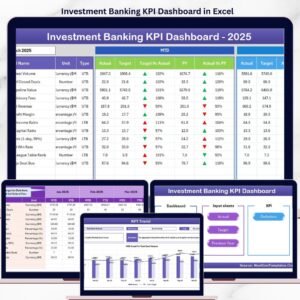
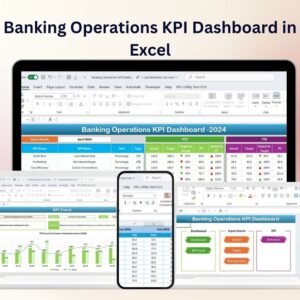
Compare the Investment Banking KPI Dashboard in Excel, Banking KPI Scorecard in Excel, Banking Operations KPI Dashboard in Excel, and Banking KPI Dashboard in Power BI. Browse all Excel KPI dashboards.
Download the Mobile Banking KPI Dashboard in Excel for a transparent, editable monthly scorecard without a subscription.
Last updated: August 2026






Reviews
There are no reviews yet.