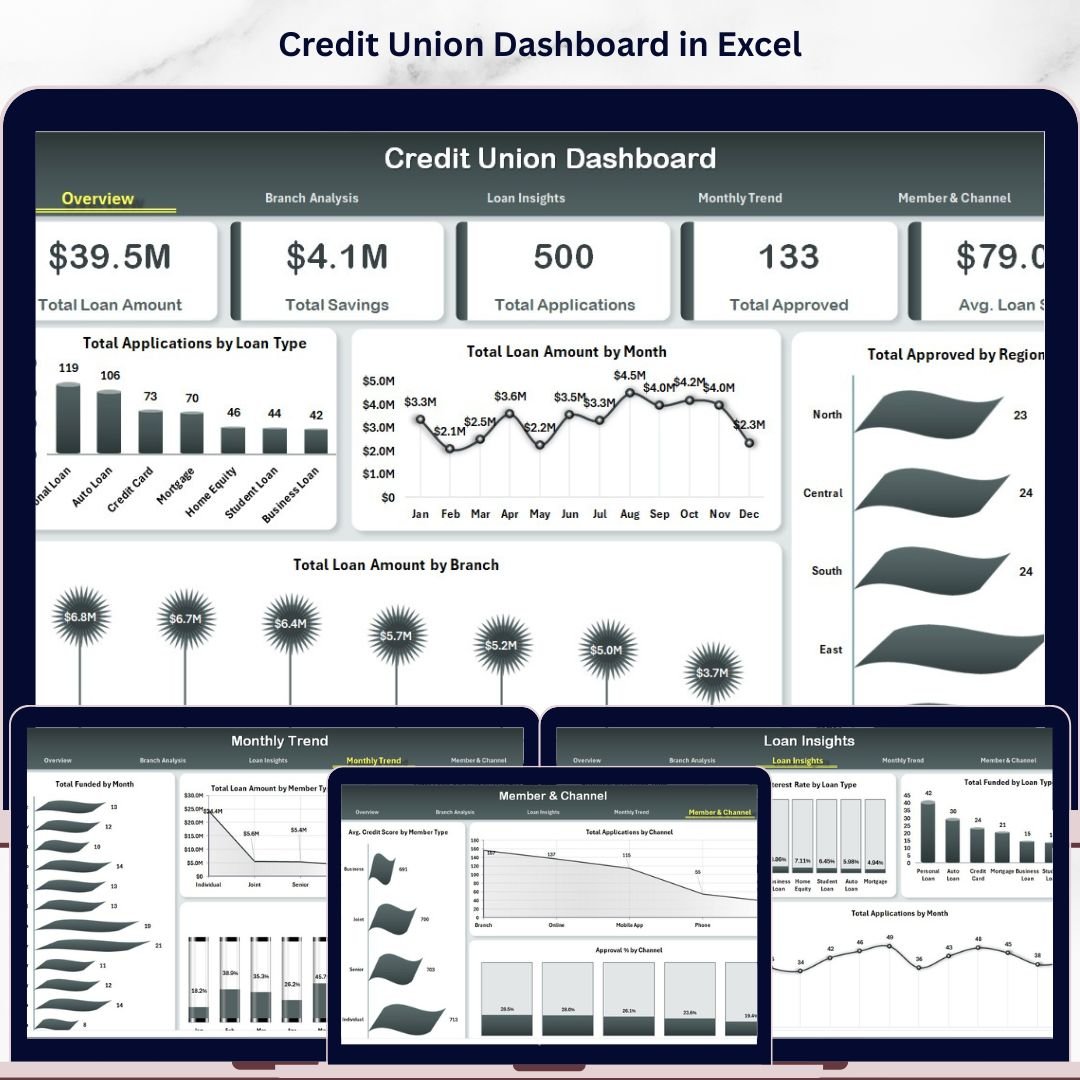


The Credit Union Dashboard in Excel tracks 5 portfolio KPIs across 5 interactive pages, with 19 pivot-driven charts and multiple slicers covering branch, loan type, region, channel, and member type. Setup takes under 10 minutes — replace the sample data in the Data sheet, click Refresh All, and every KPI, chart, and slicer updates automatically.
🌍 Join 8,400+ teams in 40+ countries using NextGenTemplates to replace paid SaaS tools with one-time-purchase Excel, Google Sheets, Power BI, and HTML templates.
✅ Instant download · One-time payment · No subscription · No per-user fees · Lifetime access
Credit Union Dashboard in Excel
🔑 Key Features of Credit Union Dashboard in Excel
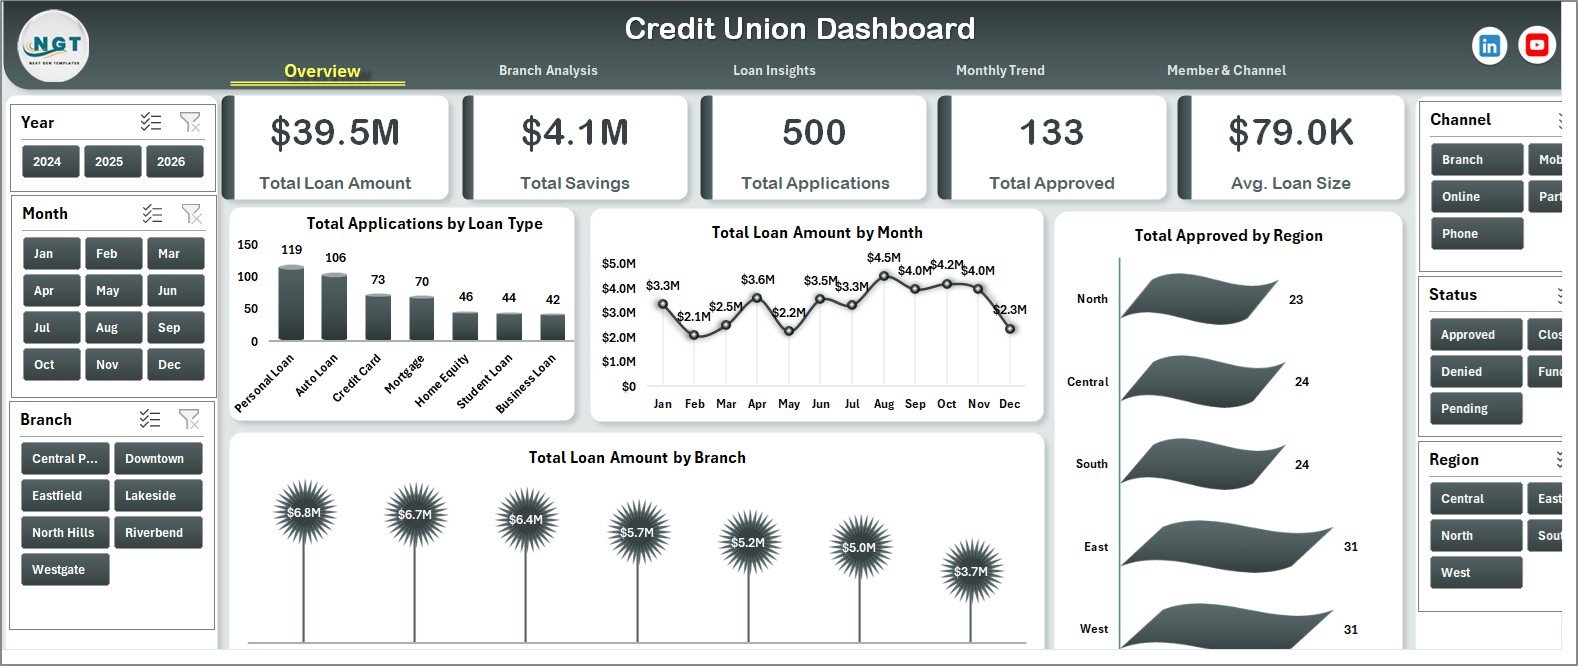
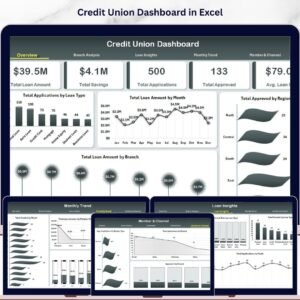
📌 5 KPI Summary Cards — Total Loan Amount, Total Savings, Total Applications, Total Approved, and Avg. Loan Size sit as summary tiles on the Overview page. Each card recalculates instantly when you adjust slicers or refresh the data.
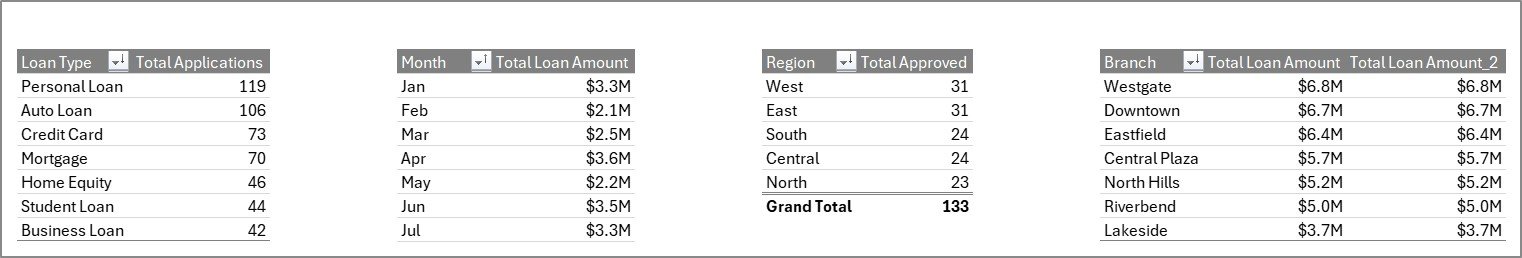
📌 19 Pivot-Driven Charts Across 5 Pages — Total Applications by Loan Type, Total Loan Amount by Month, Total Approved by Region, Approval % by Branch, Avg. Interest Rate by Loan Type, Funding % by Month, and 13 more, all powered by pivot tables on the hidden Support sheet.
📌 Slicer-Based Filtering on Every Page — Slicers for loan type, branch, region, month, member type, and channel sit on each analysis page. Click any button and the entire page filters in one tap — no formulas to rewrite.
📌 Branch & Loan Type Drill-Down — Compare branches on approved volume, savings, and approval percentage. Compare loan types on approval rate, average interest rate, and funded amount.
📌 Member & Channel Analytics — Average credit score by member type, total applications by channel (Branch, Online, Mobile App, Partner, Call Center), and approval % by channel — useful for re-allocating marketing spend toward the highest-converting channel.
📌 Hidden Support Sheet — All pivot tables live on a single Support sheet that can stay hidden. Refresh All from the Data ribbon updates every visual at once.
📦 What’s Inside the Credit Union Dashboard in Excel
📊 Overview Page — 5 KPI cards (Total Loan Amount, Total Savings, Total Applications, Total Approved, Avg. Loan Size) + 4 charts (Total Applications by Loan Type, Total Loan Amount by Month, Total Approved by Region, Total Loan Amount by Branch).
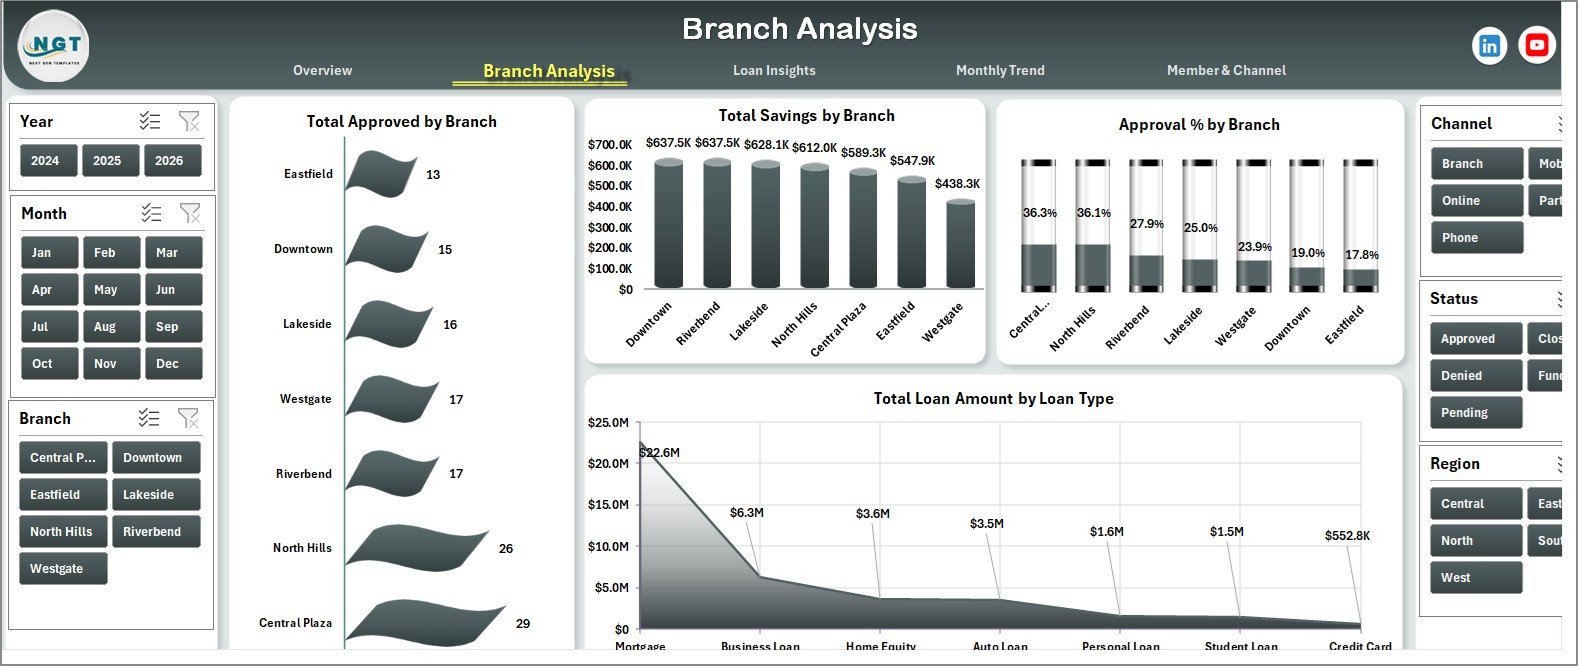
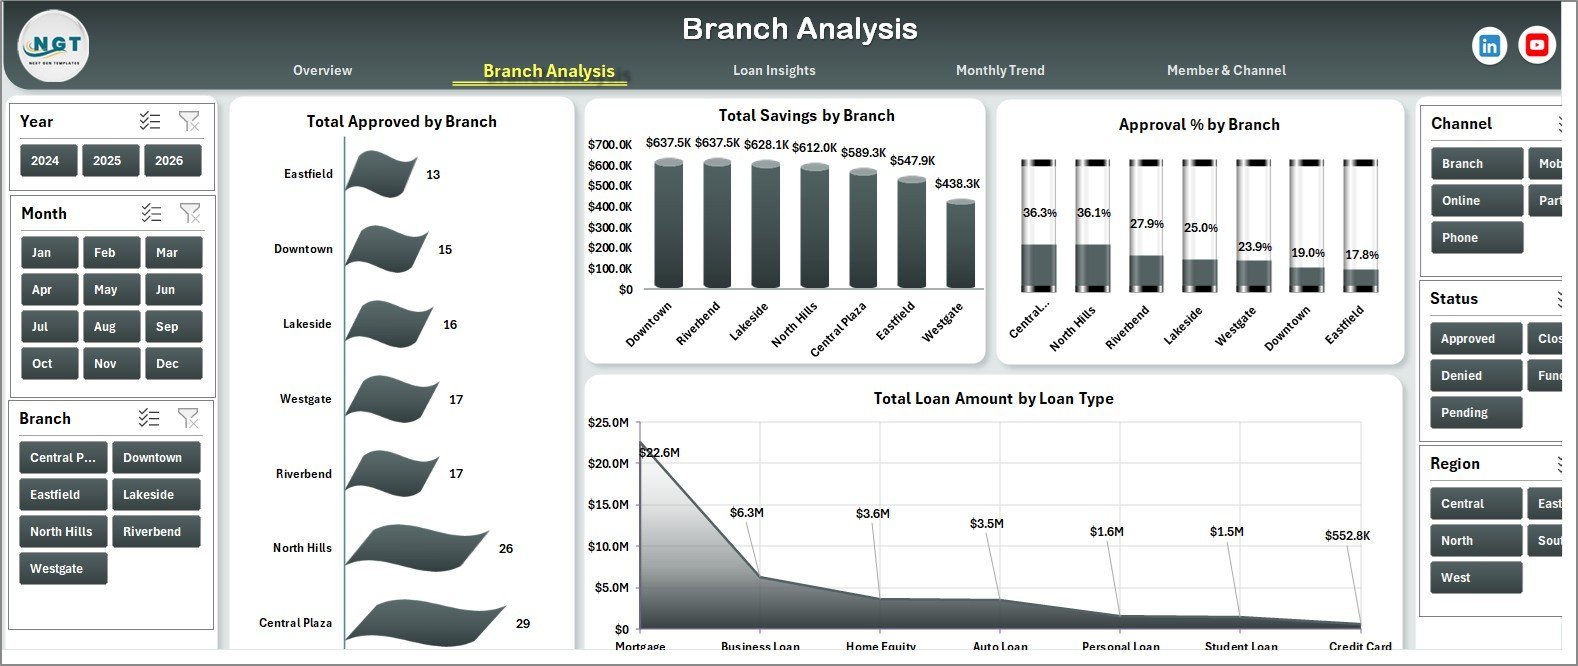
Branch Analysis Page
🏦 Branch Analysis Page — 4 charts: Total Approved by Branch, Total Savings by Branch, Approval % by Branch, Total Loan Amount by Loan Type.
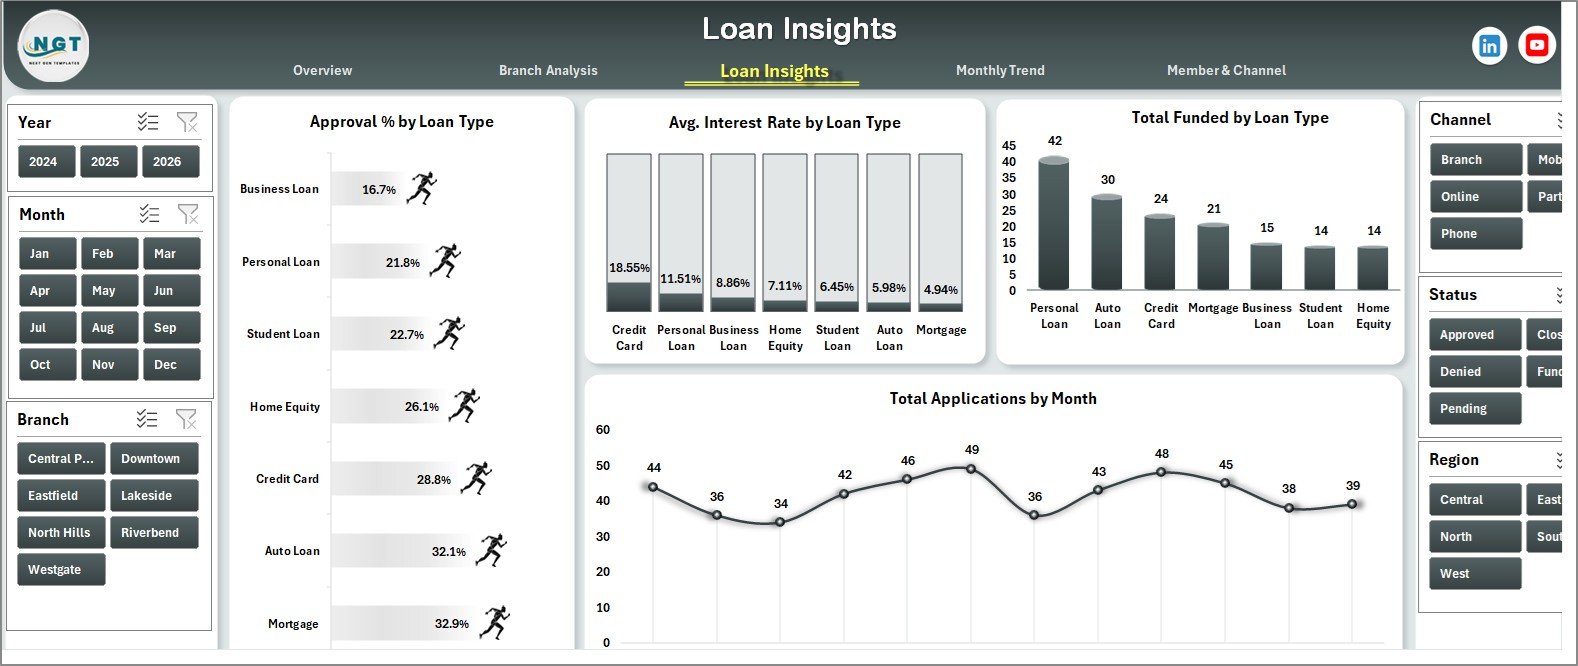
Loan Insights Page
💰 Loan Insights Page — 4 charts: Approval % by Loan Type, Avg. Interest Rate by Loan Type, Total Funded by Loan Type, Total Applications by Month.
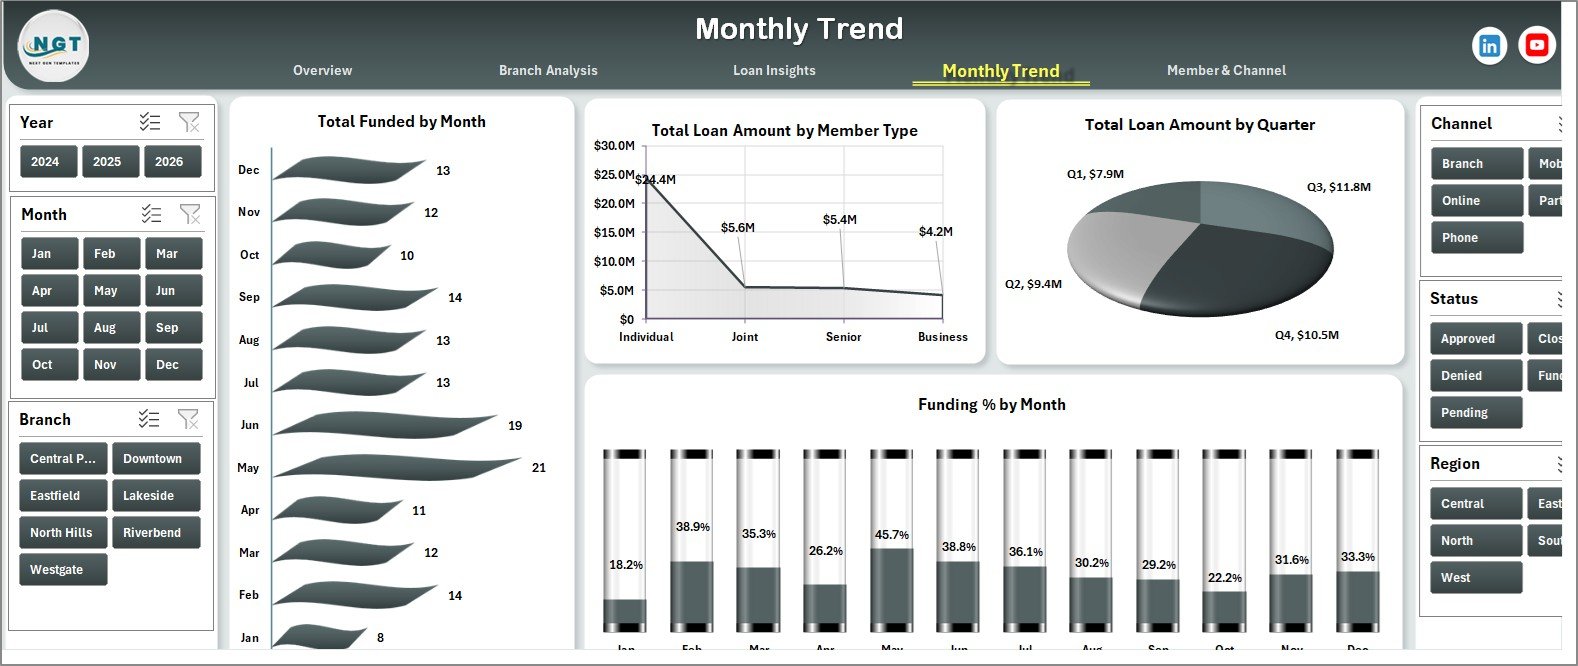
Monthly Trend Page
📈 Monthly Trend Page — 4 charts: Total Funded by Month, Total Loan Amount by Member Type, Total Loan Amount by Quarter, Funding % by Month.
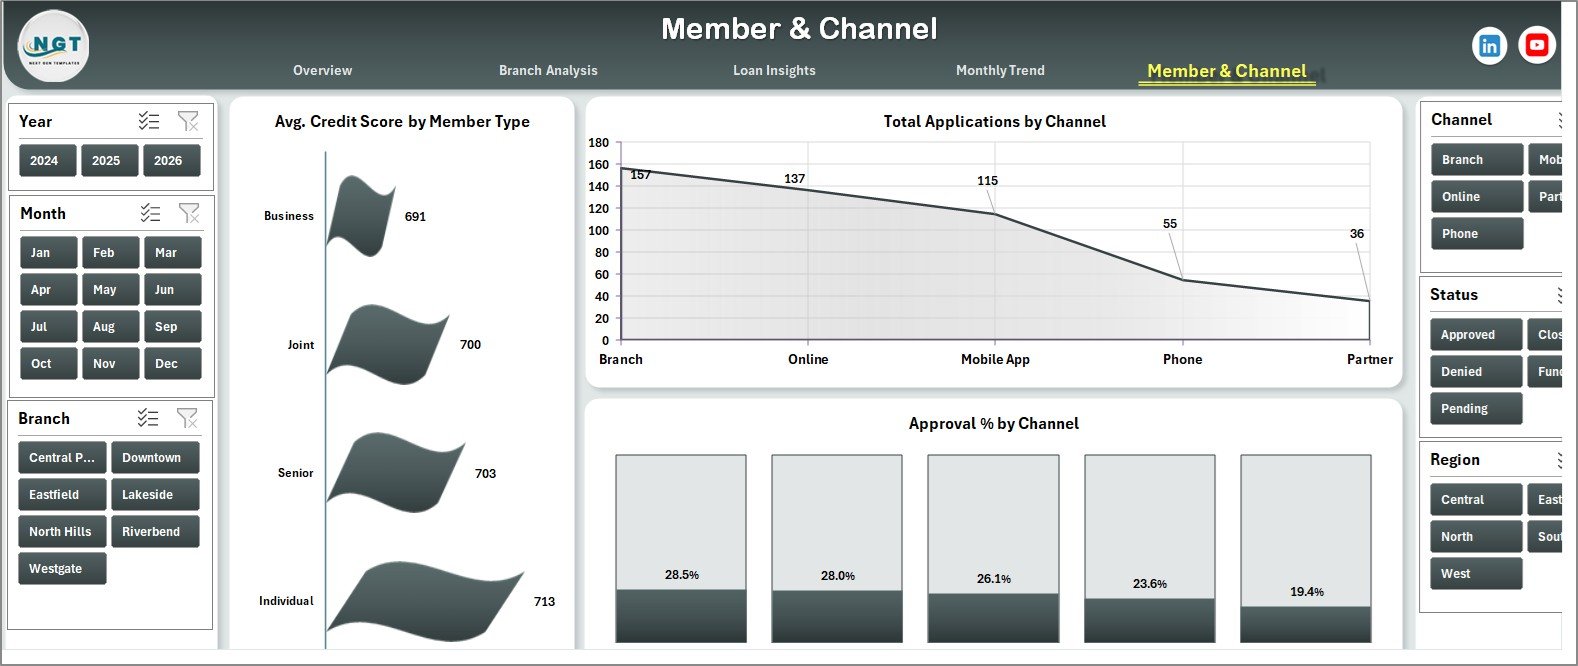
Member & Channel Page
👥 Member & Channel Page — 3 charts: Avg. Credit Score by Member Type, Total Applications by Channel, Approval % by Channel.
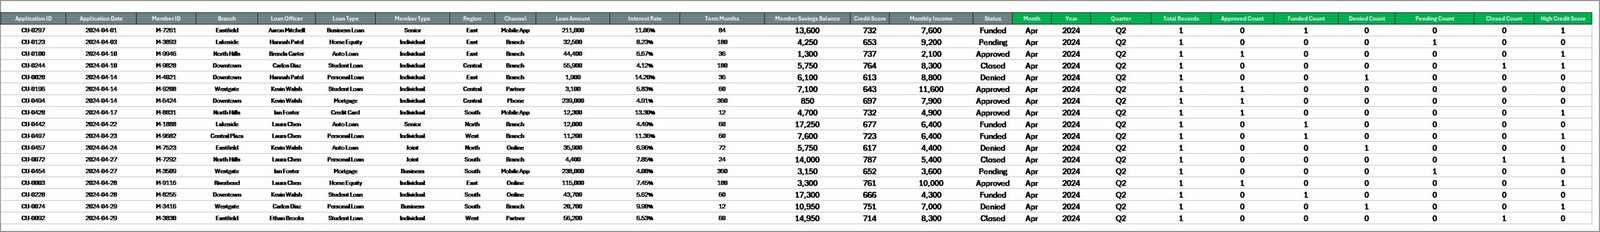
Data Sheet tab
📋 Data Sheet — Single tabular sheet where you paste or type your loan applications. Keep the column order and refresh.
Support sheet tab
⚙️ Support Sheet — Pre-built pivot tables that feed every chart. Stays hidden during normal use.
📊 Credit Union Dashboard in Excel vs. Google Sheets Equivalent vs. Paid Credit Union Software — Where This Fits
| Feature | Credit Union Dashboard in Excel | Google Sheets Loan Tracker | CUNA / Symitar / Jack Henry |
|---|---|---|---|
| Cost | $17.99 one-time | $0–$25 one-time | $200–$2,000 / user / month |
| Platform | Excel 2016, 2019, 2021, 365 | Google Sheets (browser) | Proprietary core banking |
| Setup time | Under 10 minutes | 15–30 minutes | 3–9 months implementation |
| Slicer-based filtering | ✅ 5+ slicers across pages | ❌ Manual filter views only | ✅ Built-in reporting |
| Custom KPIs & charts | ✅ Edit any pivot | ✅ Editable | ❌ Locked vendor templates |
| Offline access | ✅ Yes, file-based | ❌ Requires internet | ❌ Server-based |
| Member & channel analytics | ✅ Included | ⚠️ Build it yourself | ✅ Built-in |
| Year-1 cost at 5 users | $17.99 total | $0–$125 | $12,000–$120,000+ |
For small and mid-sized credit unions that want branch, loan, member, and channel reporting without paying core-banking software pricing, the Credit Union Dashboard in Excel sits in the sweet spot.
👥 Who This Template Is For — and Who It’s Not For
✅ This template is built for:
- Credit union managers and CFOs at single-branch and multi-branch institutions tracking loan and savings performance
- Loan officers and branch managers who report weekly or monthly numbers to leadership
- Internal audit and compliance teams that need quick branch and loan-type breakdowns without pulling core-system reports
- Community bank and microfinance analysts who already work in Excel and want a ready-made pivot-driven dashboard
❌ This template is NOT for:
- Large credit unions needing real-time integration with their core banking system (Symitar, Jack Henry, Fiserv)
- Teams that want a no-Excel, browser-only experience — try our Google Sheets Dashboards instead
- Regulators requiring NCUA Call Report formats — this is a management dashboard, not a regulatory filing tool
⚙️ How to Use the Credit Union Dashboard in Excel
- Download and unzip the file — open Credit-Union-Dashboard.xlsx in Excel 2016 or later.
- Open the Data sheet — review the column structure (date, member ID, member type, branch, region, loan type, application amount, approved amount, interest rate, channel, status, etc.).
- Replace the sample rows with your own data — paste from your core-system export. Keep the column headers exactly as they are.
- Go to the Data tab in the Excel ribbon and click Refresh All — all pivots on the Support sheet rebuild instantly.
- Open each analysis page and use the slicers — filter by branch, loan type, region, or member type to drill into any segment.
- Optional: hide the Support sheet — right-click the tab and select Hide so end users only see Overview, Branch Analysis, Loan Insights, Monthly Trend, Member & Channel, and Data.
💼 Real-World Use Cases
Maria runs operations at a 4-branch community credit union with $180M in assets. She drops the previous month’s loan applications into the Data sheet, clicks Refresh All, and shares the file with branch managers. The Branch Analysis page tells her instantly which branch is approving fastest and has the highest average loan size — no waiting for IT to pull a core report.
James is a loan officer at a single-branch credit union serving teachers. He uses the Loan Insights page to track Approval % by Loan Type. When his auto-loan approval rate dropped from 78% to 64% last quarter, the dashboard flagged it before his quarterly review.
Priya is a finance analyst at a microfinance institution. She uses the Member & Channel page to compare Total Applications by Channel. After seeing that the Mobile App channel had a 22% higher approval rate than the Branch channel, she made a data-backed case to increase the mobile marketing budget — skipping $1,800/month for a SaaS reporting tool.
❓ Frequently Asked Questions
What KPIs does the Credit Union Dashboard in Excel track?
The Credit Union Dashboard in Excel tracks five summary KPIs (Total Loan Amount, Total Savings, Total Applications, Total Approved, Avg. Loan Size) plus 19 breakdown charts across branch, loan type, region, channel, member type, and monthly trend. Every metric refreshes automatically from the Data sheet.
How long does setup take for the Credit Union Dashboard in Excel?
Setup takes under 10 minutes. Download the file, open it in Excel 2016 or later, paste your loan and member data into the Data sheet keeping the column order intact, then click Refresh All under the Data ribbon. Every chart, KPI, and slicer updates automatically.
Does the Credit Union Dashboard in Excel require Power BI or any add-in?
No. The Credit Union Dashboard in Excel runs entirely on native Excel features — pivot tables, slicers, and standard charts. No Power BI, no Power Query, no VBA macros. It works in Excel 2016, 2019, 2021, and Microsoft 365 on Windows and Mac.
How is the Credit Union Dashboard in Excel different from paid credit union software?
Paid platforms like Symitar or Jack Henry cost $200–$2,000 per user per month and require multi-month implementations. The Credit Union Dashboard in Excel is a $17.99 one-time purchase for management reporting only — it does not replace your core banking system, but it covers branch, loan, and member analytics quickly.
Can I add my own KPIs or charts to the Credit Union Dashboard in Excel?
Yes. Every chart is driven by a pivot table on the Support sheet. Right-click any chart, edit the source pivot, or add a new pivot from the Data sheet. The slicers can be connected to your new pivots through Report Connections in the Slicer ribbon.
Will the Credit Union Dashboard in Excel handle 50,000+ loan records?
Yes, comfortably. The Credit Union Dashboard in Excel uses native pivot tables, which Excel handles well up to about 1 million rows. For credit unions with under 50,000 active loans, performance stays smooth on a standard laptop — refresh times typically stay under 5 seconds.
What file format do I receive after purchase?
You receive a ZIP file containing a single .xlsx file. Unzip it, open in Excel, and start using. The file is virus-scanned, contains no macros, and works offline. You can also browse our full library of Excel Dashboard Templates for related credit union and banking dashboards.
👤 About the Author
Built by PK — Microsoft Certified Professional with 15+ years of Excel, Google Sheets, and Power BI experience. Founder of NextGenTemplates, reaching 300K+ subscribers across YouTube channels (@PK-AnExcelExpert, @NextGenTemplates, @NeoTechNavigators). Every template is hand-built and tested before release.
🔗 Explore Related Templates
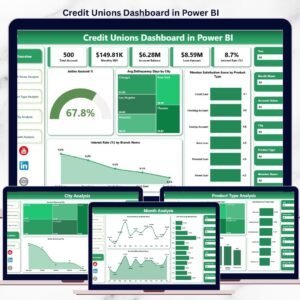
💎 Also available as: Credit Unions Dashboard in Power BI — same analytics, Power BI version with DAX measures.
📊 Peer-to-Peer Lending KPI Dashboard in Excel — complementary lending KPI view for P2P portfolios.
🏦 Banking Report in Excel — branch-level banking reporting in Excel.
💳 Credit Card KPI Dashboard in Google Sheets — credit card portfolio analytics in Google Sheets.
📂 Browse all Excel Dashboard Templates on NextGenTemplates.
📖 Click here to read the Detailed Blog Post
🎥 Visit our YouTube channel for step-by-step video tutorials
👉 YouTube.com/@NextGenTemplates
Watch the step-by-step video tutorial:


Reviews
There are no reviews yet.