





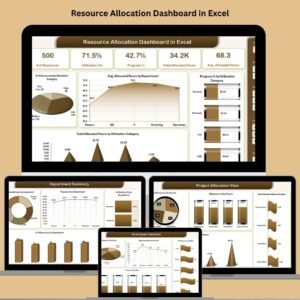
Tired of juggling spreadsheets to manage teams and projects? Say hello to the Resource Allocation Dashboard in Excel — your all-in-one, ready-to-use solution to track, plan, and optimize resource distribution across departments, projects, and roles. Designed for project managers, HR teams, analysts, and small business owners, this dashboard makes resource planning visual, data-driven, and easy!
⚙️ Key Features of the Resource Allocation Dashboard in Excel
🧭 Page Navigator
Jump across five powerful dashboard views with just one click—no more endless scrolling or tab hunting!
📈 Overview Dashboard
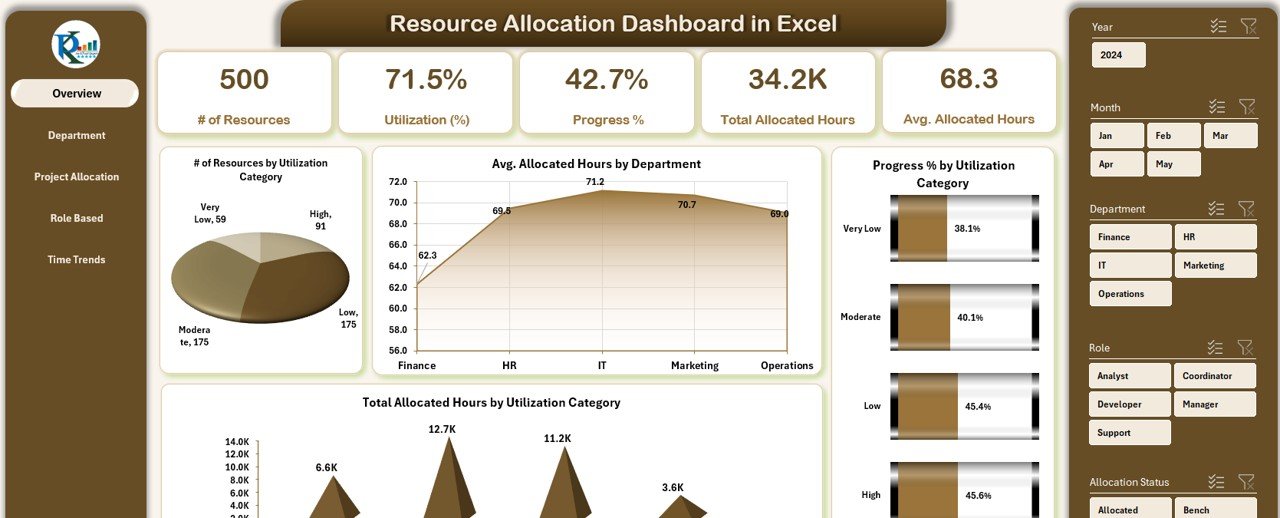
Get a helicopter view of all your resource metrics:
👥 # of Resources by Utilization Category
🕒 Average Allocation Hours by Department
📊 Progress % by Utilization Category
📅 Total Allocated Hours by Category
🏢 Departmental Summary
See how each department is utilizing its resources:
🔄 Utilization %
🔧 Progress %
⏱ Total Hours Allocated
👨💼 Number of Team Members
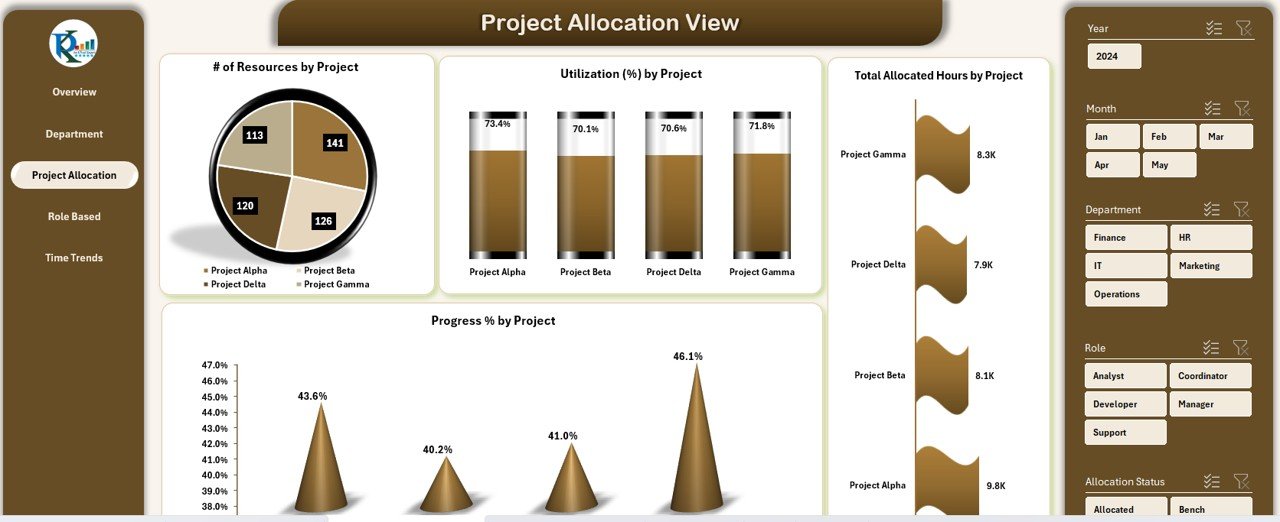
📂 Project Allocation View
Track how resources are assigned across projects:
🔄 Project-wise Utilization
⏱ Hours Allocated
📉 Performance Progress
💼 Role-Based Utilization
Spot which roles (Developer, Designer, etc.) are under or overutilized:
🧠 Utilization % by Role
⏱ Hours Allocated
👥 Resources Assigned
📈 Progress %
📆 Time Trend Analysis
See trends over time to plan ahead:
📅 Monthly Allocation
🔄 Utilization %
⏳ Progress by Month
📁 What’s Inside the Resource Allocation Dashboard
📝 Data Sheet
Everything runs from this single, organized input sheet:
Resource ID
Employee Name
Department
Project
Role
Start & End Dates
Allocated Hours
Utilization %
Status & Progress
Month & Year
🧩 Support Sheet
Handles dropdowns and backend logic so your dashboard runs smoothly without breaking formulas.
All charts, slicers, and cards update instantly when data changes. No coding or complex Excel skills needed.
✅ How to Use the Resource Allocation Dashboard
📥 Step 1: Download & Open
Open the Excel file in the desktop version for best performance.
📝 Step 2: Fill the Data Sheet
Enter your resource information — roles, projects, hours, dates, and utilization rates.
🧭 Step 3: Use the Page Navigator
Switch between dashboard views with a single click.
📊 Step 4: Analyze & Adjust
Use filters and slicers to examine workload balance across teams and time periods.
📤 Step 5: Share Insights
Export reports or share the Excel file with managers or clients.
🎯 Who Can Benefit from This Resource Dashboard?
👨💼 Project Managers – Balance workloads across projects
👥 HR Teams – Optimize team assignments and reduce underutilization
🏢 Department Heads – Gain visibility into staffing gaps or overloads
📉 Business Analysts – Analyze trends in resource usage
💻 Small Business Owners – Manage people without fancy software
💡 Why Choose This Excel Dashboard?
✅ No subscriptions or extra software needed
✅ Centralized resource tracking in one sheet
✅ Easy-to-read visuals for quick decision-making
✅ Real-time updates and instant chart refresh
✅ Flexible and fully customizable for any team size
🔗 Click here to read the Detailed blog post
🎥 Visit our YouTube channel to learn step-by-step video tutorials
Watch the step-by-step video tutorial:
Compatibility and Requirements
- Works in Microsoft Excel desktop (Excel 2016 or later, or Microsoft 365).
- Charts, cards and slicers update when the data changes. Microsoft explains slicers in Use slicers to filter data.
Frequently Asked Questions
Which views does the dashboard include?
Five views reached from the Page Navigator: Overview, Departmental Summary, Project Allocation, Role-Based Utilization and Time Trend Analysis.
What data do I enter?
Resource ID, employee name, department, project, role, start and end dates, allocated hours, utilization %, status and progress, and month and year.
What does the Support sheet do?
It holds the dropdown lists and backend logic so the dashboard runs without breaking formulas.
Can I spot over or underused roles?
Yes. The Role-Based Utilization view shows utilization %, hours, resources assigned and progress for each role.
Can I filter by team or period?
Yes. Use the filters and slicers to check workload balance across teams and time periods.
Related Resource and Project Templates
- Resource Allocation Dashboard in Power BI: the same topic in Power BI
- Resource Allocation Dashboard in Google Sheets: a shared online version
- Resource Allocation KPI Dashboard in Excel: tracks allocation KPIs month by month
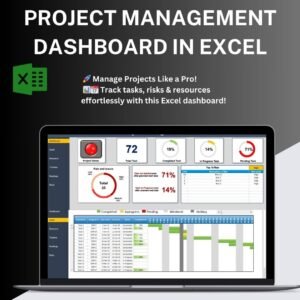
- Project Management Dashboard in Excel: tracks projects, tasks and status
- Project Manager Power Pack: 10 project templates in one download
Browse all Excel dashboards or the Excel project management templates.









Reviews
There are no reviews yet.