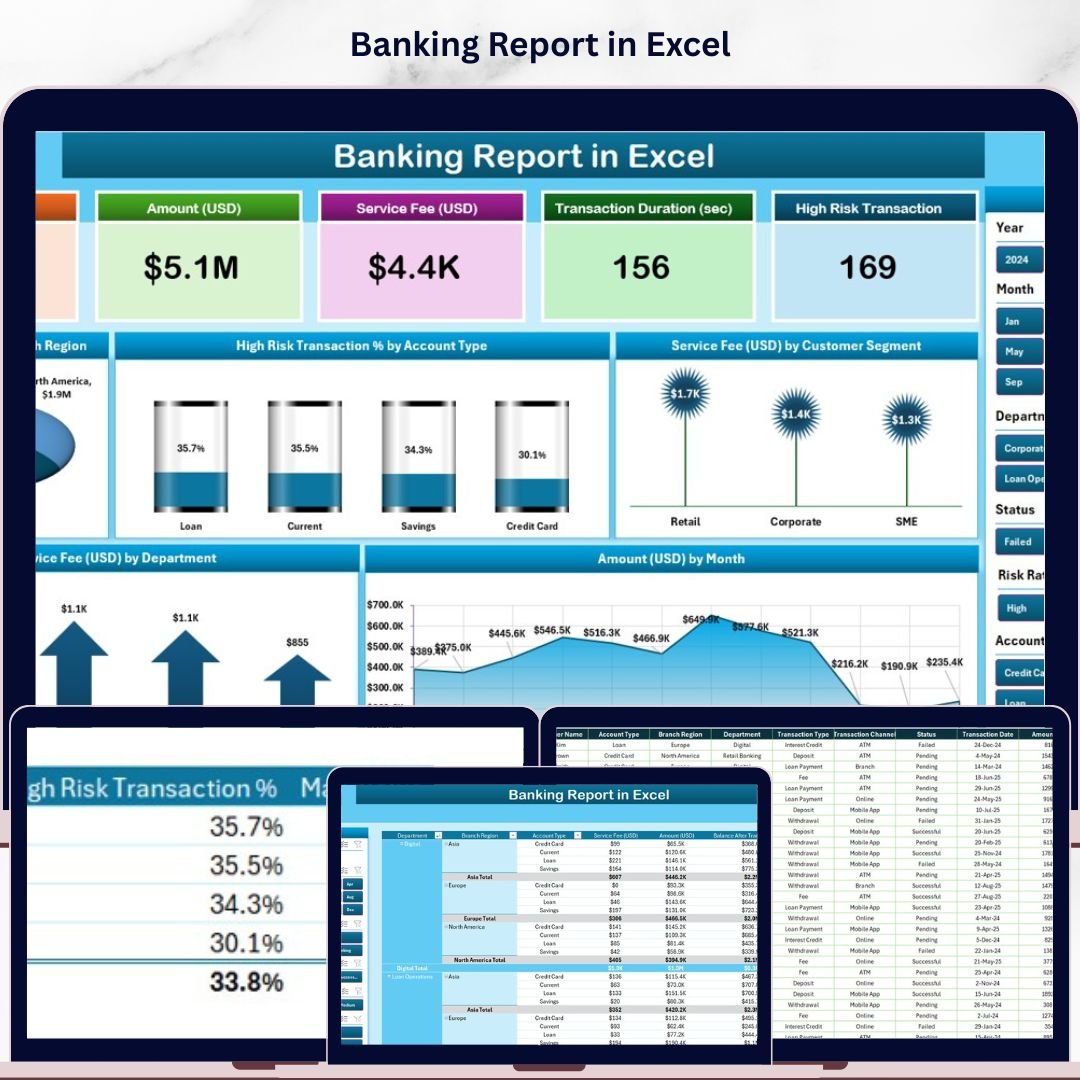
The Banking Report in Excel tracks 12+ banking KPIs across 2 interactive report pages, with 5 pre-built charts, dynamic slicers, and automated summaries — covering branch performance, risk analysis, service fees, and monthly trends. Setup takes under 10 minutes — just paste your transaction data into the Data Sheet and every chart updates instantly.
🌍 Join 8,400+ teams in 40+ countries using NextGenTemplates to replace costly banking analytics tools with one-time-purchase Excel templates.
✅ Instant download · One-time payment · No subscription · No per-user fees · Lifetime access
🔑 Key Features of Banking Report in Excel
🔹 5-KPI Summary Card Row — The Summary Page opens with 5 top-level KPI cards showing Total Amount, Total Transactions, Average Service Fee, High Risk Transaction %, and Net Branch Revenue at a glance.
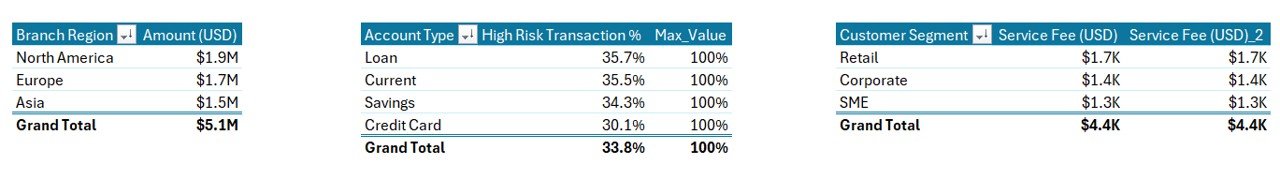
🔹 5 Interactive Charts — Amount by Branch Region (geographic split), High Risk Transaction % by Account Type, Service Fee by Customer Segment, Service Fee by Department, and Amount by Month. All charts update automatically from the Data Sheet.
🔹 Slicer-Driven Filtering — A right-side slicer on the Summary Page and a left-side slicer on the Report Page let you slice data by Branch, Account Type, Date, or Customer Segment in one click — no pivot table knowledge needed.
🔹 Detailed Report Page — The Report Page presents a full information table alongside its slicer, enabling line-by-line transaction review filtered to any dimension.
🔹 Clean Data Architecture — The structured Data Sheet accepts raw banking transaction exports. The companion Support Sheet documents field definitions and setup instructions so any team member can take over maintenance.
This Banking Report in Excel tracks Amount by Branch Region, High Risk Transaction % by Account Type, Service Fee by Customer Segment and Department, and monthly Amount trends — all 5 metrics updating live from a single data source.
📦 What’s Inside the Banking Report in Excel
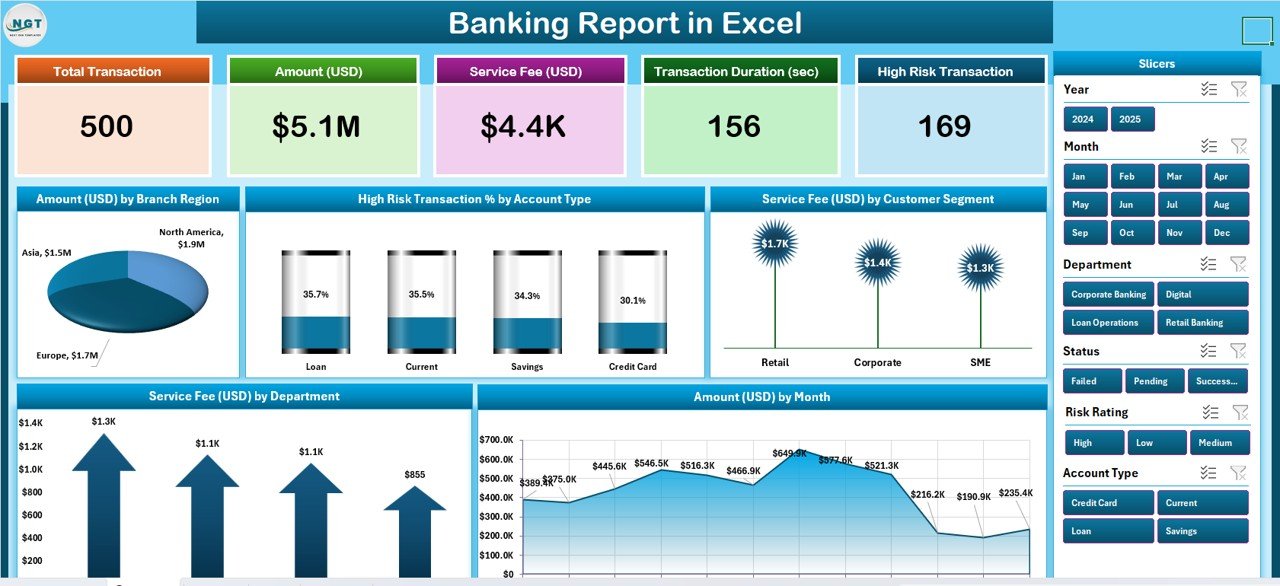
Summary Page — 5 KPI Cards + 5 Charts + Slicer
🔹 Summary Page — Top-row KPI cards (Total Amount, Transactions, Avg Service Fee, High Risk %, Net Revenue) plus 5 charts and a right-side interactive slicer.
🔹 Report Page — Left-side slicer with a detailed transaction information table for deep-dive filtering.
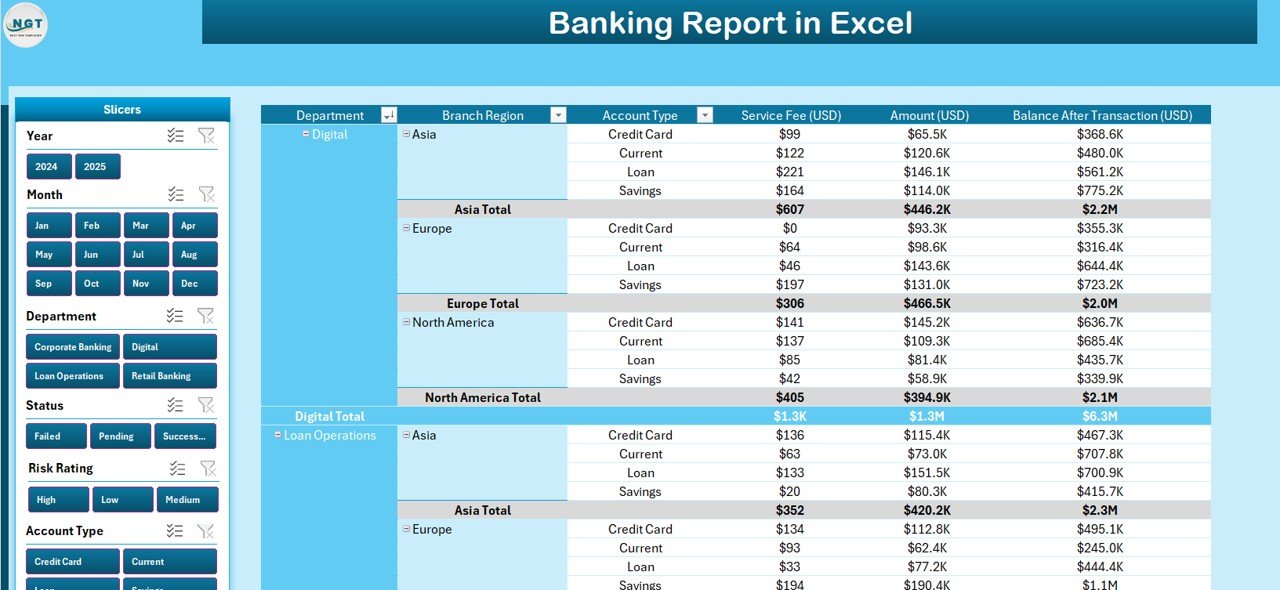
Report Page — Left Slicer + Information Table
🔹 Data Sheet — Structured input table for raw banking transactions: Branch, Account Type, Customer Segment, Department, Date, Amount, and Service Fee columns.
🔹 Support Sheet — Field definitions, column mapping guide, and setup notes for easy team onboarding.
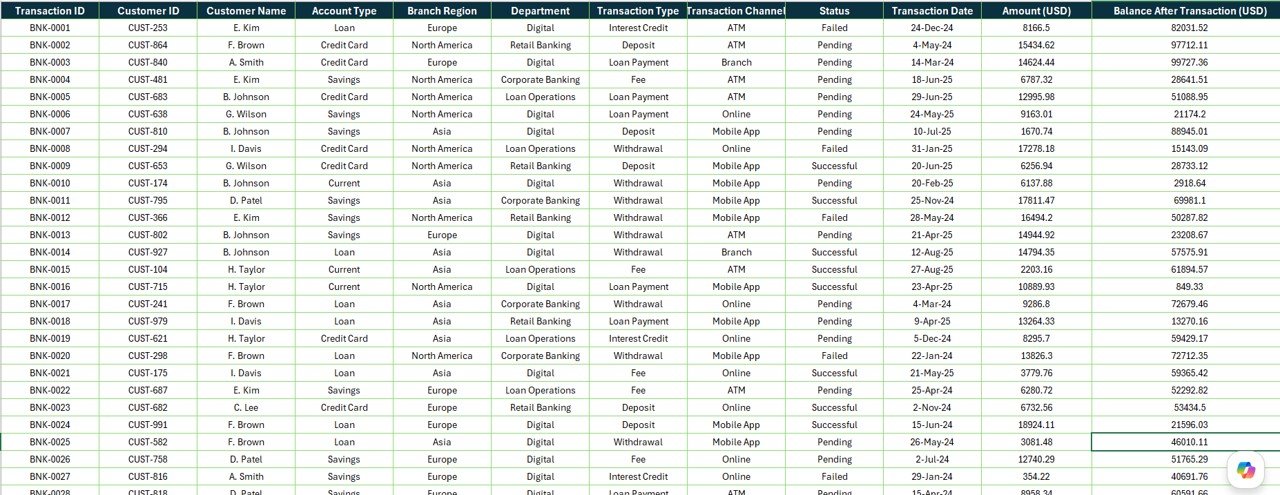
Data Sheet — Structured Input for Transaction Data
Support Sheet — Column Guide and Setup Notes
📊 Banking Report in Excel vs. Google Sheets Banking Template vs. Paid Analytics — Where This Fits
| Feature | Banking Report in Excel | Google Sheets Template | Tableau / Power BI Pro |
|---|---|---|---|
| Cost | $7.99 one-time ✅ | Free (limited charts) | $70–$100/user/month |
| Platform | Microsoft Excel ✅ | Google Sheets (online) | Cloud SaaS |
| Setup time | Under 10 minutes ✅ | 5–15 min | Days (IT + data connectors) |
| Works offline | Yes — full desktop ✅ | Requires internet | Requires internet |
| Interactive slicers | Yes — native Excel ✅ | Limited (dropdowns) | Yes (at full cost) |
| High Risk Transaction analysis | Built-in chart ✅ | Not included | Custom build required |
| Branch region breakdown | Pre-built ✅ | Not included | Custom build required |
| Year-1 cost (5 users) | $7.99 total ✅ | $0 (fewer features) | $4,200–$6,000 |
For banking teams that want branch-level performance visibility without enterprise-tool budgets, the Banking Report in Excel sits in the sweet spot.
👥 Who This Template Is For — and Who It’s Not For
✅ This template is built for:
- Bank branch managers tracking monthly transaction volume and service fee performance
- Finance analysts building monthly banking performance reports for management
- Risk officers monitoring High Risk Transaction percentages by account type
- Operations teams comparing service fee revenue across customer segments and departments
- Excel-proficient professionals who want a structured, ready-to-use banking reporting framework
❌ This template is NOT for:
- Enterprise banks needing real-time core-banking system integration (requires BI middleware)
- Teams requiring multi-user simultaneous live editing (use SharePoint + Power BI instead)
- Users with no Excel experience — basic data entry skills are needed
⚙️ How to Use the Banking Report in Excel
- Download and open the Banking Report in Excel file in Microsoft Excel 2016 or later.
- Go to the Data Sheet and replace the sample rows with your actual banking transaction records — Branch, Account Type, Customer Segment, Department, Date, Amount, Service Fee.
- Return to the Summary Page — all 5 KPI cards and 5 charts update automatically from your data.
- Use the slicers on the Summary and Report pages to filter views by Branch Region, Account Type, or Date range.
- Review the Report Page for a filtered transaction-level information table.
- Export or share the file as PDF or Excel for stakeholder reporting.
💼 Real-World Use Cases
Rajesh manages operations for a mid-sized regional bank with 12 branches. Each month he exports transaction data from the core banking system into the Banking Report in Excel, refreshes the Data Sheet, and presents the Summary Page charts to regional directors — showing which branches drove the highest transaction volume and where High Risk Transaction rates spiked.
Priya is a finance analyst at a fintech lending company. She uses the Report Page’s slicer to filter transactions by Customer Segment (Retail vs. Corporate) and compares service fee revenue across departments — the analysis that used to take 3 hours in manual pivot tables now takes 15 minutes.
Ahmed runs monthly compliance reporting for a private bank’s risk team. The High Risk Transaction % by Account Type chart gives him an instant visual of where risk is concentrated, without rebuilding the analysis from scratch every reporting cycle.
❓ Frequently Asked Questions
What KPIs does the Banking Report in Excel track?
The Banking Report in Excel tracks 12+ banking metrics including Total Amount, Total Transactions, Average Service Fee, High Risk Transaction %, and Net Branch Revenue — plus breakdowns by Branch Region, Account Type, Customer Segment, Department, and Month. All metrics update automatically from the Data Sheet.
Does this template work in Excel on Mac?
Yes. The Banking Report in Excel is compatible with Microsoft Excel on both Windows and Mac (Excel 2016+). Slicers are fully functional on both platforms. It is not designed for Excel Online or LibreOffice.
How long does setup take?
Under 10 minutes. Open the file, go to the Data Sheet, delete the sample rows, and paste your own transaction data. The Summary Page charts and KPI cards refresh automatically. No formulas need to be rebuilt.
Can I add more rows of data?
Yes. The Data Sheet accommodates additional rows. The pivot-based charts on the Summary Page automatically expand to include new records added within the defined data table range.
How does this compare to paid banking analytics tools like Tableau?
Tableau and Power BI Pro cost $70–$100 per user per month and require IT-managed data connector setup. The Banking Report in Excel delivers equivalent branch-level and risk analytics for a one-time $7.99 payment — no subscription, no IT involvement, no per-user licensing.
Is the template customizable?
Yes. Column headers, chart labels, slicer dimensions, and KPI card formulas can all be modified in Excel. The Support Sheet documents which cells drive which calculations to make customization straightforward.
What version of Excel is required?
Microsoft Excel 2016 or later is recommended for full slicer and chart functionality. Excel 2013 may work but slicers could behave differently. Google Sheets and LibreOffice are not supported.
👤 About the Author
Built by PK — Microsoft Certified Professional with 15+ years of Excel, Google Sheets, and Power BI experience. Founder of NextGenTemplates, reaching 300K+ subscribers across YouTube channels (@PK-AnExcelExpert, @NextGenTemplates, @NeoTechNavigators). Every template is hand-built and tested before release.
🔗 Explore Related Templates
Looking for more Finance & Accounting Templates? Explore our full collection of Excel-based financial reporting tools. Also browse our Excel Dashboard Templates for interactive analytics across Sales, HR, Finance, and Operations.
📖 Click here to read the Detailed Blog Post
🎥 Visit our YouTube channel for step-by-step video tutorials
👉 YouTube.com/@NextGenTemplates
📅 Last updated: May 2026
Watch the step-by-step video tutorial: