



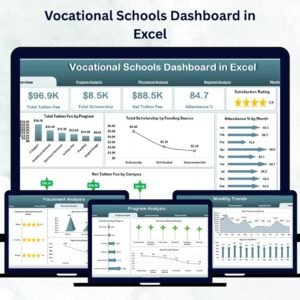
Running a vocational school requires balancing education quality, finances, and student success. Tracking tuition revenue, scholarships, satisfaction, and placements can be overwhelming — especially when managed manually. The Vocational Schools Dashboard in Excel 💡📈 simplifies it all by consolidating institutional data into one powerful, visual, and interactive platform.
This ready-to-use Excel dashboard provides school administrators, educators, and finance teams with real-time insights into academic, financial, and operational performance. From enrollment to placement outcomes, this template turns your data into actionable insights that drive better decisions and long-term success.
⚡ Key Features of Vocational Schools Dashboard in Excel
✅ Centralized Performance Tracking: Monitor tuition, scholarships, attendance, satisfaction, and placement in one visual dashboard.
✅ Interactive Page Navigator: Easily move between analytical pages for Finance, Program Analysis, Placement, Region, and Monthly Trends.
✅ Dynamic KPI Cards: View total tuition fees, total scholarships, net tuition, and attendance % instantly.
✅ Automated Charts & Visuals: Interactive visuals auto-update with every new data entry.
✅ MTD, YTD, and Trend Analysis: Analyze data month-by-month to identify progress or performance gaps.
✅ No Coding Required: Entirely formula-based — no macros or add-ins needed.
✅ 100% Customizable: Add new KPIs, programs, or campuses to match your institution’s structure.
✅ Multi-Campus Compatible: Includes regional analysis for comparing performance across locations.
✅ Perfect for All Users: Ideal for administrators, finance teams, and academic planners.
This Excel dashboard bridges the gap between data and decisions — giving every stakeholder a clear picture of what’s working and where to improve.
🧩 What’s Inside the Vocational Schools Dashboard in Excel
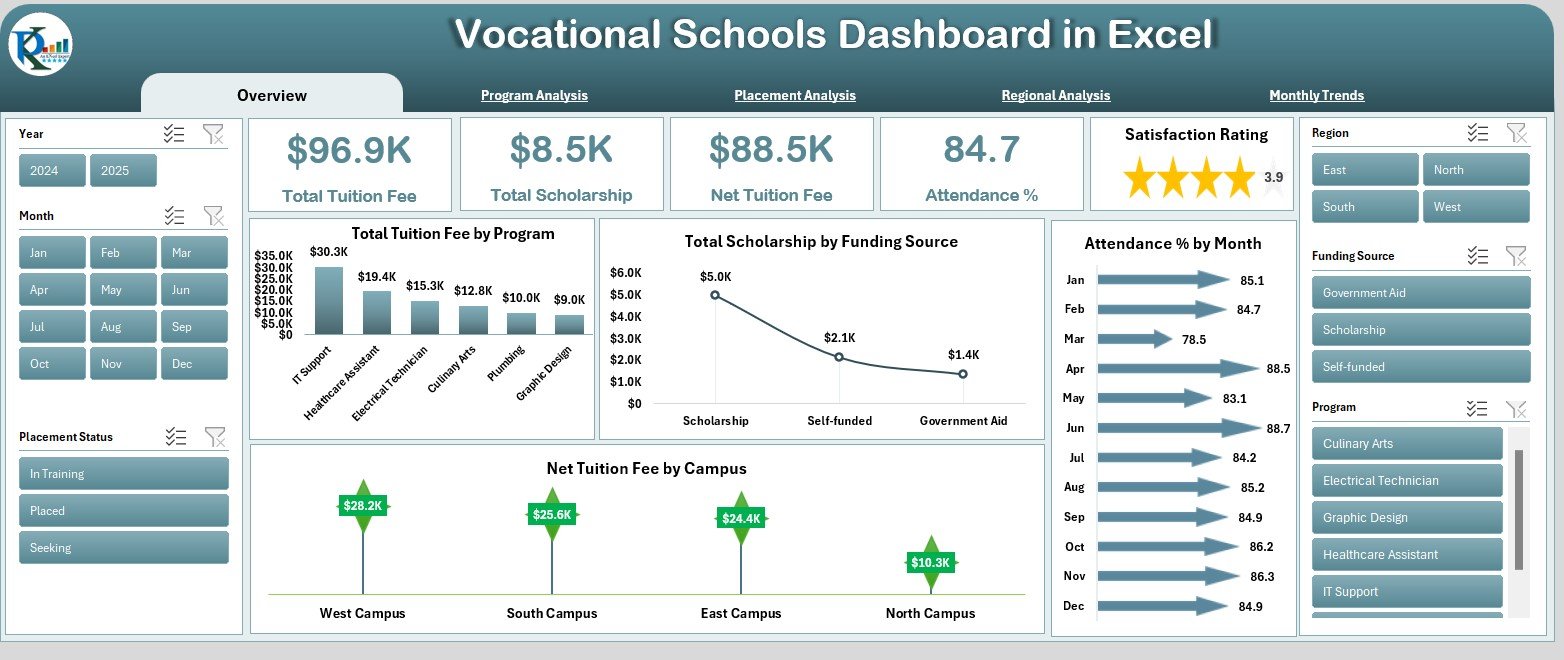
This powerful educational analytics template includes five core pages plus supporting data sheets for input and references:
1️⃣ Overview Page — The Main Dashboard:
Your central command center.
Displays cards for key KPIs — Total Tuition Fee, Total Scholarships, Net Tuition Fee, and Attendance %.
Charts include:
Total Tuition Fee by Program
Total Scholarship by Funding Source
Net Tuition Fee by Campus
Attendance % by Month
2️⃣ Program Analysis Page — Academic Performance Insights:
Compare academic and financial performance across programs.
Visuals include:
Total Scholarship by Program
Satisfaction Rating by Program
Average Score by Program
3️⃣ Placement Analysis Page — Employment Outcomes:
Track how well students transition into careers.
Charts include:
Satisfaction Rating by Placement Status
Attendance % by Placement Status
Scholarship Distribution by Placement
4️⃣ Regional Analysis Page — Campus Comparison:
Evaluate financial and academic results across campuses or regions.
Charts include:
Total Tuition Fee by Region
Average Score by Region
Satisfaction Rating by Region
5️⃣ Monthly Trends Page — Performance Over Time:
See how institutional performance evolves each month.
Charts include:
Satisfaction Rating by Month
Total Tuition Fee by Month
Average Score by Month
Each sheet provides actionable insights — helping you identify opportunities, measure progress, and plan strategically.
🧠 How to Use the Vocational Schools Dashboard in Excel
🎓 Step 1: Input financial and academic data in the data sheets (tuition, scholarships, scores, attendance, etc.).
📊 Step 2: Refresh charts automatically — the dashboard updates instantly.
🎯 Step 3: Use the Page Navigator on the left to explore different performance views.
📈 Step 4: Review trends and variances using dynamic visuals and KPIs.
🧩 Step 5: Use insights to plan for upcoming terms, resource allocation, and quality improvement.
Within minutes, your institution will have a live performance dashboard ready for reviews and reporting.
👥 Who Can Benefit from This Vocational Schools Dashboard
🏫 School Administrators: Monitor overall institutional performance in real time.
💰 Finance Teams: Track tuition revenue, scholarships, and net income.
📚 Academic Departments: Evaluate student satisfaction, scores, and attendance.
🎓 Placement Officers: Analyze student employability and placement success.
🌍 Multi-Campus Directors: Compare performance across different regions.
This dashboard empowers every stakeholder — turning complex educational data into clear, visual insights.
🔗 Click here to read the Detailed Blog Post
🎥 Visit our YouTube channel to learn step-by-step video tutorials
👉 YouTube.com/@PKAnExcelExpert
Watch the step-by-step video tutorial:
Compatibility and Requirements
- Works in Microsoft Excel desktop (Excel 2016 or later, or Microsoft 365).
- The page navigator and charts use standard Excel features. Microsoft explains charts in Create a chart from start to finish.
Frequently Asked Questions
Which pages are included?
It has five pages: Overview, Program Analysis, Placement Analysis, Regional Analysis and Monthly Trends, plus data sheets for input.
Which KPI cards are on the Overview page?
Total Tuition Fee, Total Scholarships, Net Tuition Fee and Attendance %.
Can I compare campuses?
Yes. The Regional Analysis page shows tuition fee, average score and satisfaction rating by region.
Does it track student placements?
Yes. The Placement Analysis page shows satisfaction rating, attendance % and scholarships by placement status.
Where do I enter data?
Enter tuition, scholarships, scores and attendance in the data sheets. The charts update from there.
Related Vocational Education Templates
- Vocational Schools Dashboard in Power BI: the same topic for Power BI users
- Vocational Schools KPI Dashboard in Excel: KPI tracking for vocational schools
- Vocational Training Dashboard in Excel: results for training programs
- Vocational Training KPI Dashboard in Excel: KPIs for vocational training
- Education & School Management Bundle: 8 premium education templates in one bundle
Browse all Excel dashboards or the Excel education templates.









Reviews
There are no reviews yet.