



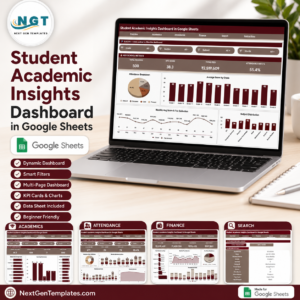
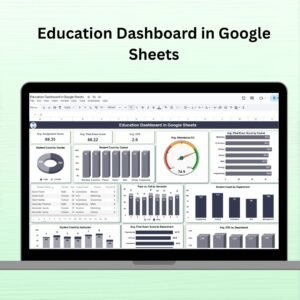
Whether you’re a school administrator, teacher, or educational analyst, the Education Dashboard in Google Sheets is your go-to solution for tracking student performance, monitoring attendance, and driving academic success through real-time data insights. This ready-to-use, easy-to-navigate dashboard helps you visualize and interpret critical student metrics to make faster, smarter decisions.
Built with educators in mind, this Google Sheets dashboard combines the power of data visualization with the flexibility of spreadsheet-based reporting. Perfect for institutions of any size!

✨ Key Features of the Education Dashboard
📘 1. Dashboard Sheet Tab
This is the central view for all academic tracking. You’ll find:
📌 Summary Cards:
Avg. Assignment Score – Understand how students are performing on daily assignments
Avg. Final Exam Score – Spot trends in exam results
Avg. GPA – Monitor academic standing across students
📊 Visual Charts:
Avg. Attendance (%): Identify overall attendance trends
Student Count by Course / Department / Gender / Instructor
Avg. GPA by Department: Gauge which departments are excelling
Pass vs Fail by Semester: Quickly pinpoint at-risk groups
📂 2. Data Sheet Tab
Your data entry hub — no coding or formulas needed.
Enter student scores, attendance, departments, instructors, and more
All dashboard visuals update automatically
Clean, structured table format for easy updates
Add unlimited records — scalable for any institution size
🚀 What’s Inside the Template?
📊 1 Dashboard sheet with cards + dynamic charts
📥 1 Data entry sheet for all student metrics
🎯 Auto-updating visuals
🧩 Fully customizable layout
🖥️ Works across devices — no special tools required
🔒 Secure and cloud-based with Google Sheets
🎓 How to Use the Education Dashboard
Open the Google Sheets file
Go to the Data Sheet and input student records
View real-time visuals in the Dashboard Sheet
Use slicers and charts to explore trends
Share with staff or departments for collaboration
Customize layout or KPIs as needed
👥 Who Can Benefit from This Template?
🏫 School Administrators – Oversee academic health at scale
👩🏫 Teachers – Analyze class performance easily
📈 Education Analysts – Use data to drive improvements
🧑💼 Department Heads – Monitor performance within programs
👨👩👧👦 Tutoring Centers – Track student outcomes and attendance
📘 Click here to read the Detailed blog post
📺 Visit our YouTube channel to learn step-by-step video tutorials
Compatibility and Requirements
- Runs in Google Sheets. All you need is a free Google account and a web browser.
- Charts on the Dashboard sheet update from the Data sheet, and the file can be shared with staff.
- New to Google Sheets? Google’s guide How to use Google Sheets covers the basics.
Frequently Asked Questions
What does the dashboard show?
Summary cards for average assignment score, average final exam score and average GPA, plus charts for attendance, student count by course, department, gender and instructor, average GPA by department and pass versus fail by semester.
Where do I enter student data?
On the Data sheet: scores, attendance, departments, instructors and more. The dashboard visuals update automatically.
Can my colleagues use it too?
Yes. It is a Google Sheets file, so you can share it with staff or departments.
Is there an Excel or Power BI version?
Yes. See the Excel edition and the Power BI edition.
Related Education Templates
- Education Dashboard in Excel: the same dashboard for Excel users
- Education Dashboard in Power BI: the Power BI edition
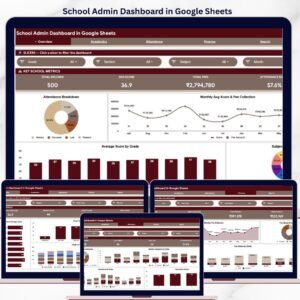
- School Admin Dashboard in Google Sheets: school administration metrics online
- Student Assignment Tracker in Google Sheets: track assignments and due dates
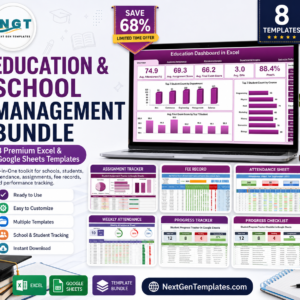
- Education & School Management Bundle: 8 education templates in one download
Browse all Google Sheets dashboards or the Excel education templates.





Reviews
There are no reviews yet.