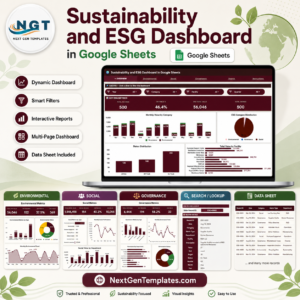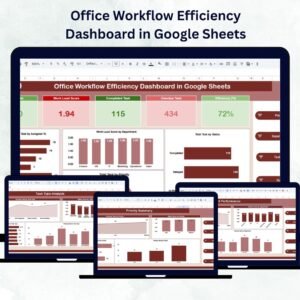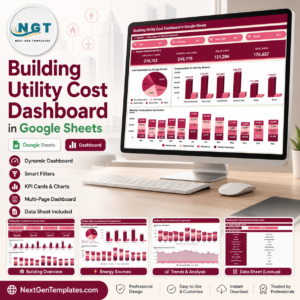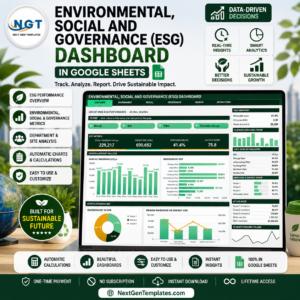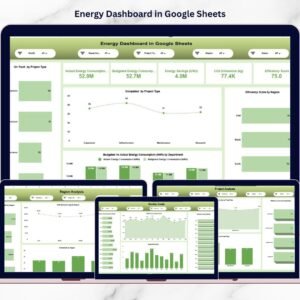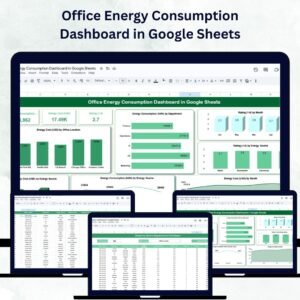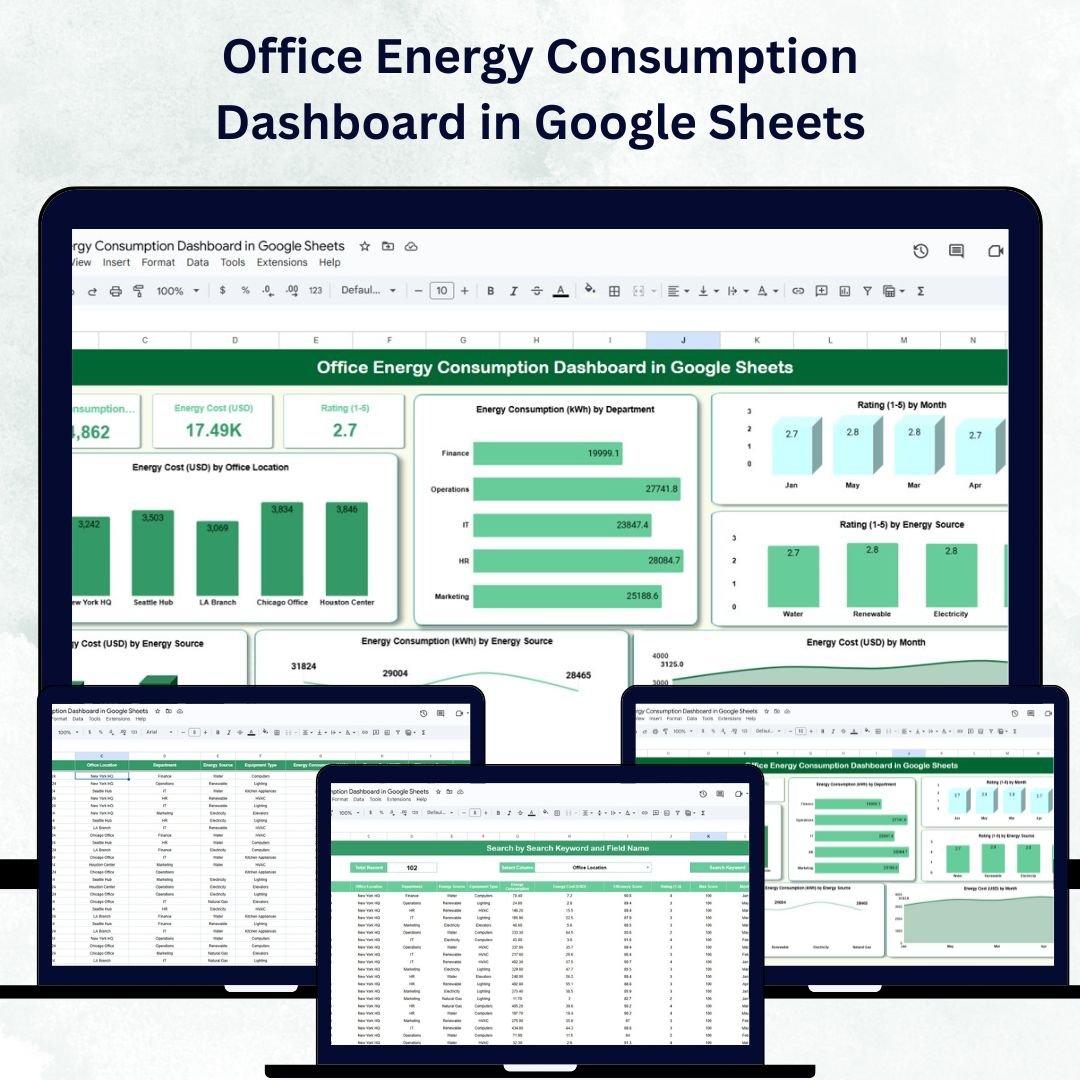
Energy efficiency is no longer just a cost-saving strategy — it’s a business imperative that supports both financial performance and environmental responsibility. The Office Energy Consumption Dashboard in Google Sheets is a ready-to-use, interactive tool designed to help organizations track, analyze, and optimize energy usage across departments and office locations. 📊⚡
Built in Google Sheets, this dashboard empowers facility managers, sustainability officers, and finance teams to monitor energy consumption, evaluate efficiency, and reduce operational costs — all within a user-friendly, collaborative platform. 🌍💼
🔑 Key Features of the Office Energy Consumption Dashboard
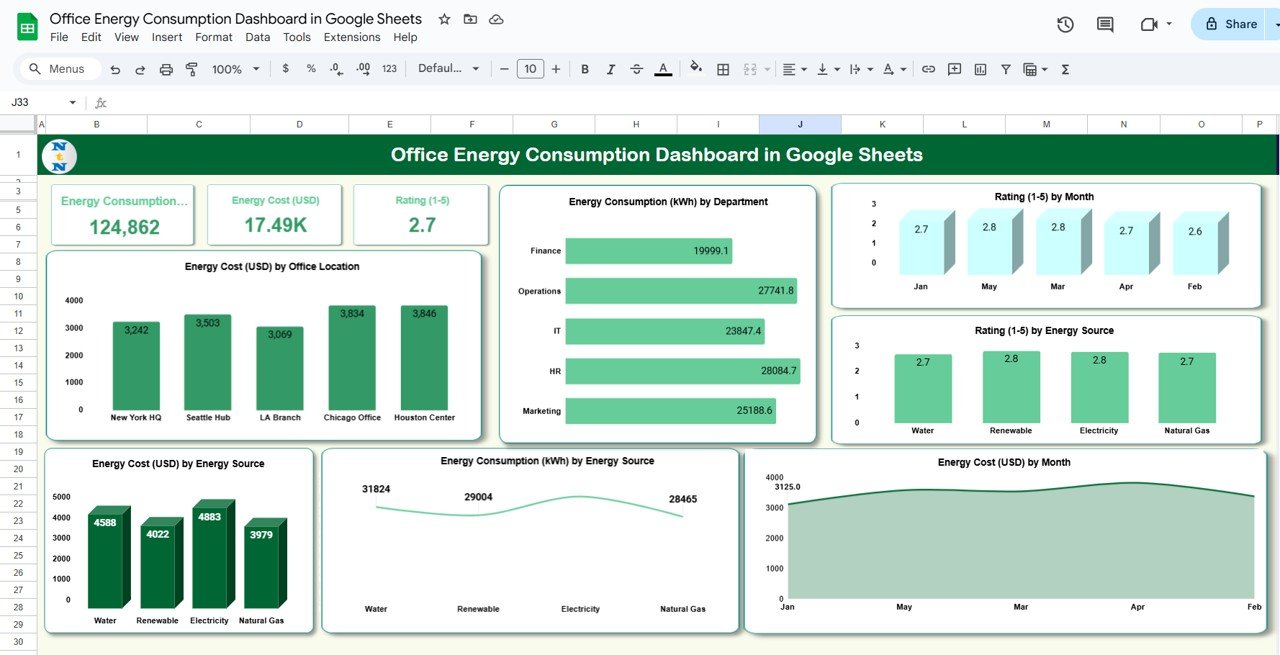
📊 Dashboard Sheet Tab
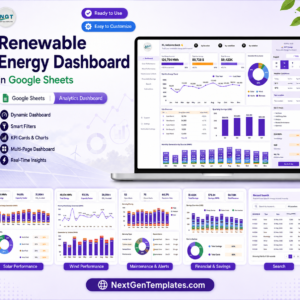
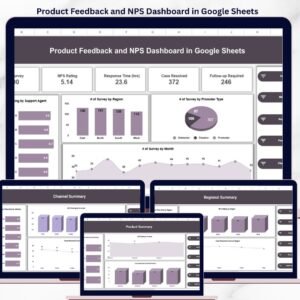
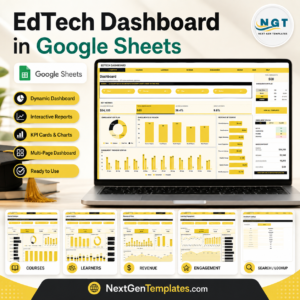
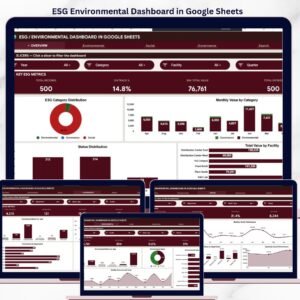
A powerful visual summary of energy usage and costs through key metrics and charts:
Energy Consumption (kWh): Total energy used
Energy Cost (USD): Total spending on energy
Rating (1–5): Sustainability or efficiency performance
Insightful charts include:
Energy Cost by Office Location
Energy Consumption by Department
Rating by Month
Rating by Energy Source (Electricity, Gas, Solar, etc.)
Energy Cost and Consumption by Energy Source
Energy Cost by Month for trend monitoring
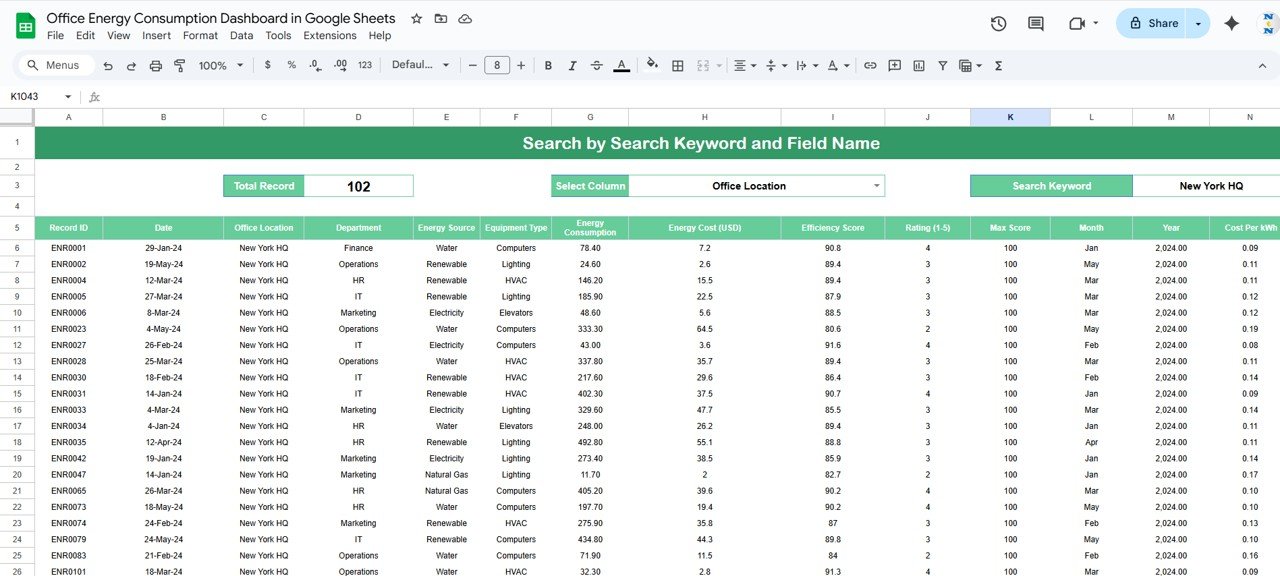
🔍 Search Sheet Tab
Quickly find specific records by keyword or field name
Filter results by department, office location, or equipment type
Perfect for targeted analysis and quick decision-making without scrolling through long data tables
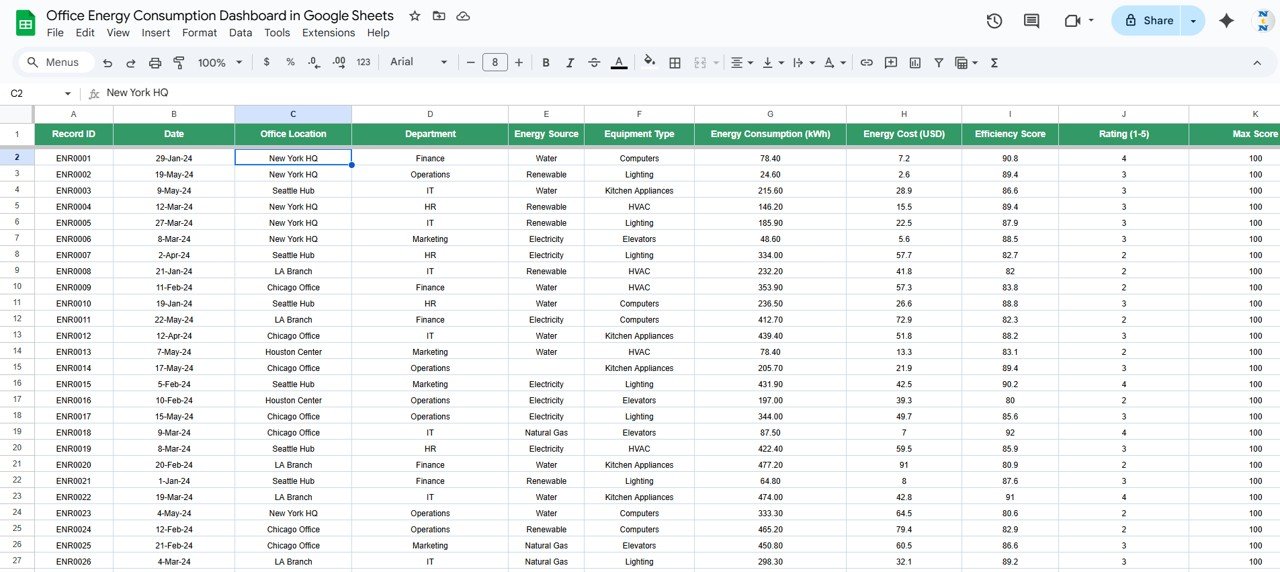
🧾 Data Sheet Tab
Centralized repository for all energy data, including:
Date, Department, Office Location, Energy Source, Cost, kWh, and Rating
Automatic updates to charts and dashboard visuals once new data is entered
Ensures consistent, reliable, and real-time performance monitoring
📦 What’s Inside the Office Energy Consumption Dashboard?
✅ Dashboard Sheet – Interactive charts and key performance cards
✅ Search Sheet – Easy-to-use filter for instant data lookup
✅ Data Sheet – Structured entry sheet with automated updates
✅ Sample Data Preloaded – Helps you understand functionality instantly
✅ Built-in Formulas & Dynamic Charts – No coding required
✅ Customizable Fields – Add your own metrics and energy sources
Everything is designed to be plug-and-play — just add your organization’s energy data and start tracking insights right away. 🚀
🧑💼 Who Can Benefit from This Dashboard?
🌿 Facility Managers – Monitor and control energy consumption across office buildings
💰 Finance Teams – Track energy costs and identify high-expense sources
🏢 Operations Managers – Evaluate departmental energy performance
🌎 Sustainability Officers – Measure and report on environmental KPIs
🧠 Executives & Auditors – Review high-level insights for compliance and strategy
This Google Sheets-based solution is ideal for businesses, nonprofits, and government organizations aiming to manage energy consumption more effectively.
🧪 How to Use the Office Energy Consumption Dashboard
Input Data – Add energy usage and cost details in the Data Sheet
Review the Dashboard – Visualize consumption, costs, and trends instantly
Search for Details – Use the Search Sheet for quick lookups by keyword or field
Monitor Monthly Trends – Identify seasonal patterns or spikes in energy use
Take Action – Implement energy-saving strategies based on data insights
With its clean design and real-time update capability, this dashboard ensures efficiency, accuracy, and collaboration for your entire team. ✅
🌟 Why Choose This Dashboard?
All-in-one energy tracking system in Google Sheets
Real-time collaboration and live updates
Visual insights via interactive charts and metrics
Monitors sustainability and efficiency scores
Fully customizable for any organization
No technical setup required — 100% ready to use
Take charge of your organization’s energy management with the Office Energy Consumption Dashboard in Google Sheets — where data meets sustainability. 🌿📈
🔗 Click here to read the Detailed blog post
Watch the step-by-step video Demo: