

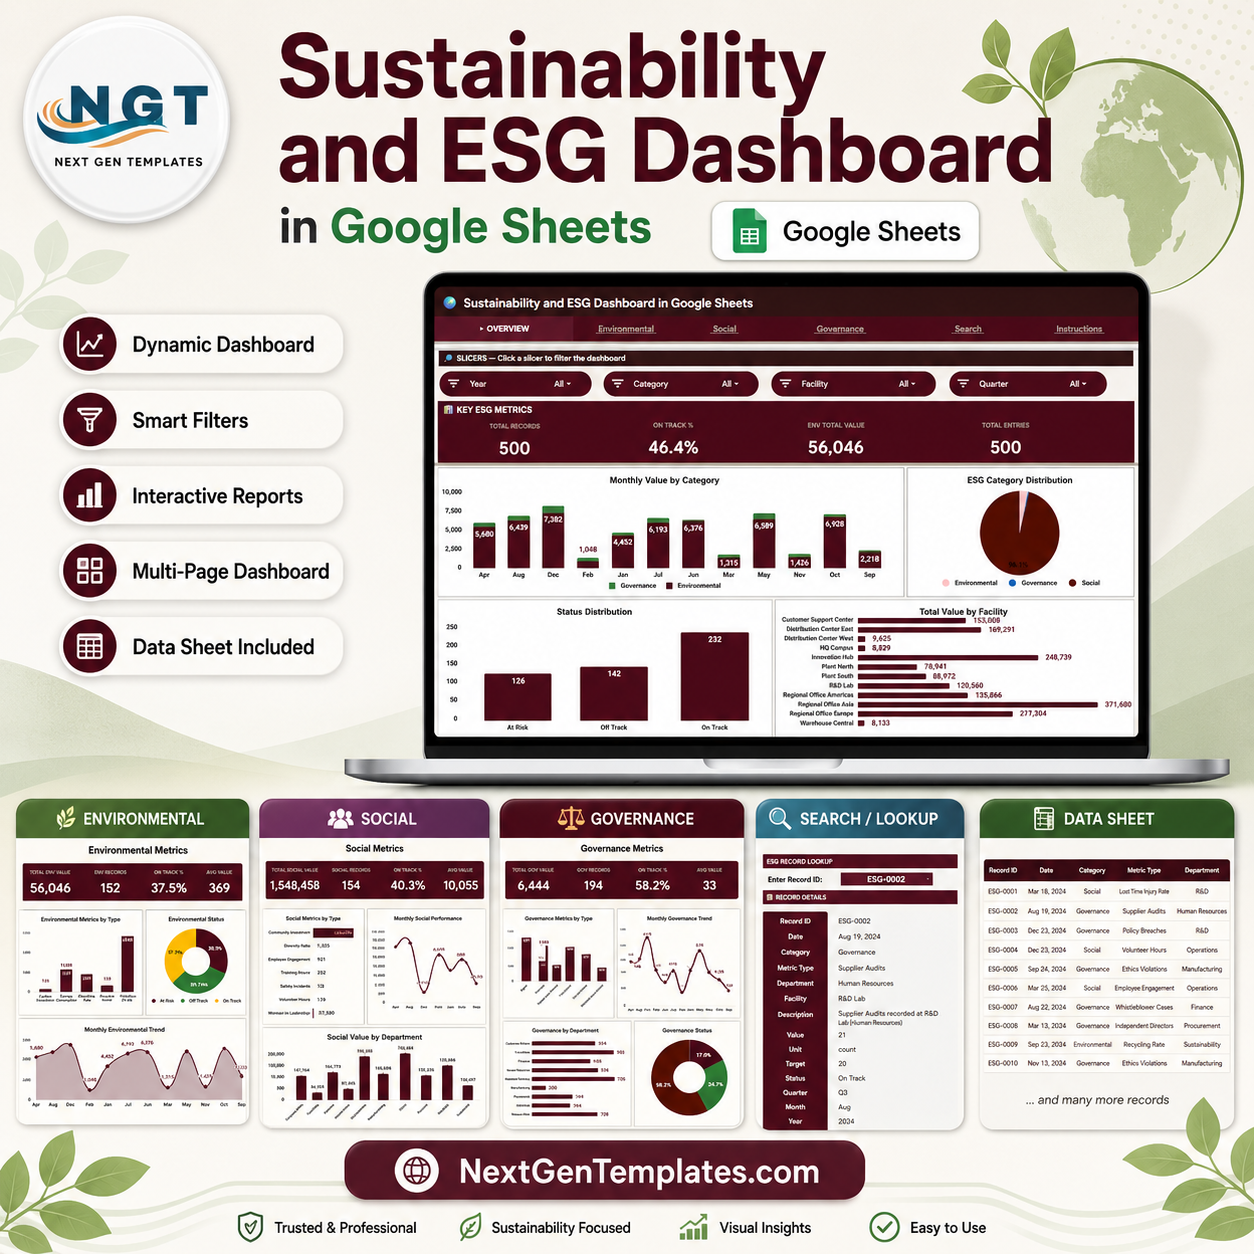
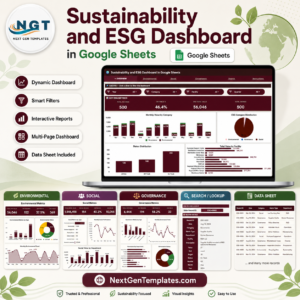
Sustainability and ESG Dashboard in Google Sheets gives ESG teams a ready-to-use reporting workbook with 6 working sheet tabs, 4 overview cards, 16 chart views, multiple slicers, a Record ID lookup sheet, and an editable source data table. Built by PK, a Microsoft Certified Professional with 15+ years of Excel, Google Sheets, and Power BI experience and 300K+ YouTube subscribers, this $9.99 one-time template helps teams move from scattered ESG rows to a clear reporting view without paying for a recurring ESG SaaS tool. It is practical, editable, and intentionally transparent about scope: you bring the data, the dashboard organizes it.
Key Features of Sustainability and ESG Dashboard in Google Sheets
- 4 overview cards: Track Total Records, On Track %, Env Total Value, and Total Entries at the top of the dashboard.
- 6 Google Sheets tabs: Overview, Environmental, Social, Governance, ESG Record Lookup Search Sheet, and Data Sheet.
- 16 chart views: Review ESG value, records, status, facility, department, quarter, month, and metric type patterns.
- Interactive slicers: Filter dashboard pages quickly without rebuilding formulas or charts.
- Dedicated ESG sections: Separate environmental, social, and governance performance into focused tabs.
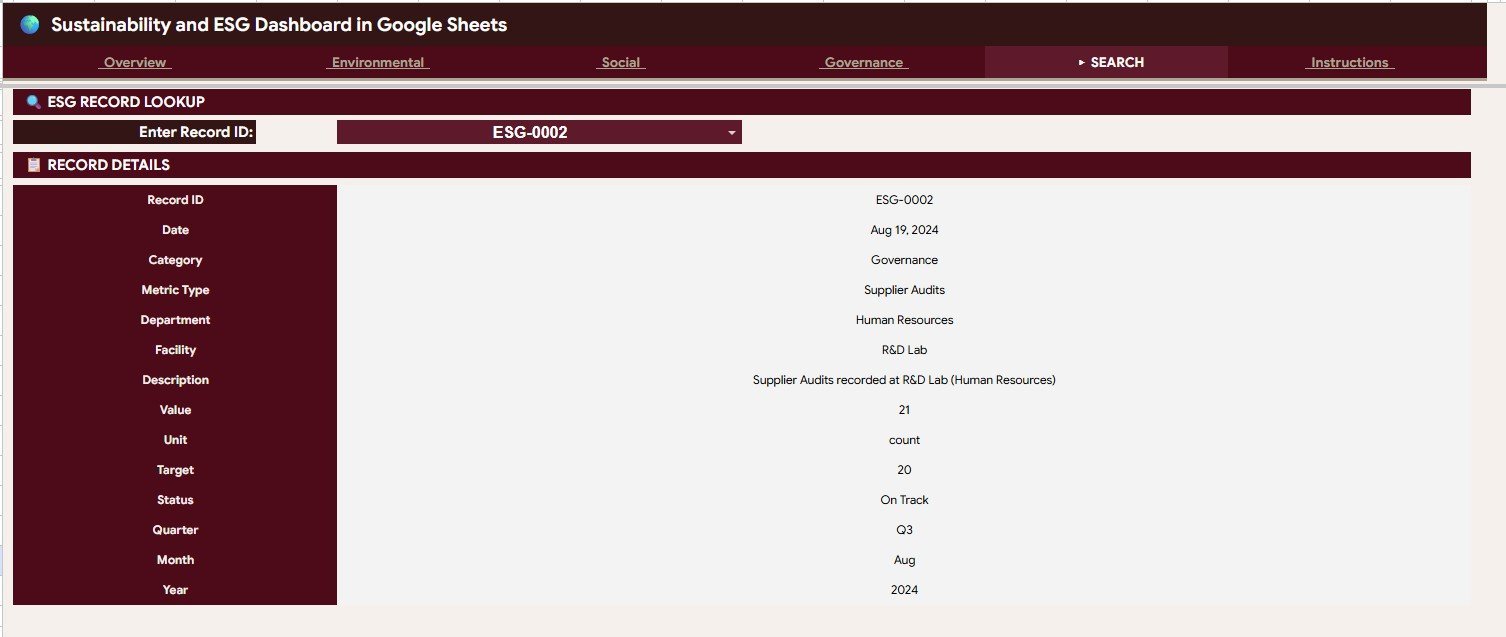
- Record lookup: Select a Record ID and view the full ESG record in one place.
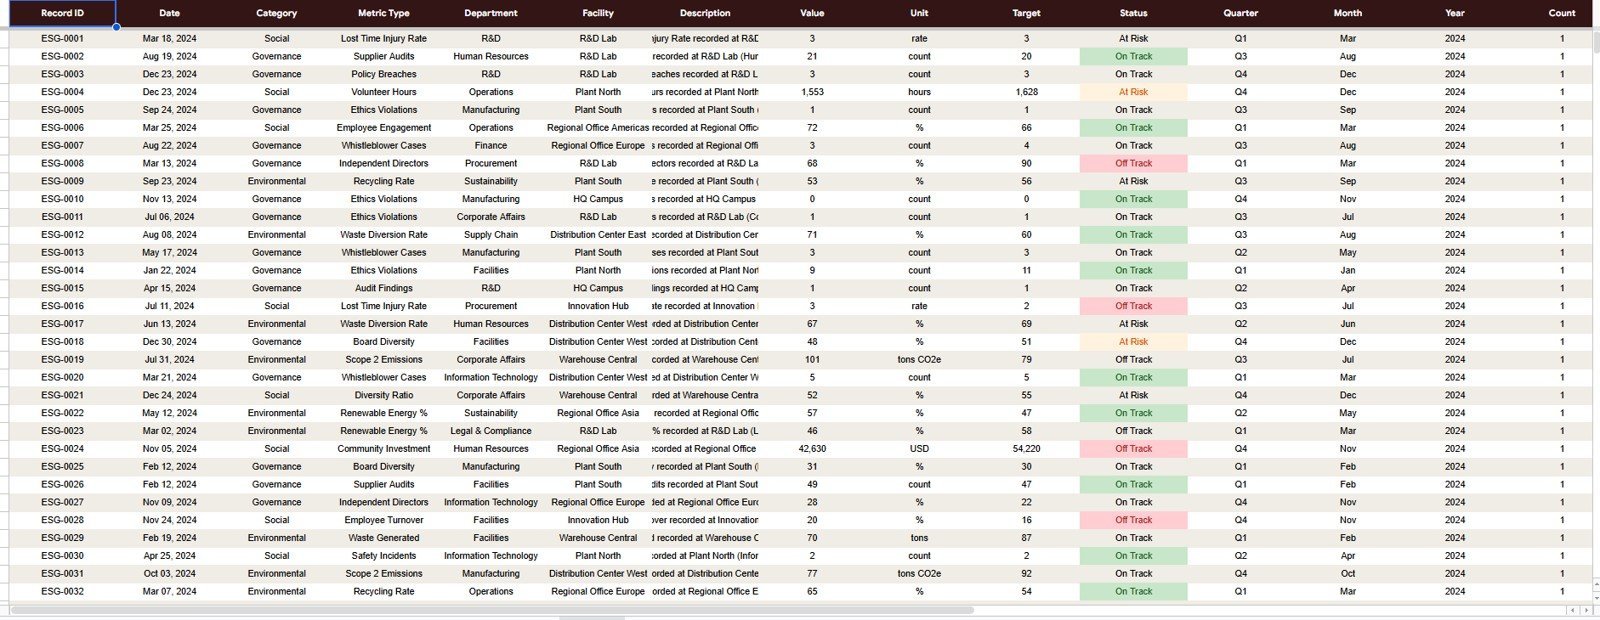
- Editable source data: Replace sample records in the same format and keep the dashboard structure intact.
- Google Drive sharing: Share the copied file with team members using normal Google Sheets permissions.
What’s Inside the Sustainability and ESG Dashboard in Google Sheets
1. Overview Page
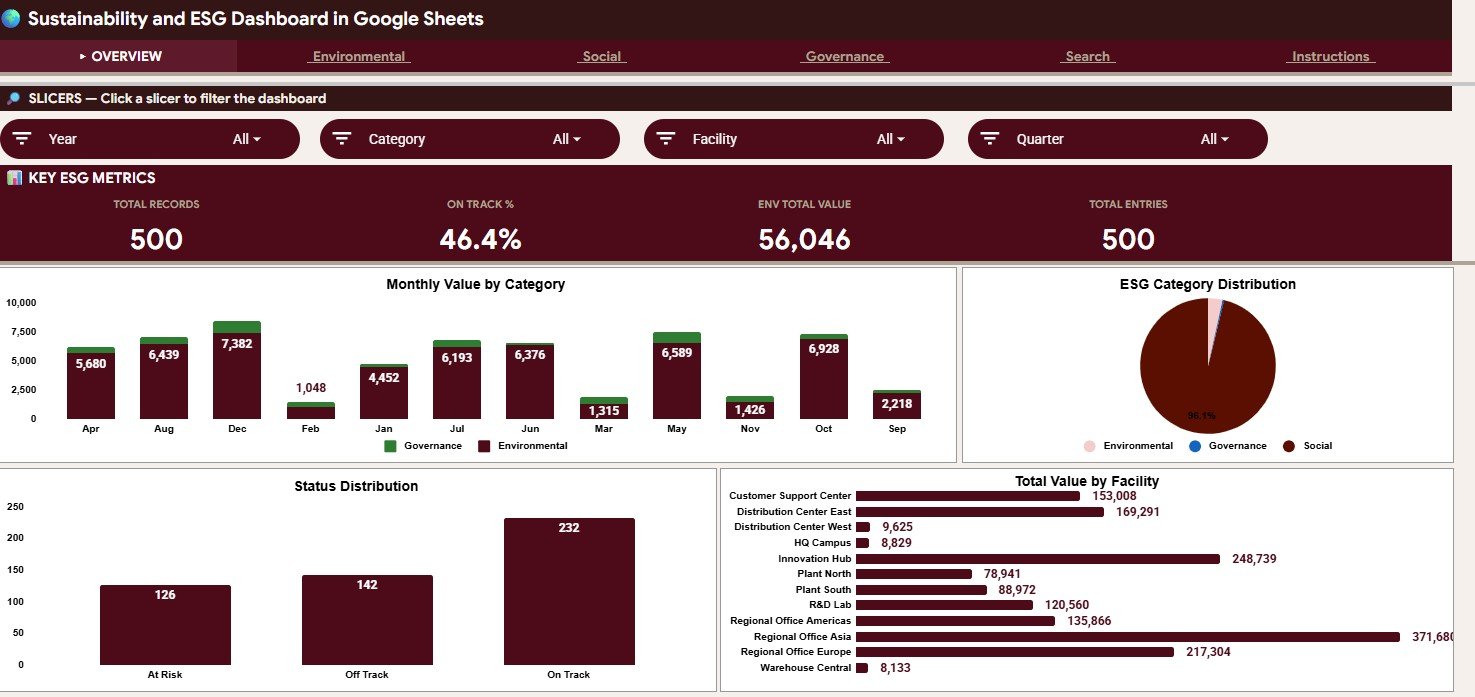
The Overview Page gives a high-level view of sustainability and ESG performance. The top cards show Total Records, On Track %, Env Total Value, and Total Entries, so managers can scan the current reporting picture before opening detailed tabs.
Value by Month and Category: This chart shows how ESG value changes over time across environmental, social, and governance categories. It helps users identify seasonal movement, category-level spikes, and months that deserve follow-up.
Records by ESG Category: This chart compares the number of records assigned to each ESG category. It helps teams see whether reporting activity is balanced or concentrated in one area.
Records by Status: This chart groups ESG entries by status, making it easier to monitor completed, in-progress, delayed, or at-risk records. It supports fast review before stakeholder updates.
Total Value by Facility: This chart compares ESG value across facilities. It helps facility managers and sustainability leads identify which locations are driving the largest reported values.
2. Environmental
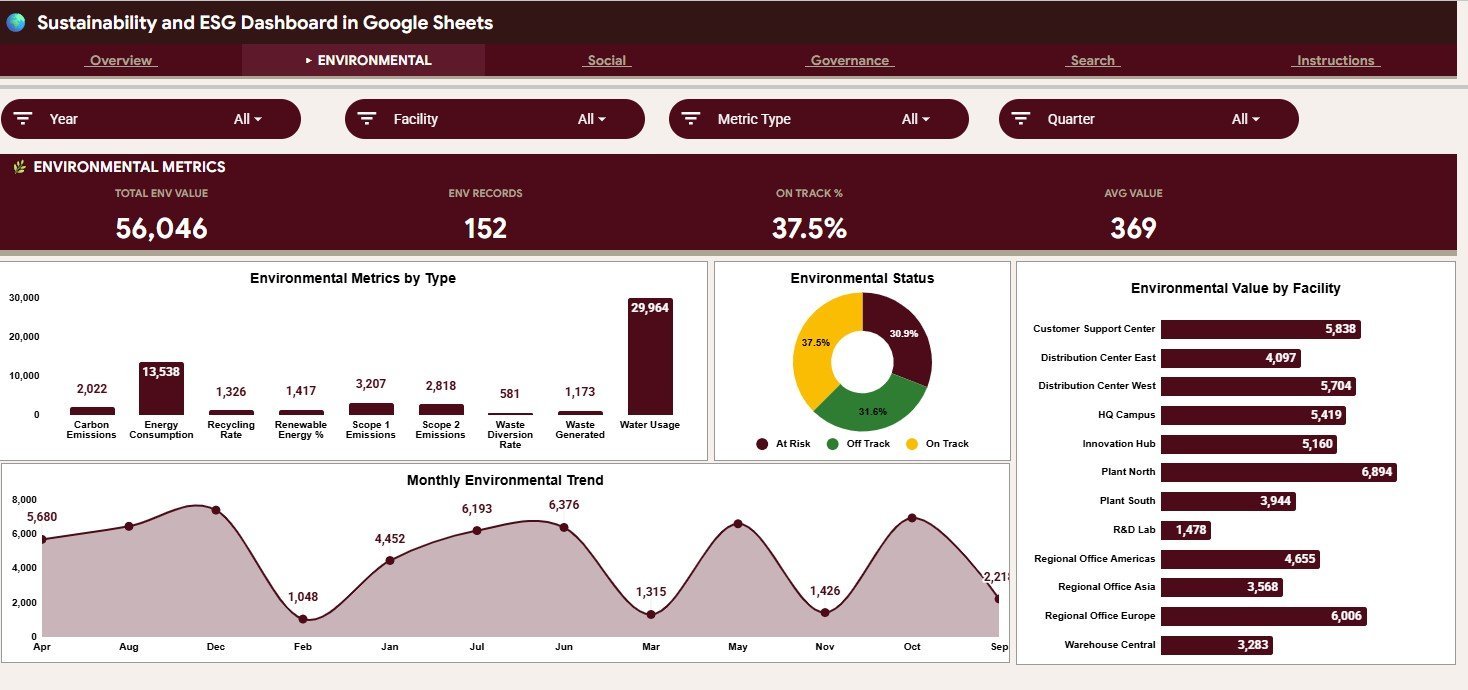
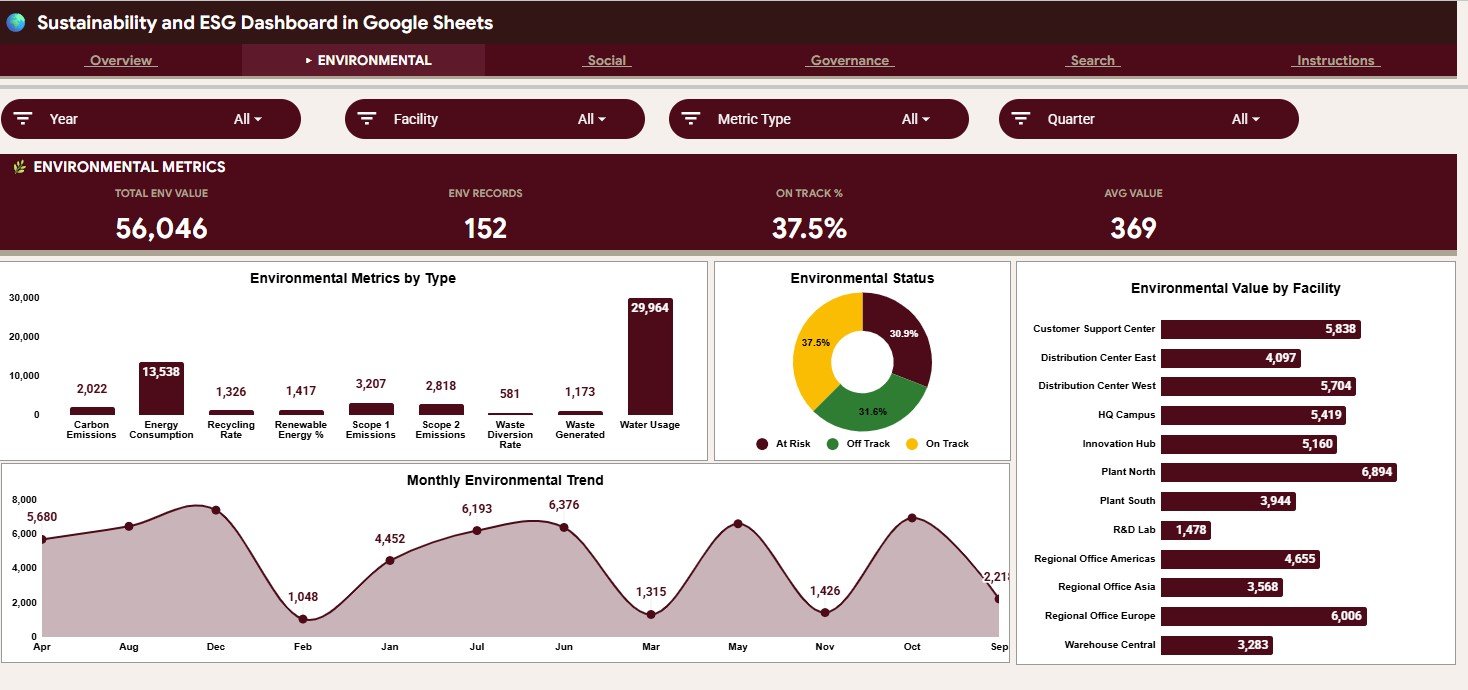
The Environmental tab focuses on environment-related metrics and values. It includes Environmental Value by Metric Type, Environmental Records by Status, Environmental Value by Facility, and Environmental Value by Month so teams can isolate resource, emissions, waste, and facility-level movement.
3. Social
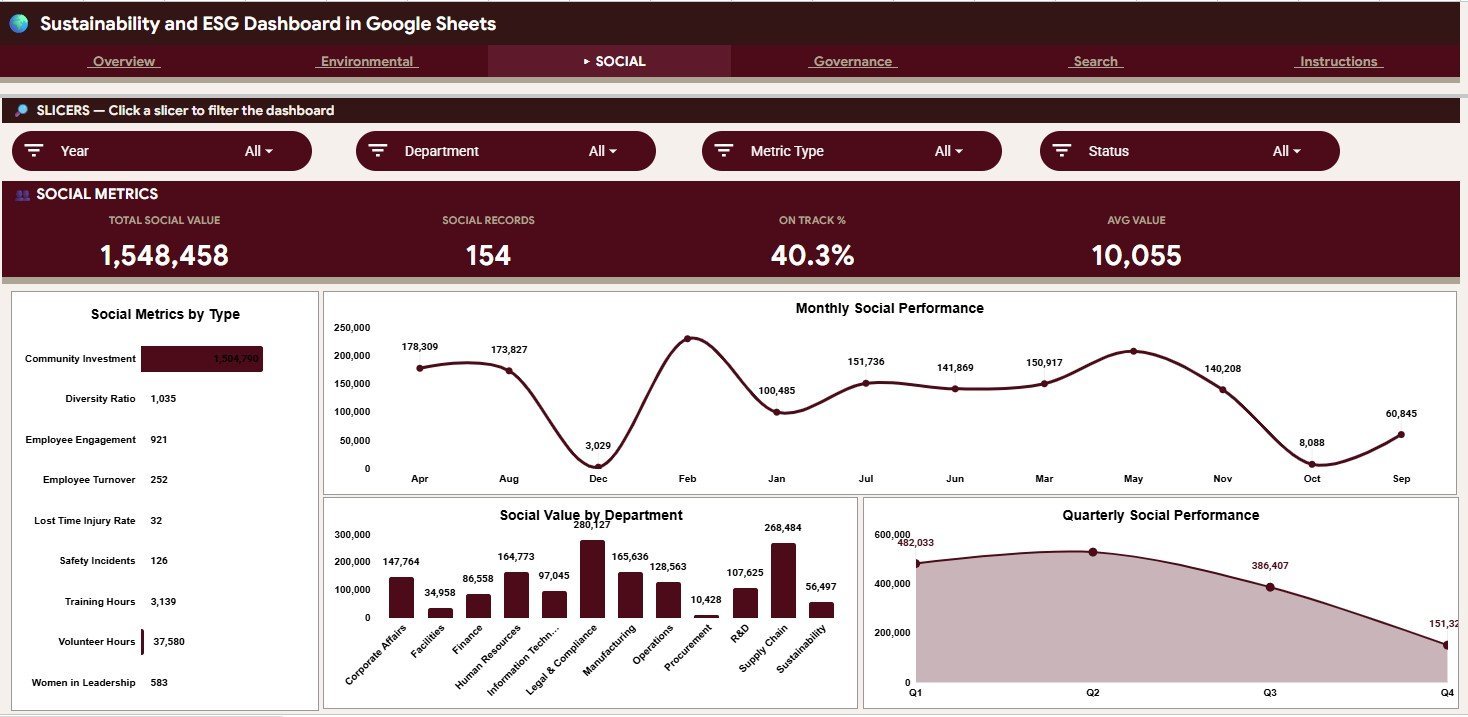
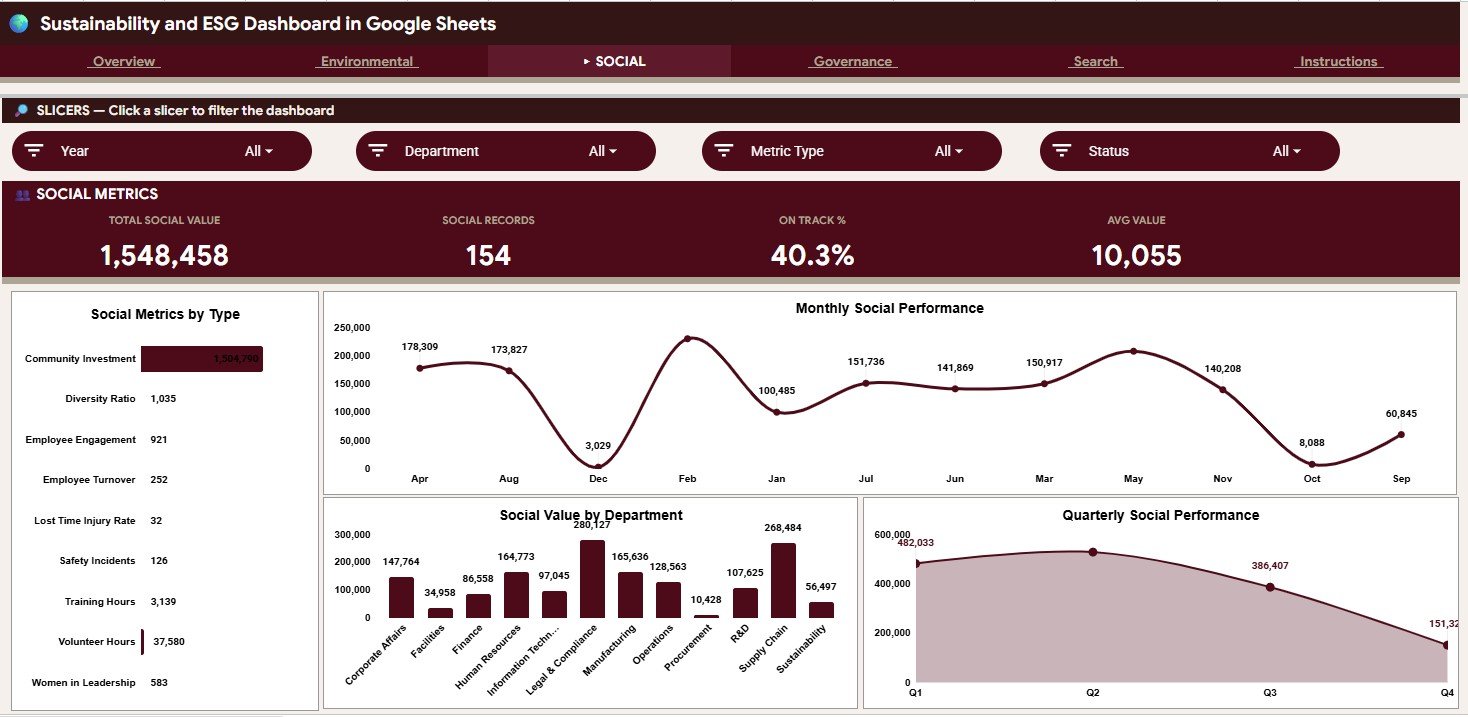
The Social tab organizes people, department, and stakeholder-related ESG records. It includes Social Value by Metric Type, Social Value by Month, Social Value by Department, and Social Value by Quarter to help users review social performance from multiple angles.
4. Governance
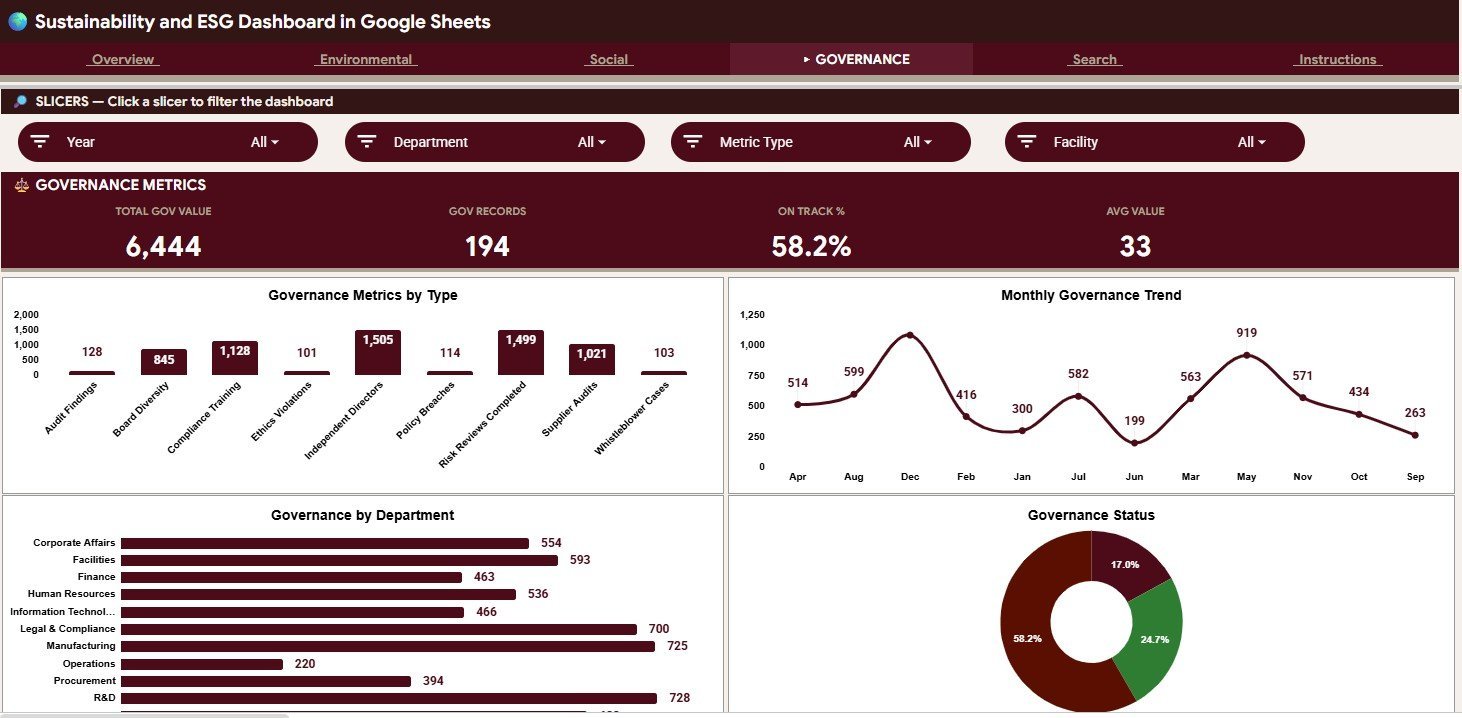
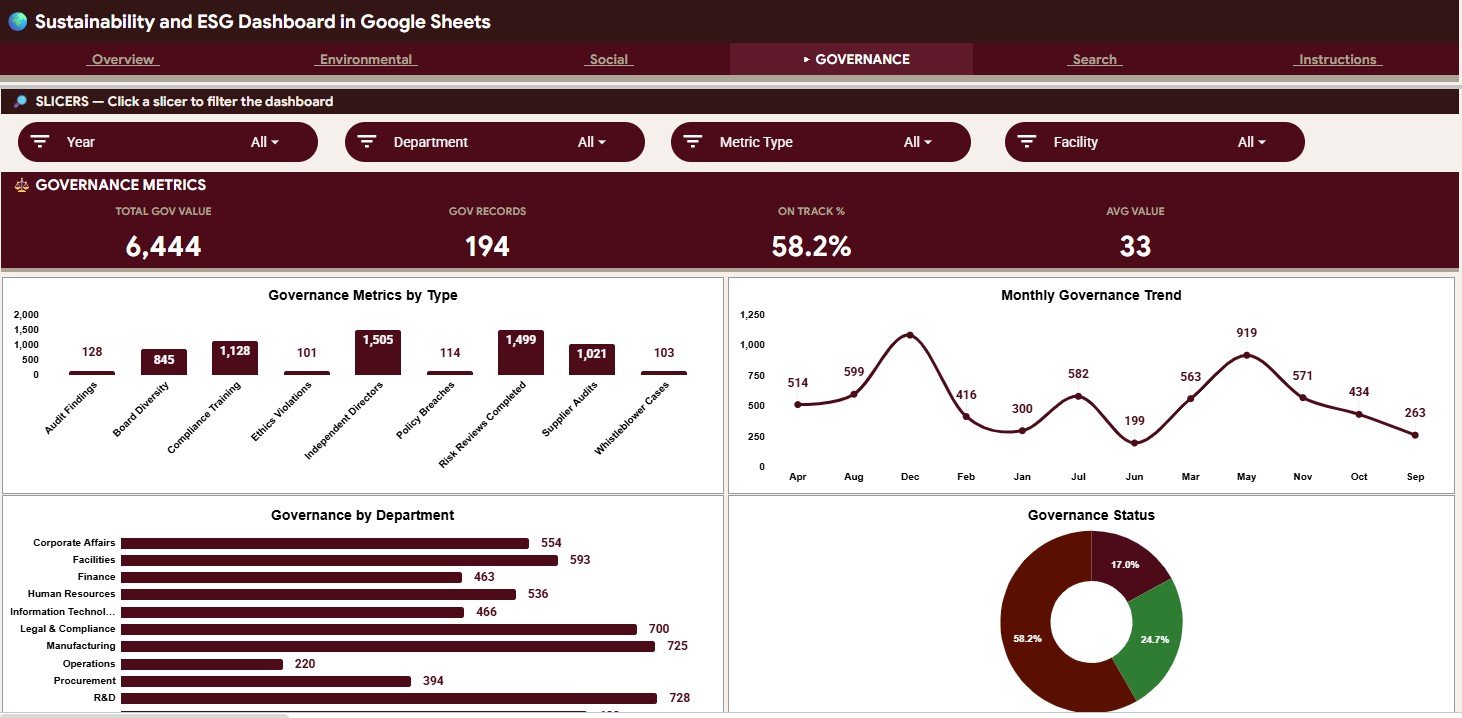
The Governance tab supports compliance, policy, audit, and leadership reporting review. It includes Governance Value by Metric Type, Governance Value by Month, Governance Value by Department, and Governance Records by Status for a focused governance performance view.
5. ESG Record Lookup Search Sheet
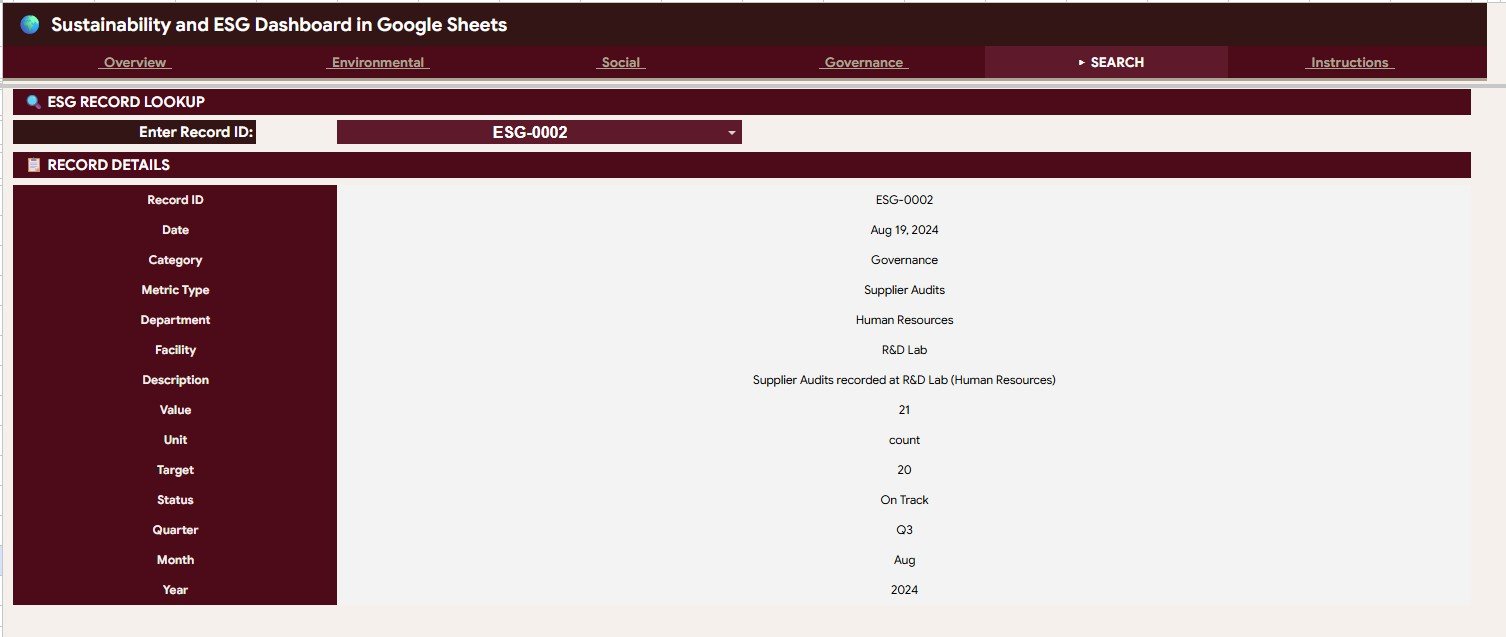
The ESG Record Lookup Search Sheet lets users select a Record ID and instantly view the full ESG record with date, category, metric type, department, facility, description, value, unit, target, status, quarter, month, and year. It is useful when a manager asks for the detail behind one record without scrolling through the data table.
6. Data Sheet Tab
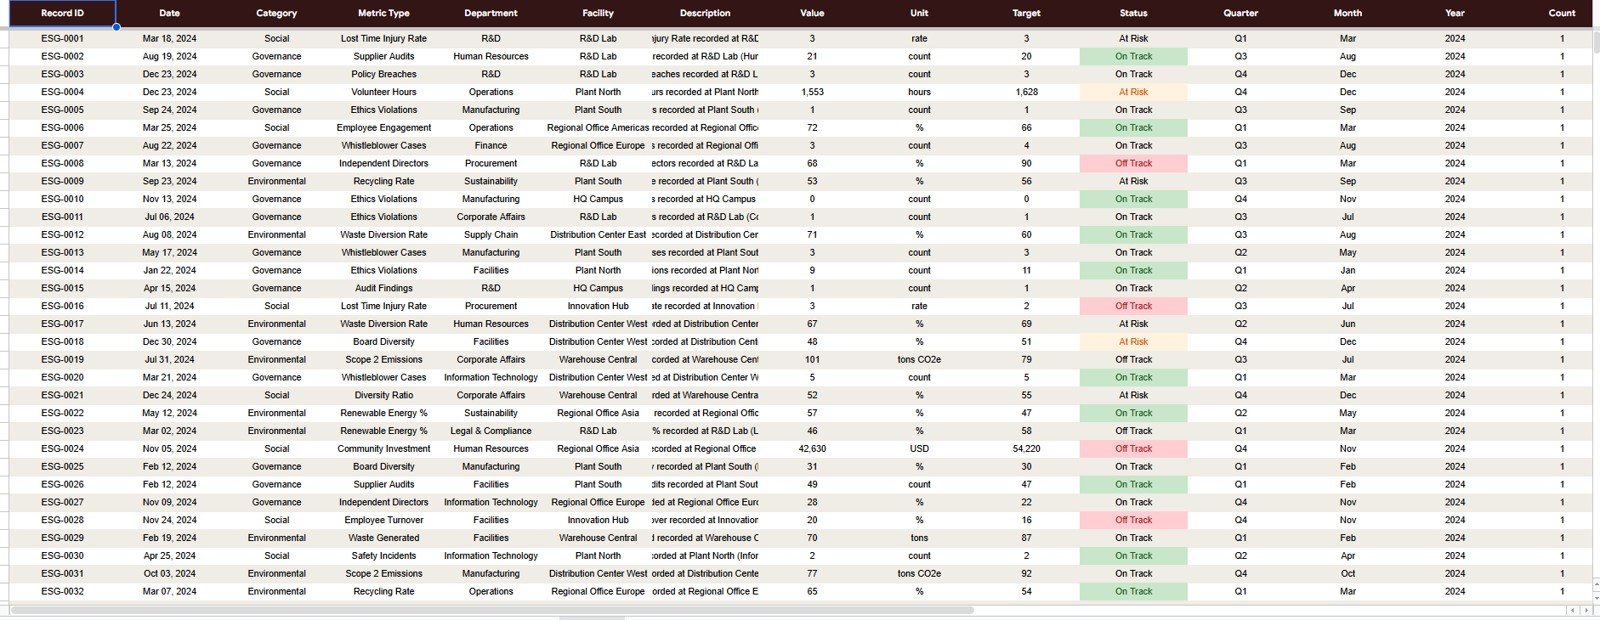
The Data Sheet is the source table for the dashboard. Add ESG records in the same format and keep the headers consistent so the cards, charts, slicers, and lookup sheet continue to work correctly.
Sustainability and ESG Dashboard in Google Sheets vs. Microsoft Excel Dashboard vs. Paid CRM/SaaS – Where This Fits
| Feature | This Google Sheets dashboard | Microsoft Excel dashboard | Paid ESG SaaS |
|---|---|---|---|
| Cost | $9.99 one-time sale price | Template cost plus Excel access | Monthly or annual subscription |
| Platform | Google Sheets in browser | Excel desktop or web | Vendor-hosted cloud platform |
| Setup time | Copy file, replace data, review charts | Open workbook and refresh data | Implementation, onboarding, and configuration |
| Real-time team collaboration | Built into Google Drive sharing | Depends on Microsoft 365 setup | Usually paid-seat based |
| Mobile access | Google Sheets app or browser | Excel mobile app or browser | Vendor app or browser |
| Customizable fields | Edit sheet fields, formulas, labels, and charts | Edit workbook fields and formulas | Limited by vendor configuration |
| Share with link | Yes, through Google Drive permissions | Yes, through Microsoft sharing | Usually login controlled |
| Year-1 cost at 5 users | $9.99 before any Google Workspace cost | Template plus Microsoft licensing | Often hundreds or thousands |
| ESG category coverage | Environmental, social, and governance tabs included | Depends on workbook design | Usually included by module |
| Record lookup | Included through Record ID Search Sheet | Depends on workbook design | Depends on plan and configuration |
Who This Template Is For – and Who It’s Not For
This template is for sustainability managers, ESG analysts, facility managers, operations teams, compliance coordinators, consultants, and small to mid-sized organizations that need a practical ESG reporting layer in Google Sheets.
It is not a live carbon accounting platform, regulatory filing system, audit assurance tool, automatic emissions calculator, ERP connector, or replacement for enterprise ESG governance software. It works best when your ESG records are already available in a structured table and you want to turn them into repeatable reporting views.
How to Use the Sustainability and ESG Dashboard in Google Sheets
- Open the PDF guide after purchase and use the Google Sheets copy link.
- Create your own editable copy in Google Drive.
- Go to the Data Sheet tab and replace the sample ESG records in the same column format.
- Keep Record ID values unique so the lookup sheet returns the right record.
- Use slicers to filter by fields such as category, status, facility, department, month, quarter, and year.
- Review the Overview, Environmental, Social, and Governance tabs during weekly, monthly, or quarterly ESG updates.
Real-World Use Cases
Priya, sustainability manager: Priya uses the Overview and Environmental tabs before monthly ESG meetings to explain value by facility, category, and month.
Marcus, compliance coordinator: Marcus reviews Governance Records by Status and the lookup sheet before internal control updates and audit preparation discussions.
Asha, social impact analyst: Asha uses Social Value by Department and Social Value by Quarter to prepare concise stakeholder reporting notes.
Frequently Asked Questions
Is this dashboard built in Google Sheets?
Yes. The template is designed for Google Sheets and can be copied into your own Google Drive.
What pages are included?
It includes Overview, Environmental, Social, Governance, ESG Record Lookup Search Sheet, and Data Sheet tabs.
Can I replace the sample data?
Yes. Replace the sample rows in the Data Sheet tab while keeping the same headers and structure.
Does it include slicers?
Yes. The dashboard includes slicers so users can quickly filter the charts and cards.
Does the Search Sheet show full ESG record details?
Yes. Select a Record ID to view date, category, metric type, department, facility, description, value, unit, target, status, quarter, month, and year.
Does this automatically submit ESG disclosures?
No. This is a reporting dashboard template, not a regulatory filing or assurance platform.
About the Author
Built by PK – Microsoft Certified Professional with 15+ years of Excel, Google Sheets, and Power BI experience. Founder of NextGenTemplates, reaching 300K+ subscribers across YouTube channels. Every template is hand-built and tested before release.
Explore Related Templates
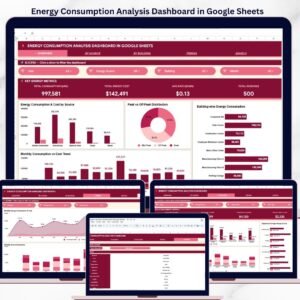
- Energy Consumption Analysis Dashboard in Google Sheets
- Renewable Energy Dashboard in Google Sheets
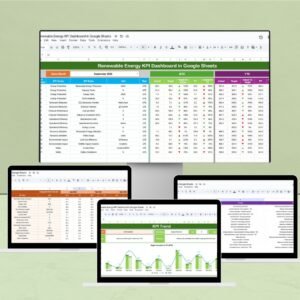
- Renewable Energy KPI Dashboard in Google Sheets
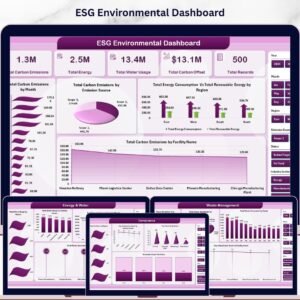
- ESG Environmental Dashboard in Excel
- CSR and Sustainability Performance Tracker in Google Sheets
Browse more Google Sheets templates and Google Sheets dashboard templates.
Read the supporting blog post: Sustainability and ESG Dashboard in Google Sheets.
Download the Sustainability and ESG Dashboard in Google Sheets to turn environmental, social, and governance records into a cleaner reporting workbook.
Watch the step-by-step video Demo:
Last updated: August 12, 2026.






























Reviews
There are no reviews yet.